 Open Access Article
Angular response of photonic crystal based dye sensitized solar cells†
Carmen
López-López
,
Silvia
Colodrero
,
Mauricio E.
Calvo
and
Hernán
Míguez
*
Instituto de Ciencia de Materiales de Sevilla, Consejo Superior de Investigaciones Científicas-Universidad de Sevilla, Avda. Américo Vespucio 49, 41092 Sevilla, Spain. E-mail: h.miguez@csic.es
First published on 1st February 2013
Abstract
Herein we report an experimental analysis of the performance of photonic crystal based dye solar cells (PC-DSCs) as the incident light angle moves away from the normal with respect to the cell surface. Nanoparticle multilayers operating at different wavelength ranges were coupled to the working electrode of a dye solar cell for this study. The interplay between optical and photovoltaic properties with the incident light angle is discussed. We demonstrate that an efficiency enhancement is attained for PC-DSCs at all angles measured, and that rational design of the photonic crystal back mirror leads to a reduction of the photocurrent losses related to the tilt angle of the cell, usually labeled as cosine losses. Angular variations of the cell transparency are also reported and discussed. These angular properties are relevant to the application of these solar devices in building integrated photovoltaics as potential window modules.
Introduction
Research on dye solar cells (DSCs) has become widespread due to the attractive possibility of generating electricity utilizing inexpensive materials and fabrication techniques.1,2 These are photovoltaic devices in which the absorption of sunlight is realized by dye molecules attached to the inner surface of a wide band gap semiconductor oxide film soaked by a redox electrolyte. In order to increase the optical path travelled by photons in the electrode, thus increasing the probability of photon absorption and giving rise to higher power conversion efficiency, many strategies have been followed. Today, all record cells make use of a diffuse scattering layer on top of the electrode, normally composed of larger TiO2 particles with diameters on the order of hundreds of nanometers, which reflects light back into the cell in random directions.3–6 Experimental and theoretical studies on the subject led to the conclusion that such an optical design yielded optimum cell performance.7–9 However, a price has to be paid to obtain a high efficiency cell using this approach: multiple scattering caused by disordered particles deposited on the back side of the electrode renders the cell opaque, thus preventing their potential application as window modules. Recently, some approaches have been proposed to enhance the efficiency of DSCs while preserving their transparency. Refractive elements, such as microprisms of different shapes coupled to the topside of the cell, can be employed to modify the light input angle.10,11 In this case, the enhancement is achieved by reducing the reflection losses occurring at large angles of incidence. Also, photonic structures of different sorts have been introduced within the cell12–20 to act as either back reflectors, diffractive elements or local light field enhancers. Among them, photonic crystals have proved to significantly improve the efficiency while maintaining transparency in well-defined designed spectral regions.16,17 Enhancement in this case results from the intense reflection of unabsorbed radiation back into the photoactive electrode in a specific wavelength range determined by the spectral width of its photonic bandgap. At the same time, photonic multilayers can be devised to present a Bragg peak that matches the absorption band of the dye but has no effect on longer wavelengths, maintaining a great deal of the transparency of the cell. Although transparency is one of the most attractive features of these cells as long as building integration is concerned, other factors governing their performance should also be taken into account in order to employ them as window modules, the angular dependence of the photovoltaic response on the input light angle being one of the most relevant ones. Angular effects, which are significant for any type of solar cell, are expected to become particularly complex when photonic structures are introduced to enhance the efficiency, since they present intrinsic optical anisotropy.The aim of this paper is to study the interplay between the angle of incidence of incoming radiation and the most relevant optical and photovoltaic parameters of photonic crystal based dye solar cells (PC-DSCs). To carry out this task, one-dimensional photonic crystals (1DPCs) reflecting different wavelength ranges, which overlap diverse regions of the dye absorption band, are designed and integrated within the DSC. We observed that the degree of both transparency and photocurrent enhancement, typically observed for such PC-DSCs, depends strongly on the angular variation of the Bragg reflection in all cases. The relative position of the dye absorption band and the reflection at each angle determines both parameters. Also, we demonstrate that PC-DSCs can be designed to reduce the energy losses caused by the tilt of the incident light away from the cell normal, usually known as cosine losses.
Experimental section
Preparation of TiO2 electrodes
Transparent 5 μm thick TiO2 electrodes with active areas of 0.25 cm2 made of 20 nm sized particle paste (18-NRT, Dyesol®) were deposited via screen printing on top of the FTO glass substrate (TEC 11 Ω cm−2, Nippon Sheet Glass). After this, films were thermally treated using successive annealing steps in order to sinter the particles and remove the organic components from the TiO2 paste. First, they were heated for 15 min at 180 °C. Temperature was then increased at a rate of 15 °C min−1 up to 450 °C and held for 15 min. A final annealing treatment at 500 °C was carried out for 15 min. All electrodes used in this work were carefully selected after checking them using a motorized profilometer (Mahr®-perthometer PGK), so that they could be employed for an appropriate comparison between reference and PC based cells. Thickness variation with respect to the total thickness of the film was in the range of ±5% in all cases.Preparation of one-dimensional photonic crystals coupled to TiO2 electrodes
1DPC structures were built by spin coating deposition of SiO2 and TiO2 nanoparticle suspensions on top of the working electrodes. SiO2 nanospheres (average size of 30 nm) were purchased from Dupont (34 wt% suspension in H2O, LUDOX® TMA), while TiO2 nanocrystallites in a final concentration of 25 wt% (average size of 6 nm) were synthesized using a procedure previously reported.21 In order to prepare the precursor suspensions to employ during the deposition process, both types of nanoparticles were suspended in a mixture of water (21 vol%) and methanol (79 vol%). TiO2 dispersions also contained a certain amount of polymer (PEG 20000, Fluka) following the weight relationship of PEG![[thin space (1/6-em)]](https://www.rsc.org/images/entities/char_2009.gif) :
:![[thin space (1/6-em)]](https://www.rsc.org/images/entities/char_2009.gif) TiO2 = 0.5, which has been proved to yield highly porous but transparent films.22 The periodic structure was then fabricated by stacking 8 alternate layers made of such suspensions using a spin coater Laurell WS-400E-6NPP working at a final speed of 5000 rpm and an acceleration of 9180 rpm s−1. After each deposition of TiO2/PEG suspension, a heat treatment (300 °C 15 min) was used to remove the polymer, hence creating larger pores within the structure. Finally, all samples were annealed at 450 °C for 30 min, with a heating rate of 15 °C min−1, to mechanically stabilize the multilayer. To achieve the 1DPCs reflecting different wavelength ranges, the concentration of the SiO2 precursor suspension used was 2 wt% while the concentration of TiO2 nanoparticles in the suspension was slightly varied, 3 wt% for DSC-B (blue-reflecting), 4 wt% for DSC-G (green-reflecting) and 5 wt% for DSC-R (red-reflecting).
TiO2 = 0.5, which has been proved to yield highly porous but transparent films.22 The periodic structure was then fabricated by stacking 8 alternate layers made of such suspensions using a spin coater Laurell WS-400E-6NPP working at a final speed of 5000 rpm and an acceleration of 9180 rpm s−1. After each deposition of TiO2/PEG suspension, a heat treatment (300 °C 15 min) was used to remove the polymer, hence creating larger pores within the structure. Finally, all samples were annealed at 450 °C for 30 min, with a heating rate of 15 °C min−1, to mechanically stabilize the multilayer. To achieve the 1DPCs reflecting different wavelength ranges, the concentration of the SiO2 precursor suspension used was 2 wt% while the concentration of TiO2 nanoparticles in the suspension was slightly varied, 3 wt% for DSC-B (blue-reflecting), 4 wt% for DSC-G (green-reflecting) and 5 wt% for DSC-R (red-reflecting).
Fabrication of DSSCs
The working electrodes were heated at 120 °C for 3 hours and immersed overnight into a 0.2 mM dye solution (N719, Solaronix®) using ethanol as a solvent, which ensures a proper adsorption of the dye onto the TiO2 surface. After the immersion they were rinsed with ethanol and dried. Counter electrodes were made by drop deposition of colloidal platinum paste (Platisol T, Solaronix®) onto a conductive FTO glass substrate and heated at 400 °C for 15 minutes at a rate of 10 °C min−1. Both electrodes were sealed using a thermo-polymer (Surlyn 30, Dyesol®). The cells were finally filled with the liquid electrolyte through two holes made previously at the back of the platinized counter electrode. The electrolyte composition was 100 mM I2 (Aldrich, 99.999%), 100 mM LiI (Aldrich, 99.9%), 600 mM [(C4H9)4N]I (Aldrich, 98%), and 500 mM 4-tert-butylpyridine (Aldrich, 99%), using 3-methoxy propionitrile (Fluka, ≥99%) as a solvent. The optimized pore network of the multilayer structure allowed the electrolyte to flow through it and soak the electrode. Reference DSCs were made using TiO2 electrodes of the same thickness but without including any photonic structure.Optical and photovoltaic characterization
Ballistic transmittance spectra were recorded using an ultraviolet-visible scanning spectrophotometer (SHIMADZU UV-2101PC). Total reflectance spectra of photonic crystals integrated in the cells were obtained using an integrating sphere operating in the UV-vis range attached to this spectrophotometer and illuminating from the counter electrode. I–V characterization was carried out with a solar simulator (Sun 2000, Abet Technologies) including a 150 W arc xenon lamp and the appropriate filter to replicate the AM1.5 solar spectrum. The incident light power was confirmed to be 100 mW cm−2 using calibrated silicon solar cells. I–V curves were obtained by applying an external bias to the cell and measuring the generated photocurrent with a digital source meter (Keithley 2400). Incident photon to collected electron (IPCE) efficiency measurements were performed using a system composed of a 300 W xenon lamp, a monochromator with 1140 lines per mm grating (Model 272, Mcpherson) controlled by a digital scan drive system (Model 789A-3, Mcpherson) and a picoammeter (Keithley 6485). A UV filter with a cut-off wavelength of 400 nm was used to remove the second order harmonics exiting the monochromator. A silicon photodiode with calibration certificate (D8-Si-100 TO-8 Detector, Sphere Optics) was used to correct the cell response.Angular measurements were taken using a sample holder attached to a rotating stage, with an angular scale resolution of 10 arc min. In this study 0° refers to light incidence normal to the cell surface. A black mask was used around the TiO2 electrode and its lateral sides to prevent spurious light reflections and refractions, which might largely contribute to the cell response and lead to erroneous interpretations, as it has been recently pointed out.23 The reproducibility and reliability of all results herein presented was confirmed by realizing three cells of each type and performing the same structural and photovoltaic characterization.
Results and discussion
In order to study the interplay between optical and photovoltaic properties of 1DPC based DSCs with the incident light angle, three periodic structures reflecting different and well-defined wavelength ranges in the visible light spectrum are stacked on top of transparent nc-TiO2 electrodes. These nanoparticulated structures act as back reflectors increasing the chance of unabsorbed photons to be harvested by the dye molecules. Their highly porous network allows the electrolyte to pass through them and soak the photoactive layer.22 A drawing of a PC-DSC is displayed in Fig. 1A. Total reflectance spectra obtained under rear illumination conditions of 1DPC based DSCs, in which Bragg mirrors of different lattice parameter were introduced (DSC-B,G and R), are shown in Fig. 1B. The absorption curve of a N719 dye sensitized TiO2 film with a similar thickness to those of the electrodes employed in the solar devices is also plotted for the sake of comparison.24 The largest spectral overlap between reflectance and the ruthenium dye absorption occurs in the case of the cell that incorporates the PC whose reflectance peaks in the green, DSC-G (green dotted line). Please notice that the reflectance peak of the blue reflecting PC appears considerably narrower as a result of the overlap with the electrolyte absorption band.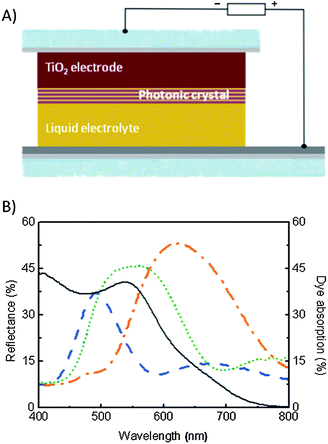 | ||
| Fig. 1 (A) Scheme of a DSC in which a 1DPC has been integrated. (B) Total reflectance spectra of three DSCs coupled to different 1DPCs, namely DSC-B (blue dashed line), DSC-G (green dotted line) and DSC-R (orange dash-dotted line). 1DPCs are integrated in the cell and hence infiltrated with electrolyte after dye sensitization. The absorption of a sensitized electrode is also plotted (grey solid line). | ||
The spectral position of the reflection maximum, λB, of a multilayer made of two types of alternating films of thicknesses t1 and t2 and refractive indices n1 and n2, respectively, depends on the incident angle with respect to the surface normal, θ, as expressed in the equation:
 | (1) |
 | (2) |
Transmittance spectra from 0° to 60° were recorded to evaluate the illumination angle effect on the transparency of the DSC under study (Fig. 2A–D). The evolution of the spectral dependence of the transmittance of the cell used as the reference clearly indicates that it gradually loses transparency as the angle varies from 0° to 60° (Fig. 2A), which is a direct consequence of the increase both of the reflectance at the air–glass interface, according to Fresnel laws, and of the absorption, since the optical path through the active layer is longer. On the other hand, the changes observed in the transmittance curves of the PC-DSC (Fig. 2B–D) are more complex, being mainly determined by the shift to shorter wavelengths of the Bragg peak given by eqn (1). For the transmittance spectra corresponding to DSC-B (Fig. 2B), the effect of the spectral downshift of the Bragg peak is screened by the absorption of other components of the cell, such as the TiO2 and the electrolyte. However, gradual modifications are clearly observed for DSC-G and DSC-R (Fig. 2C and D, respectively). Angular color changes are noticeable by the naked eye (please see the pictures provided in the ESI, Fig. S2†).
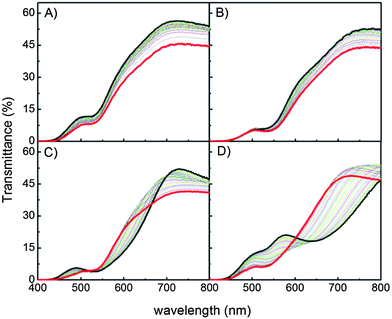 | ||
| Fig. 2 (A–D) Transmittance spectra recorded for a reference DSC (A), and different PC-DSCs, namely DSC-B (B), DSC-G (C) and DSC-R (D) from 0° (thick grey line) to 60° (thick red line). | ||
The perceived transparency, τν, of the whole set of DSCs is calculated from the transmittance spectra following the expression based on the methodology prescribed in ISO 9050:2003, applicable to all transparent materials:
 | (3) |
In Fig. 3A we plot the transparency of the cells evaluated through eqn (3) as a function of the incident light angle. Regarding the trends observed as the angle increases, the reference cell transparency decreases monotonically as expected from the larger absorption caused by an increment of the light path inside the active layer and by the decrease of the light coupling resulting from the higher reflection at the air–glass interface. On the other hand, the transparency of the PC-DSC shows a very different angular variation in each case. The more the Bragg peak and the absorption band of the ruthenium dye overlap, the higher the light harvesting effect and thus the lower the transparency should be. However, although this effect normally makes PC based cells less transparent than the corresponding reference, they can also undergo a rise of transparency when the Bragg peak position is shifted with respect to the absorption band of the dye as a result of tilting. This explains why the transparency of DSC-G increases with the incident angle, while the opposite trend is found for DSC-R. To show this different behaviour more clearly, transparency is normalized to its value at normal incidence (θ = 0°).
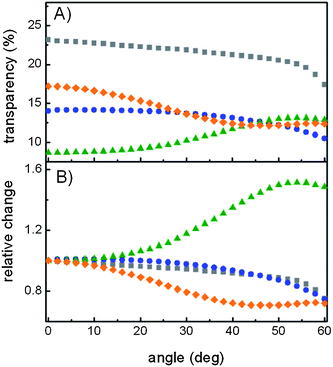 | ||
| Fig. 3 (A) Transparency data obtained from transmittance curves versus incident light angle and (B) normalized transparency to its value at normal incidence for a reference DSC (grey squares), DSC-B (blue circles), DSC-G (green triangles) and DSC-R (orange rhombi). | ||
To evaluate the effect of the incident angle of the solar radiation on the photovoltaic properties of the cells the current intensity–voltage (I–V) characteristic curves were acquired. A clear photocurrent density (JSC) increase for all the angles measured (0° to 60°) is attained for those devices in which the 1DPCs have been integrated. Examples of I–V curves extracted between θ = 0° and 50° are displayed in the ESI† (S3). At normal light incidence, the photonic crystal based cell referred to as DSC-G (green dotted line), whose photonic band gap has a larger overlap with the absorption band of the ruthenium dye, gives rise to the largest photocurrent enhancement, whereas at larger incoming light angles the photocurrents generated by the different PC-DSCs are similar. This behaviour is again the result of the downshift of the spectral position of the reflectance peak of the PCs as the incident light angle moves away from the normal incidence expressed in eqn (1).
A detailed analysis of the variation of JSC with incident light angle was also performed. Results are shown in Fig. 4. As the cell is tilted with respect to the incident beam the effective cross-section or the apparent surface of the device decreases. The intensity of light, I, from a collimated beam impinging on an inclined plane follows Lambert's cosine law:
| I(θ) = I(0)cos(θ) | (4) |
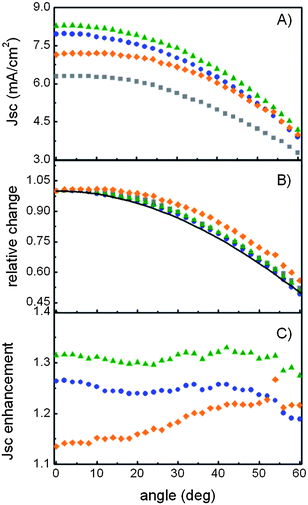 | ||
| Fig. 4 (A) JSC, (B) normalized JSC and cosine curve (solid line), as a function of the angle for a reference DSC (grey squares), DSC-B (blue circles), DSC-G (green triangles) and DSC-R (orange rhombi) and (C) JSC enhancement for the different PC-DSCs with the same color code. | ||
This is the origin of the well-known performance “cosine losses” that occur for solar cells operating at a tilted angle.
However, the drop of JSC observed experimentally will not be exactly fitted by eqn (4) (black solid line in Fig. 4B), as the light path within the electrode is also larger when it is tilted, which contributes to the increase of absorption. At the same time, for large angles, some transmittance losses occurring as a result of larger reflections at the glass substrate surface must also be taken into account. These effects are present in all devices herein presented. However, for the case of the PC-DSC, the different absorption enhancement attained as a consequence of the overlap between Bragg peak and the dye absorption band gives rise to clear deviations from the values obtained for the reference cell. This explains the effect observed for those PC-DSCs in which the overlap increases with the angle, as it is the case of DSC-R (orange rhombi in Fig. 4B). The origin of this compensating effect of the red light reflecting PCs can be clearly seen in Fig. 4C, in which the JSC enhancement for the different PC-DSCs at different illumination angles is plotted. In contrast, the photocurrent enhancement obtained for DSC-G is higher at any given angle and shows a steady angular response, while that of DSC-B decreases at larger angles as the Bragg reflection peak enters the absorption region of the TiO2 nanocrystals.
The angular dependence of parameters, such as fill factor (ff), open circuit voltage (VOC) and power conversion efficiency (η), is shown in Fig. 5. A minor photovoltage drop of approximately 1.5% is attained when the photonic structure is coupled to the cell. In all cases, theory predicts that VOC gradually decreases with increasing angles. VOC can be analyzed following eqn (5), derived from a diode model,25 in which the nanostructured TiO2 is treated like the n-material and the p-material is the redox electrolyte.
 | (5) |
 | (6) |
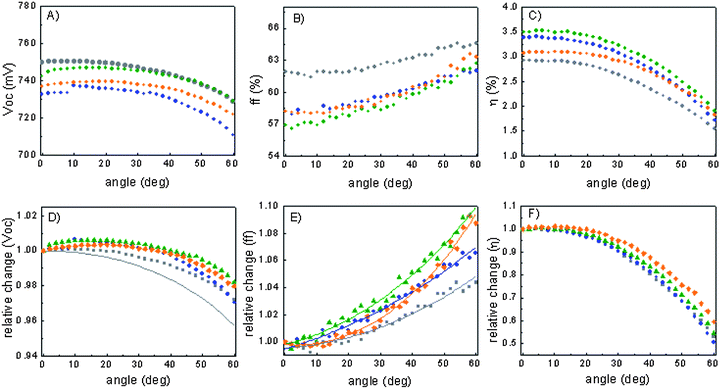 | ||
| Fig. 5 Angular dependence of (A) VOC, (B) ff, (C) η, (D) normalized VOC, (E) normalized ff, and (F) normalized η for a reference DSC (grey squares), DSC-B (blue circles), DSC-G (green triangles) and DSC-R (orange rhombi). Solid line in (D) is attained from eqn (5) considering T = 300 K and m = 1.5. Color lines in (E) are just a guide to the eye. | ||
Finally, the selective spectral enhancement of light harvesting is analyzed by acquisition of incident photon to collected electron (IPCE) efficiency measurements (Fig. 6). When a 1DPC is introduced in the cell, the IPCE efficiency increases for all angles measured, which is in good agreement with the I–V curve analysis. As expected, each PC-DSC performs better at the spectral range at which the photonic crystal reflects more efficiently. The IPCE enhancement, calculated from the ratio between the IPCEs of the PC based DSC and of the reference cell, is plotted in Fig. 6C for the particular case of DSC-R. Please notice that the maximum enhancement shifts towards shorter wavelengths as the tilt angle increases, as expected from eqn (1).
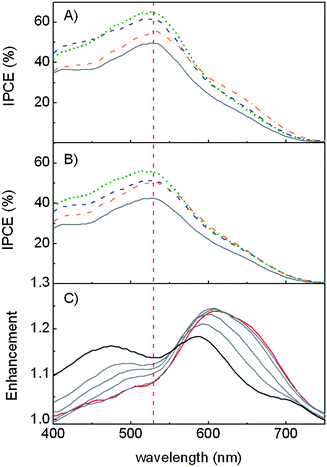 | ||
| Fig. 6 Incident photon to collected electron (IPCE) efficiency measured for a reference cell (grey solid line) and DSCs made of nc-TiO2 electrodes coupled to different highly porous 1DPCs, namely, DSC-B (blue dashed line), DSC-G (green dotted line) and DSC-R (orange dash-dotted line) at (A) 0° and (B) 50°. (C) IPCE enhancement at different tilt angles for the device DSC-R, from θ = 0° (red solid line) to θ = 50° (black solid line). The red dashed line indicates the maximum absorption of the N719 dye. | ||
Conclusion
In this paper, we have analysed the interplay between optical and photovoltaic response as the incident light angle varies for dye solar cells in which different photonic crystals are integrated. We demonstrate that the light harvesting enhancement effect that gives rise to higher photocurrent, and thus to higher power conversion efficiency, is maintained for all angles measured. We show that the characteristic cosine losses of these angular measurements can be partially compensated by the interplay of this effect with the angular variations of the Bragg peak position. The characterization of the angular performance of photonic crystal based DSCs herein presented opens a promising route to highly efficient but transparent modules and is of relevance to evaluate their potential for building integrated photovoltaics.Acknowledgements
We thank the Spanish Ministry of Economy and Competitiveness for funding under grant MAT2011-23593 and CONSOLIDER HOPE CSD2007-00007, and Junta de Andalucía for grants FQM3579 and FQM5247. MCLL thanks Junta de Andalucía for funding of her contract. HM thanks the European Research Council for funding under project POLIGHT within the Starting Grant program.Notes and references
- B. O'Regan and M. Grätzel, Nature, 1991, 353, 737 CrossRef CAS.
- M. K. Nazeeruddin, A. Kay, I. Rodicio, R. Humphry-Baker, E. Müller, P. Liska, N. Vlachopoulos and M. Grätzel, J. Am. Chem. Soc., 1993, 115, 6382 CrossRef CAS.
- A. Yella, H. Lee, H. N. Tsao, C. Yi, A. K. Chandiran, M. K. Nazeeruddin, E. Wei-Guang Diau, C. Yeh, S. M. Zakeeruddin and M. Grätzel, Science, 2011, 334, 4 CrossRef.
- C. Y. Chen, M. K. Wang, J. Y. Li, N. Pootrakulchote, L. Alibabaei, C. H. Ngoc-Le, J. D. Decoppet, J. H. Tsai, C. Grätzel, C. G. Wu, S. M. Zakeeruddin and M. Grätzel, ACS Nano, 2009, 3, 3103 CrossRef CAS.
- F. Gao, Y. Wang, D. Shi, J. Zhang, M. Wang, X. Jing, R. Humphry-Baker, P. Wang, S. M. Zakeeruddin and M. Grätzel, J. Am. Chem. Soc., 2008, 130, 10720 CrossRef CAS.
- Y. Chiba, A. Islam, Y. Watanabe, R. Komiya, N. Koide and L. Han, Jpn. J. Appl. Phys., 2006, 45, 25 CrossRef.
- A. Usami, Chem. Phys. Lett., 1997, 277, 105 CrossRef CAS.
- Y. Tachibana, K. Hara, K. Sayama and H. Arakawa, Chem. Mater., 2002, 14, 2527 CrossRef CAS.
- F. E. Gálvez, E. Kemppainen, H. Míguez and J. Halme, J. Phys. Chem., 2012, 116, 11426 Search PubMed.
- L. Dominici, L. Vesce, D. Colonna, F. Michelotti, T. M. Brown, A. Reale and A. Di Carlo, Appl. Phys. Lett., 2010, 96, 103302 CrossRef.
- D. D'Ercole, L. Dominici, T. M. Brown, F. Michelotti, A. Reale and A. Di Carlo, Appl. Phys. Lett., 2011, 99, 213301 CrossRef.
- L. I. Halaoui, N. M. Abrams and T. E. Mallouk, J. Phys. Chem. B, 2005, 109, 6334 CrossRef CAS.
- S. Colodrero, A. Mihi, L. Häggman, M. Ocaña, G. Boschloo, A. Hagfeldt and H. Míguez, Adv. Mater., 2009, 21, 764 CrossRef CAS.
- S. Guldin, S. Hüttner, M. Kolle, M. E. Welland, P. Müller-Buschbaum, R. H. Friend, U. Steiner and N. Tétreault, Nano Lett., 2010, 10, 2303 CrossRef CAS.
- C. T. Yip, H. Huang, L. Zhou, K. Xie, Y. Wang, T. Fenq, J. Li and W. Y. Tam, Adv. Mater., 2011, 23, 5624 CrossRef CAS.
- S. Colodrero, A. Forneli, C. López-López, L. Pellejà, H. Míguez and E. Palomares, Adv. Funct. Mater., 2012, 22, 1303 CrossRef CAS.
- D. Colonna, S. Colodrero, H. Lindström, A. Di Carlo and H. Míguez, Energy Environ. Sci., 2012, 5, 8238 CAS.
- I. K. Ding, J. Zhu, W. Cai, S. J. Moon, N. Cai, P. Wang, S. M. Zakeeruddin, M. Grätzel, M. L. Brongersma, Y. Cui and M. D. McGehee, Adv. Energy Mater., 2011, 1, 52 CrossRef CAS.
- M. D. Brown, T. Suteewong, R. S. S. Kumar, V. D'Innocenzo, A. Petrozza, M. M. Lee, U. Wiesner and H. J. Snaith, Nano Lett., 2011, 11, 438 CrossRef CAS.
- J. Qi, X. Dang, P. T. Hammond and A. M. Belcher, ACS Nano, 2011, 5, 7108 CrossRef CAS.
- S. D. Burnside, V. Shklover, C. Barbe, P. Comte, F. Arendse, K. Brooks and M. Grätzel, Chem. Mater., 1998, 10, 2419 CrossRef CAS.
- C. López-López, S. Colodrero, S. R. Raga, H. Lindström, F. Fabregat-Santiago, J. Bisquert and H. Míguez, J. Mater. Chem., 2012, 22, 1751 RSC.
- H. J. Snaith, Energy Environ. Sci., 2012, 5, 6513 Search PubMed.
- Data provided by J. Halme and obtained from optical transmission measurements of transparent films. Please see J. Halme, P. Vahermaa, K. Miettunen and P. Lund, Adv. Mater., 2010, 22, E210–E234 CrossRef CAS.
- F. Fabregat-Santiago, G. García-Belmonte, I. Mora-Seró and J. Bisquert, Phys. Chem. Chem. Phys., 2011, 13, 9083 RSC.
- J. L. Balenzategui and F. Chenlo, Sol. Energy Mater. Sol. Cells, 2005, 86, 53 CrossRef CAS.
- B. C. O'Regan and J. R. Durrant, Acc. Chem. Res., 2009, 42, 1799 CrossRef CAS.
Footnote |
| † Electronic supplementary information (ESI) available. See DOI: 10.1039/c3ee23609a |
| This journal is © The Royal Society of Chemistry 2013 |
