 Open Access Article
 This Open Access Article is licensed under a
 Creative Commons Attribution 3.0 Unported Licence
Copper(II) complex of methionine conjugated bis-pyrazole based ligand promotes dual pathway for DNA cleavage†
Sudipta Bhattacharyya‡a, Amrita Sarkar‡a, Suman Kr Deya, Gregor P. Joseb, Arindam Mukherjee*a and Tapas K. Senguptab
aDepartment of Chemical Sciences, Indian Institute of Science Education & Research Kolkata, Mohanpur Campus, P.O. BCKV Main Campus, Nadia, 741252, India. E-mail: a.mukherjee@iiserkol.ac.in; Fax: (+91)033-25873118; Tel: (+91)033-25873121
bDepartment of Biological Sciences, Indian Institute of Science Education & Research Kolkata, Mohanpur Campus, P.O. BCKV Main Campus, Nadia, 741252, India
First published on 8th July 2013
Abstract
Three CuII complexes of bis-pyrazole based ligands have been synthesized and structurally characterized by X-ray crystallography. One of the ligand (L2) contains a methionine ester conjugated to a bis-pyrazole carboxylate through an amide linkage. The binding constant for complexes 1–3 with CT DNA are of the order of 104 M−1. The crystal structure suggests that the axial Cu–O bonds (ca. 2.31(4) Å) are relatively labile and hence during the redox cycle with ascorbic acid and oxygen one or both the axial Cu–O bonds might open to promote copper oxygen reaction and generate ROS. The chemical nuclease activity of complexes 1–3 in dark, show complete relaxation of supercoiled DNA at 100 μM concentration in presence of ascorbic acid (H2A). The mechanistic investigation suggests that the complexes 1 and 2 show involvement of peroxo species whereas 3 shows involvement of both singlet oxygen and peroxo species in DNA cleavage. The singlet oxygen formation in dark is otherwise unfavourable but the presence of methionine as pendant arm in L2 might activate the generation of singlet oxygen from the metal generated peroxo species. The results of DNA cleavage studies suggest that methionine based copper(II) complexes can promote dual pathway for DNA cleavage. Probing the cytotoxic activity of these complexes on MCF-7, human breast cancer cell line shows that 3 is the most effective one with an IC50 of 70(2) μM.
Introduction
Ascorbic acid (H2A) and glutathione (GSH) are two main extracellular and intracellular physiological reductants which may promote the redox process of metal ions. The cellular concentration of GSH is 1–10 mM and the extracellular concentration of H2A is ca. 12–80 μM.1 Higher concentration (1–10 mM) of ascorbate is found in intracellular compartments.2,3 There are multiple reports which show that high dose of H2A may be beneficial in cancer treatment either as standalone or in combination with other anti-cancer agents.4 Ruthenium based anticancer agents like KP1019 is found to be more active with simultaneous high doses of H2A.5The chemical nuclease activity of CuII complexes is also known to be better in presence of external activators viz. H2A, hydrogen peroxide (H2O2) and may proceed through different mechanistic pathways.6 H2A in combination with CuII is known to generate reactive oxygen species (ROS) that can kill cells, especially those which have lost the efficiency of anti-oxidative stress defence (viz. cancer cells).7 The studies on mechanistic aspect of DNA cleavage by CuII complexes show involvement of various ROS (˙OH, O2˙−, 1O2, H2O2) depending on the ligand and the coordination number of the CuII ion.6,8–27 It is thought that when peroxide mediated DNA cleavage is observed the reactive species might be a copper oxo species and the copper oxygen bond length plays an important role in superoxide mediated cleavage.16–19 CuII complexes showing production of more than one ROS under same conditions may have potential for their capability of activating DNA damage through multiple pathways.20–22,24
A survey of the literature shows singlet oxygen based DNA cleavage in dark mediated by CuII complexes is rare.20–23 Planar heterocyclic ligand based CuII complexes having methionine have shown photo-toxicity against SC DNA and various cancer cell lines mediated through generation of singlet oxygen or hydroxyl radical (Table S1†).15,27–31 In addition CuII methionine complexes can cleave DNA in dark selectively through hydroxyl radical27 or singlet oxygen23 (Table S1†). Generation of multiple ROS in a methionine based complex is scarce, the only known example is a VIV complex which shows generation of ˙OH and 1O2 under same conditions in presence of light (Table S1†).29 In addition studies suggest that presence of methionine has a positive effect in treating liver diseases32,33 which is of importance in designing anti-cancer agents since they are known to cause liver stress.34–38
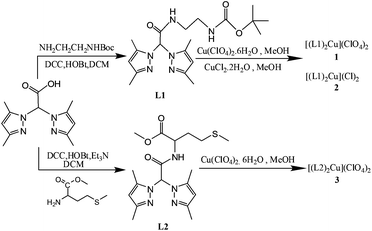
In our quest to study the effect of methionine when conjugated in a CuII complex herein we present the syntheses, structure, DNA cleavage and cytotoxicity studies of three CuII complexes of bispyrazolyl ligands (Scheme 1) to show that presence of methionine in copper complexes may also lead to activation of a dual pathway promoting peroxide and singlet oxygen based DNA cleavage in dark leading to better cytotoxicity. In order to probe the effect of methionine we have conjugated methionine as a pendant moiety selectively in one of the ligands (L2) and probed the relaxation of SC DNA using the CuII complexes [Cu(L1)2](ClO4)2 (1), [Cu(L1)2](Cl)2 (2) and [Cu(L2)2](ClO4)2 (3). The structures of the complexes have been solved using single crystal X-ray crystallography.
 | ||
| Scheme 1 General scheme for the synthesis of ligand L1 and L2 and metal complexes 1–3. | ||
Experimental
Materials and physical measurements
All chemicals and solvents were purchased from commercial sources. Solvents were distilled and dried before use.39N,N′-Dicyclohexylcarbodiimide (DCC), 1-hydroxybenzotriazole (HOBt), ethidium bromide (EtBr), agarose (molecular biology grade) were purchased from SRL (India). Supercoiled pUC 19 DNA was purchased from Bangalore-Genei (India). Calf Thymus (CT) DNA and cisplatin was purchased from Sigma-Aldrich. All the solvents used for spectroscopy and lipophilicity measurements are of spectroscopy grade, purchased from Merck. The column chromatographic separations were performed using silica gel 60–120 mesh size (Merck-India). Melting point for the compounds were measured in triplicate with one end sealed capillaries using SECOR India melting point apparatus and the uncorrected values are reported. UV-Visible measurements were done using Varian Cary 300 Bio and Perkin Elmer lambda 35 spectrophotometer. FT-IR spectra were recorded using Perkin-Elmer SPECTRUM RX I spectrometer in KBr pellets. 1H & proton decoupled 13C NMR spectra were measured using either JEOL ECS 400 MHz or Bruker Avance III 500 MHz spectrometer at room temperature. The chemical shifts are reported in parts per million (ppm). Elemental analyses were performed on a Perkin-Elmer 2400 series II CHNS/O series. Electro-spray ionization mass spectra were recorded using micromass Q-Tof micro™ (Waters) by +ve mode electrospray ionization. The synthetic yields reported are of isolated analytically pure compounds. The ligands and complexes synthesized were dried in vacuum and stored in desiccator.Caution! Perchlorate salts are explosive and corrosive so special care should be taken while handling those compounds.
Syntheses
![[thin space (1/6-em)]](https://www.rsc.org/images/entities/char_2009.gif) :3) mixture to give compound L1 as a white microcrystalline mass. Yield: 6.89 g (73%). Mp: 138 °C. Anal. Calc. for C19H30N6O3: C, 58.44; H, 7.74; N, 21.52%. Found: C, 58.39; H, 7.78; N, 21.49%. UV-vis λmax/nm (ε/dm3 mol−1 cm−1) in CH3OH: 227 (9200), 280 (23). IR (KBr) (νmax/cm−1) 3337s, 3060w, 2965s, 2980s, 2950s, 2930s; 1716w, 1688s, 1676s, 1562s, 1537s, 1444m, 1417s, 1370s, 1337s, 1287s, 1273s, 1254s, 1177s, 1135w, 1030s, 974w, 985w, 939w, 842m, 820w, 728w, 710w, 670w, 483w. 1H NMR (CDCl3, 500 MHz) δ 1.42 (s, 9H, 3CH3 of BOC), 2.21 (s, 6H, CH3), 2.25 (s, 6H, CH3), 3.37 (t, J = 5.0 Hz, –NHCH2), 3.40 (t, J = 6.0 Hz, NHCH2CH2), 5.84 (s, 2H, Hpz), 6.58 (s, 1H, CH), 7.75 (s, 1H, CONH). 13C NMR (CDCl3 125 MHz): δ 11.06 (CH3), 13.64 (CH3), 28.37 (t-CH3), 39.41 (CH2), 40.13 (CH2), 70.72 (CH), 79.12 (t-C), 107.12 (CH), 140.67 (Cpz), 149.68 (Cpz), 156.26 (CO), 164.95 (CO). ESI-MS (CH3OH), m/z (calc.): 413.22 (413.23) [M + Na]+.:3) mixture to give the ligand L2 as white solid. Yield: 0.50 g (63%). Mp: 86 °C. Anal. Calc. for C18H27N5O3S: C, 54.94; H, 6.92; N, 17.80; S, 8.15%. Found C, 54.85; H, 6.95; N, 17.72; S, 8.10%. UV-vis λmax/nm (ε/dm3 mol−1 cm−1) in CH3CN: 194 (17700), 223 (10020), 318 (30). IR (KBr) (νmax/cm−1) 3303s, 3075w, 2992w, 2946s, 2925s, 2375w, 1736s, 1702s, 1628w, 1553s, 1438s, 1389m, 1306w, 1279m, 1248m, 1164m, 1115w, 1013s, 974m, 887m, 784s, 642m, 622m, 532m, 418m. 1H NMR (CDCl3, 400 MHz) δ 2.06 (s, 3H, SCH3), 2.18 (s, 3H, CH3), 2.19 (s, 3H, CH3), 2.29 (s, 3H, CH3), 2.33 (s, 3H, CH3), 2.62 (t, J = 7.36 Hz, 2H, CH2SCH3), 3.45 (s, 2H, CH2), 3.73 (s, 3H, CH3), 4.76 (m, 1H, CH2COOCH3), 5.85 (d, J = 4.28 Hz, 2H, CHpz), 6.70 (s, 1H, CH), 8.26 (d, J = 7.96 Hz, 1H, NH). 13C NMR (CDCl3 125 MHz) δ 11.16 (CH3) 11.22 (CH3), 15.30 (SCH3), 29.65 (CH2CH2SCH3), 31.32 (CH2CH2SCH3), 52.04 (NHCH2), 71.13 (OCH3), 52.42 (CHNN), 107.15 (Ar-C), 140.80 (Ar-C), 141.56 (Ar-C), 149.14 (Ar-C), 149.56 (Ar-C), 164.20 (COamide), 171.515 (COester). ESI-MS (CH3OH), m/z (calc.): 394.02 (394.19) [M + H]+.100), 273 (780), 322 (740), 631 (8). IR (KBr) (νmax/cm−1) 3644s, 3487br, 3417m, 3301m, 3104s, 3009w, 2974s, 2934br, 2043w, 1696s, 1675s, 1632w; 1564s, 1513m, 1463m, 1445m, 1422w, 1394m, 1348w, 1311m, 1272m, 1257m, 1242m, 1166m, 1117s, 1052s, 955w, 993m, 929w, 876w, 830w, 773w, 756w, 651w, 624w, 488w. ESI-MS (CH3CN), m/z (calc.): 842.46 (842.40) [M − H]+, 421.68 (421.70) [M]2+.300), 273 (860), 317 (800), 645 (7). IR (KBr) (νmax/cm−1) 3562s, 3442s, 3405m, 3280m, 3180w, 3135w, 3071m, 2980m, 2933m, 2848w, 2799m, 2059w, 1697s, 1673s, 1584m, 1561m, 1516m, 1464m, 1420m, 1400w, 1362m, 1353m, 1313m, 1275m, 1247m, 1163m, 1148m, 1117s, 1098m, 1052w, 994w, 973w, 957w, 777w, 755w, 636w, 487m. ESI-MS (CH3OH) m/z (calc.): 842.41 (842.40) [M − H]+, 421.73 (421.70) [M − H]2+.000), 223 (36550), 325 (715), 624 (15). IR (KBr) (νmax/cm−1): 3644s, 3487br, 3417m, 3301m, 2043w, 1696s, 1675s, 1632w; 1564s, 1513m, 1463m, 1445m, 1422w, 1394m, 1348m. ESI-MS (CH3CN), m/z (calc.): 424.15 (424.14) [M]2+.
:3) mixture to give compound L1 as a white microcrystalline mass. Yield: 6.89 g (73%). Mp: 138 °C. Anal. Calc. for C19H30N6O3: C, 58.44; H, 7.74; N, 21.52%. Found: C, 58.39; H, 7.78; N, 21.49%. UV-vis λmax/nm (ε/dm3 mol−1 cm−1) in CH3OH: 227 (9200), 280 (23). IR (KBr) (νmax/cm−1) 3337s, 3060w, 2965s, 2980s, 2950s, 2930s; 1716w, 1688s, 1676s, 1562s, 1537s, 1444m, 1417s, 1370s, 1337s, 1287s, 1273s, 1254s, 1177s, 1135w, 1030s, 974w, 985w, 939w, 842m, 820w, 728w, 710w, 670w, 483w. 1H NMR (CDCl3, 500 MHz) δ 1.42 (s, 9H, 3CH3 of BOC), 2.21 (s, 6H, CH3), 2.25 (s, 6H, CH3), 3.37 (t, J = 5.0 Hz, –NHCH2), 3.40 (t, J = 6.0 Hz, NHCH2CH2), 5.84 (s, 2H, Hpz), 6.58 (s, 1H, CH), 7.75 (s, 1H, CONH). 13C NMR (CDCl3 125 MHz): δ 11.06 (CH3), 13.64 (CH3), 28.37 (t-CH3), 39.41 (CH2), 40.13 (CH2), 70.72 (CH), 79.12 (t-C), 107.12 (CH), 140.67 (Cpz), 149.68 (Cpz), 156.26 (CO), 164.95 (CO). ESI-MS (CH3OH), m/z (calc.): 413.22 (413.23) [M + Na]+.:3) mixture to give the ligand L2 as white solid. Yield: 0.50 g (63%). Mp: 86 °C. Anal. Calc. for C18H27N5O3S: C, 54.94; H, 6.92; N, 17.80; S, 8.15%. Found C, 54.85; H, 6.95; N, 17.72; S, 8.10%. UV-vis λmax/nm (ε/dm3 mol−1 cm−1) in CH3CN: 194 (17700), 223 (10020), 318 (30). IR (KBr) (νmax/cm−1) 3303s, 3075w, 2992w, 2946s, 2925s, 2375w, 1736s, 1702s, 1628w, 1553s, 1438s, 1389m, 1306w, 1279m, 1248m, 1164m, 1115w, 1013s, 974m, 887m, 784s, 642m, 622m, 532m, 418m. 1H NMR (CDCl3, 400 MHz) δ 2.06 (s, 3H, SCH3), 2.18 (s, 3H, CH3), 2.19 (s, 3H, CH3), 2.29 (s, 3H, CH3), 2.33 (s, 3H, CH3), 2.62 (t, J = 7.36 Hz, 2H, CH2SCH3), 3.45 (s, 2H, CH2), 3.73 (s, 3H, CH3), 4.76 (m, 1H, CH2COOCH3), 5.85 (d, J = 4.28 Hz, 2H, CHpz), 6.70 (s, 1H, CH), 8.26 (d, J = 7.96 Hz, 1H, NH). 13C NMR (CDCl3 125 MHz) δ 11.16 (CH3) 11.22 (CH3), 15.30 (SCH3), 29.65 (CH2CH2SCH3), 31.32 (CH2CH2SCH3), 52.04 (NHCH2), 71.13 (OCH3), 52.42 (CHNN), 107.15 (Ar-C), 140.80 (Ar-C), 141.56 (Ar-C), 149.14 (Ar-C), 149.56 (Ar-C), 164.20 (COamide), 171.515 (COester). ESI-MS (CH3OH), m/z (calc.): 394.02 (394.19) [M + H]+.100), 273 (780), 322 (740), 631 (8). IR (KBr) (νmax/cm−1) 3644s, 3487br, 3417m, 3301m, 3104s, 3009w, 2974s, 2934br, 2043w, 1696s, 1675s, 1632w; 1564s, 1513m, 1463m, 1445m, 1422w, 1394m, 1348w, 1311m, 1272m, 1257m, 1242m, 1166m, 1117s, 1052s, 955w, 993m, 929w, 876w, 830w, 773w, 756w, 651w, 624w, 488w. ESI-MS (CH3CN), m/z (calc.): 842.46 (842.40) [M − H]+, 421.68 (421.70) [M]2+.300), 273 (860), 317 (800), 645 (7). IR (KBr) (νmax/cm−1) 3562s, 3442s, 3405m, 3280m, 3180w, 3135w, 3071m, 2980m, 2933m, 2848w, 2799m, 2059w, 1697s, 1673s, 1584m, 1561m, 1516m, 1464m, 1420m, 1400w, 1362m, 1353m, 1313m, 1275m, 1247m, 1163m, 1148m, 1117s, 1098m, 1052w, 994w, 973w, 957w, 777w, 755w, 636w, 487m. ESI-MS (CH3OH) m/z (calc.): 842.41 (842.40) [M − H]+, 421.73 (421.70) [M − H]2+.000), 223 (36550), 325 (715), 624 (15). IR (KBr) (νmax/cm−1): 3644s, 3487br, 3417m, 3301m, 2043w, 1696s, 1675s, 1632w; 1564s, 1513m, 1463m, 1445m, 1422w, 1394m, 1348m. ESI-MS (CH3CN), m/z (calc.): 424.15 (424.14) [M]2+.X-ray crystal structure determination
Good quality single crystals suitable for X-ray diffraction were obtained from the slow evaporation of acetonitrile solution of 1 and 2. Single crystals of 3 were obtained by layering a dichloromethane solution with hexane. The single crystals of 1–3 were mounted using loops on the goniometer head of a Bruker Kappa Apex II CCD Duo diffractometer with graphite monochromated Mo-Kα radiation (0.71073 Å) and data collected at a temperature of 100 K. An empirical multi-scan absorption correction was performed using SADABS.43 The structures were solved by direct methods and all non-hydrogen atoms were refined anisotropically by full matrix least-squares on F2. The hydrogen atoms were calculated and fixed using SHELXL-97 after hybridization of all non hydrogen atoms.44 Few residual electron densities which appeared to be disordered lattice solvent molecules could not be modeled properly and were showing high motion during refinements hence we have used SQUEEZE provision in PLATON which lead to a fully converged well refined structure.45 The crystallographic data for the structures have been deposited at the Cambridge Crystallographic Data Centre as supplementary publication CCDC 916433 (1), 916434 (2) and 916435 (3).†Electrochemistry
Electrochemical studies were carried out with a Princeton Applied Research 263A potentiostat and galvanostat using a platinum (Pt) disc working, a platinum wire counter and a non-aqueous Ag/Ag+ reference electrode (0.55 V w.r.t. NHE, quantified using the ferrocene Fe2+/Fe3+ couple). The voltammograms were recorded using 0.1 M TBAP as supporting electrolyte in DMF solvent. The copper complexes 1–3 and their corresponding free ligands were used in 1 mM concentration during measurements. All the experimental data discussed were done at a scan rate of 50 mV s−1.DNA interaction studies
:1) media (v/v). The same medium was also used for preparation of stock solution of complexes. Spectroscopic titrations were carried out at room temperature. The concentration of the complexes 1–3 for the binding experiments was fixed to 4 × 10⁻⁴ M. The change in the absorbance was monitored with subsequent addition of an aliquot of 6 μL (concentration of 4 × 10⁻³ M) CT DNA in the sample and reference cuvette. The spectra were recorded after equilibration of the mixture for 10 min after each addition. The titration was continued until there was no significant change in absorbance for at least five successive additions.:1 ratio (DNA:complex) in buffer (50 mM Tris–HCl/50 mM NaCl, pH 7.4)–DMF mixture of 9:1 (v/v). The samples were heated from 30–90 °C at a rate of 1 °C min−1 with a hold time of 30 s between each increment and the change in absorption at 260 nm was monitored. The melting temperatures (Tm) for the CT DNA alone or upon binding with complexes were determined as when half of the ds DNA become ss DNA (Fig. 5).:1 v/v ratio of 50 mM Tris–HCl buffer and DMF having 50 mM NaCl and a pH of 7.4. Photocleavage experiments were carried out at 365 nm using a 4 W UV light (Spectroline®). The samples were irradiated for 30 min followed by an 1 h incubation in dark at 37 °C. After completion of incubation the samples were ice cooled for 15 min and a bromophenol blue based loading dye (3 μL) was added to the samples. The samples were then loaded on a 1% (w/v) agarose gel containing 1.0 μg mL−1 EtBr in 1× TAE (Tris–acetic acid–EDTA) buffer. Electrophoresis was performed at 50 V for 4 h in 1× TAE buffer. The bands were visualised using gel documentation system (Bio-Rad) and quantifications were done using Image Lab v4.0.1 software. In all the cases the background fluorescence was subtracted. The emission intensities of the SC plasmid bands were corrected by a factor of 1.350,51 since the ability of EtBr to intercalate into supercoiled (SC) DNA is less compared to the nicked-circular (NC) form. The time dependent DNA cleavage studies for 1–3 (100 μM) were done same as above except that the samples were incubated for variable time (0–60 min) in presence of 5 molar equivalent of H2A and reaction mixture was quenched by addition of loading dye followed by keeping at −30 °C.Lipophilicity measurement
Partition coefficient of the complexes in octanol–water system was determined using standard shake-flask method.52 Octanol and water (equal volume) were pre-equilibrated overnight before the experiment.53 After equilibration the solid samples were added to the mixture of solvents and shaken on a dancing shaker overnight at room temperature. On the next day the tubes were centrifuged and left undisturbed for an hour. Aliquots of the aqueous and octanol layers were pipetted out separately and the absorbance measured using UV-vis spectroscopy. Concentration of the substances in each layer was calculated using the respective molar extinction coefficients of 1–3.Cytotoxicity assay
Human breast adenocarcinoma cell line (MCF-7) was maintained in the logarithmic phase at 37 °C in a 5% carbon dioxide atmosphere using a culture media containing DMEM, 10% foetal bovine serum (GIBCO), antibiotics (100 units mL−1 penicillin and 100 mg mL−1 streptomycin).The cytotoxic effect of complexes 1–3 on MCF-7 cells was evaluated by means of MTT (tetrazolium salt reduction) assay.54 Briefly, 6 × 10³ cells per well, were seeded in 96-well plates in growth medium (200 μL) and then incubated at 37 °C in a 5% carbon dioxide atmosphere. After 48 h, the medium was removed and replaced with a fresh one and compounds to be studied were added at appropriate concentrations. Triplicates for each concentration were used in the wells. The compounds to be added were solubilised in media or PBS containing DMSO (when needed) such that the concentration of DMSO in well should not exceed 0.2%. Cisplatin was dissolved in DMSO just before the experiment and a calculated amount of drug solution was added to the growth medium containing cells such that the final DMSO concentration in the wells were no more than 0.2%. After 48 h the media containing compound was removed and fresh media was added to each well and successively treated with 20 μL of a 2 mg mL−1 MTT in saline solution, followed by 3 h of incubation at 37 °C in 5% carbon dioxide atmosphere. After 3 h media was removed and 100 μL of DMSO (molecular biology grade) added to each well. The inhibition of cell growth induced by the tested complexes was detected by measuring the absorbance of each well at 515 nm55,56 using a BIOTEK ELx800 plate reader. All experiments had the respective controls and standards as needed. IC50 values represent the drug concentration that reduces the mean absorbance at 515 nm to 50% as compared to the untreated control wells.
Results
X-Ray data and crystal structures
The complexes 1–3 have been synthesized and structurally characterised by single crystal X-ray crystallography. The ligands L1 and L2 only differ in the attached pendant group. The pendant group in L1 is a BOC-protected ethylenediamine and in L2 it is a methyl ester of methionine. Crystallographic data and refinement parameters for the three complexes 1–3 are summarised in Table S2.† The selected bond distance and angles are summarised in Table 1. 1 and 2 are complexes of L1 and differ in terms of the anions (1 has perchlorate and 2 has chloride). Complex 1 crystallizes in monoclinic space group C2/c whereas the chloride anion bearing complex 2 crystallizes in triclinic space group P![[1 with combining macron]](https://www.rsc.org/images/entities/char_0031_0304.gif) (Fig. 1 & S1† respectively). Complex 3 having the pendant methionine bearing L2 as the ligand crystallizes in space group P1 (Fig. 2). The structural data show that in all the complexes the metal has N4O2 coordination. Bond valence sum (BVS) calculations57 show that the central metal atoms are dipositively charged (Table S3†). Complexes 1–3 show distorted octahedral coordination at the CuII centers. All the complexes are dipositively charged and have a N4O2 coordination where the N-donors, situated in the square plane are the pyrazole nitrogen and the axially co-ordinated oxygens belong to the carbonyl group of the amide in L1 and L2. The average Cu–N distance in 1–3 is 2.02(3) Å and the average Cu–O distance for the axial Cu–O bonds is ca. 2.31 (4) Å.
(Fig. 1 & S1† respectively). Complex 3 having the pendant methionine bearing L2 as the ligand crystallizes in space group P1 (Fig. 2). The structural data show that in all the complexes the metal has N4O2 coordination. Bond valence sum (BVS) calculations57 show that the central metal atoms are dipositively charged (Table S3†). Complexes 1–3 show distorted octahedral coordination at the CuII centers. All the complexes are dipositively charged and have a N4O2 coordination where the N-donors, situated in the square plane are the pyrazole nitrogen and the axially co-ordinated oxygens belong to the carbonyl group of the amide in L1 and L2. The average Cu–N distance in 1–3 is 2.02(3) Å and the average Cu–O distance for the axial Cu–O bonds is ca. 2.31 (4) Å.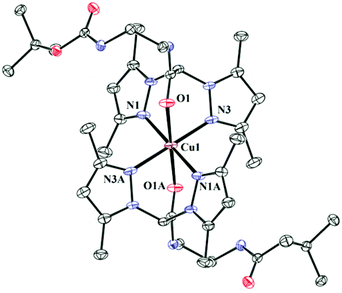 | ||
| Fig. 1 ORTEP diagram of 1. Thermal ellipsoids are drawn at 50% probability level. Hydrogen atoms, counter anions and solvents have been omitted for clarity. Symmetry transformations used to generate equivalent atoms A: −x + 2, −y + 1, −z + 1. | ||
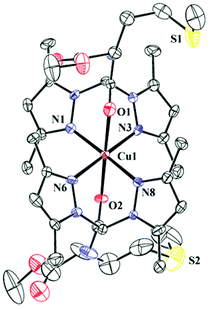 | ||
| Fig. 2 ORTEP diagram of 3. Thermal ellipsoids are drawn at 50% probability level. Hydrogen atoms, counter anions and solvents have been omitted for clarity. | ||
| 1 | 2 | |
|---|---|---|
| Cu(1)–N(1) | 2.03(1) | 2.04(1) |
| Cu(1)–N(3) | 2.02(3) | 2.03(2) |
| Cu(1)–O(1) | 2.32(2) | 2.29(1) |
| N(1)–Cu(1)–O(1) | 85.30(6) | 84.59(6) |
| N(3)–Cu(1)–O(1) | 84.11(6) | 85.41(6) |
| N(3)–Cu(1)–N(1) | 86.61(7) | 86.79(7) |
| N(3A)a–Cu(1)–N(1) | 93.39(7) | 93.21(7) |
| N(1)–Cu(1)–O(1A)a | 94.70(6) | 95.41(6) |
| N(3)–Cu(1)–O(1A)a | 95.96(9) | 94.59(6) |
| N(3A)a–Cu(1)–N(3) | 180.00(1) | 180.00(1) |
| O(1)1–Cu(1)–O(1A)a | 180.00(1) | 180.00(7) |
| 3 | |||
|---|---|---|---|
| a A = −x + 2, −y + 1, −z + 1 for 1 and −x, −y + 1, −z + 1 for 2. | |||
| Cu(1)–N(1) | 2.01(7) | N(3)–Cu(1)–N(6) | 179.3(2) |
| Cu(1)–N(3) | 2.03(5) | N(1)–Cu(1)–O(1) | 85.51(16) |
| Cu(1)–N(6) | 2.04(1) | N(3)–Cu(1)–O(1) | 82.92(14) |
| Cu(1)–N(8) | 2.01(1) | N(6)–Cu(1)–O(1) | 97.77(13) |
| Cu(1)–O(1) | 2.33(1) | N(8)–Cu(1)–O(1) | 96.43(15) |
| Cu(1)–O(2) | 2.34(0) | N(1)–Cu(1)–O(2) | 94.24(14) |
| N(1)–Cu(1)–N(3) | 87.10(2) | N(3)–Cu(1)–O(2) | 94.34(13) |
| N(1)–Cu(1)–N(6) | 93.8(2) | N(6)–Cu(1)–O(2) | 84.98(13) |
| N(1)–Cu(1)–N(8) | 178.6(2) | N(8)–Cu(1)–O(2) | 84.90(14) |
| N(8)–Cu(1)–N(3) | 93.8(2) | O(2)–Cu(1)–O(1) | 177.03(14) |
| N(8)–Cu(1)–N(6) | 85.3(2) | ||
Electrochemistry
Cyclic voltammetry (CV) experiments of L1, L2 and complexes 1–3 showed multiple reduction and oxidation peaks attributed to the ligands and the metal ions. The ligand L1 showed a redox couple in the cathodic scan with an E1/2 (ΔEp) value of −1.3 V (60 mV) (Fig. S2†). However the ratios of the peak height current (ipa/ipc) were poor. The redox event for L2 showed an E1/2 (ΔEp) of −1.27 V (140 mV) (Fig. S2†). Both the ligands also show an irreversible oxidation peak at ca. 0.39 V (0.37 V for L1 and 0.41 V for L2). In the complexes 1–3 a reduction peak appears in the range of −0.67 to −0.78 V with a corresponding oxidation peak in the range −0.49 to −0.58 V (Fig. 3). Complex 2 shows an additional redox couple with E1/2 = −0.097 V (ΔEp = 193 mV). Complex 3 show an irreversible redox couple with a reduction at −0.41 V and oxidation at −0.01 V. However, for all the redox event the oxidation peak height is much less than the reduction peak height. Complex 2 also shows an irreversible oxidation at 0.61 V which is not exhibited by 1 or 3.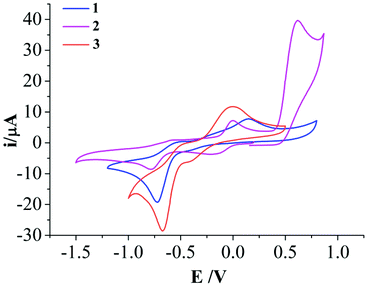 | ||
| Fig. 3 Cyclic voltammogram of complexes 1–3 at 50 mV s−1 scan rate in DMF medium using non-aqueous 0.01 M Ag/Ag+ reference electrode (0.55 V w.r.t. NHE) showing the irreversibility of the CuII/I redox couple. | ||
CT-DNA binding studies
Addition of DNA to the solution of 1–3 led to decrease in absorbance at around 247, 276 and 335 nm (Fig. S3†). The change in absorbance of the complex at 247 nm, upon formation of DNA–complex conjugate, with increasing concentration of DNA was used for the binding studies. The addition ratio (R) for the complexes was upto 1.5, where R = [DNA]/[Complex]. The change in the concentration of the metal complex and DNA due to dilution was duly corrected. The binding constants (Kb) for the complexes were determined from the spectroscopic titration data using the following equation.58| [DNA]/|(εa − εf)| = [DNA]/|(εb − εf)| + 1/Kb|(εb − εf)| |
![Plot of [DNA]/(εa − εf) vs. [DNA] for the determination of the apparent binding constant (Kb) of 1–3.](/image/article/2013/DT/c3dt51296g/c3dt51296g-f4.gif) | ||
| Fig. 4 Plot of [DNA]/(εa − εf) vs. [DNA] for the determination of the apparent binding constant (Kb) of 1–3. | ||
Thermal denaturation of CT-DNA
The thermal denaturation studies were performed with CT-DNA in the absence and presence of CuII complexes to determine the nature of binding. The hyperchromicity of CT DNA with increasing temperature in presence and absence of 1–3 was measured. The Tm value obtained for 1–3 is the temperature where half of the DNA unwinds. This transition point was calculated from mid-point of the melting curve (Fig. 5). There was an increase in the melting temperature (Tm) of 1 °C for 1 and 3 and 2 °C for 2 (Table 2).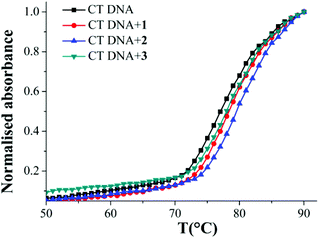 | ||
| Fig. 5 CT DNA melting curve for free DNA and in presence of complexes 1–3 showing that binding is stronger for 2. The legends on the top left show the colour scheme. | ||
Lipophilicity measurement
The partition coefficients to determine the lipophilicity of the ligands (L1 and L2) and complexes (1–3) were calculated using the well known formula of log P = Coct/Caq where Coct was the concentration of complex in organic layer and Caq was the concentration of complex in water found through UV-visible spectroscopy. The results displayed in Fig. 6 and Table S4† show that the lipophilicity or the log Po/w for the L2 is less than L1. The complexes 1–3 were probed for their lipophilicity and found that the chloride anion bearing complex 2 is the most hydrophilic among the three complexes and lipophilicity order is 1 > 3 > 2.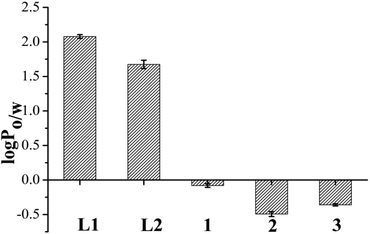 | ||
| Fig. 6 Lipophilicity of the ligands and complexes 1–3 represented by a bar diagram showing comparative log P values of L1, L2 and 1–3 in octanol–water system, where error bars in the graph represent the standard deviation in measurement. | ||
DNA cleavage
The three CuII complexes 1, 2 and 3 in absence of any redox agent do not show any significant cleavage even at 170 μM concentration (Fig. S4†). However, in presence of 700 μM H2O2 at a concentration of 170 μM ca. 40% of NC form was generated by 1 and 2 and ca. 72% by 3 (Fig. S4†). Incubation of 80–100 μM complexes 1–3 with pUC19 SC DNA for 1.5 h in presence of 5 molar equivalent H2A exhibited upto 100% relaxation of SC DNA to the NC form (Fig. 7).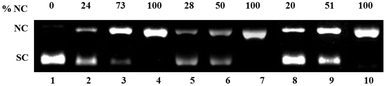 | ||
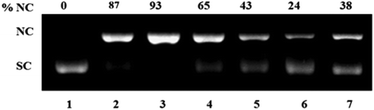
| Fig. 7 Oxidative DNA cleavage of pUC 19 DNA (300 ng) in presence of 5 eq. ascorbic acid (H2A) by various concentrations of complexes 1–3 in 50 mM Tris–HCl/NaCl buffer (pH = 7.4) after 1.5 h incubation at 37 °C. Lane 1, DNA control; lane 2–4, DNA + 1 (80, 90 and 100 μM respectively); lane 5–7, DNA + 2 (80, 90 and 100 μM respectively); lane 8–10, DNA + 3 (80, 90 and 100 μM) respectively. | ||
Complexes 1–3 were probed for time dependent oxidative cleavage activity.14,59 We found that there is a sudden increase in formation of NC DNA after around 20–30 min incubation period with all the complexes (Fig. 8, Fig. S5†) and after 30–60 min of incubation with 100 μM of 1–3, and 500 μM H2A as reducing agent, complete relaxation of the SC DNA is observed. The initial relaxation rate of complex 3 is faster as compared to 1 and 2.
![Time dependent conversion of pUC19 SC DNA to its NC form by complexes 1–3 in presence of [DNA] = 300 ng, [Complex] = 100 μM and [H2A] = 500 μM. A plot of ln (%SC DNA) vs. time for complex 1–3 showing a sudden decrease in the SC form beyond 20 min for 1.](/image/article/2013/DT/c3dt51296g/c3dt51296g-f8.gif) | ||
| Fig. 8 Time dependent conversion of pUC19 SC DNA to its NC form by complexes 1–3 in presence of [DNA] = 300 ng, [Complex] = 100 μM and [H2A] = 500 μM. A plot of ln (%SC DNA) vs. time for complex 1–3 showing a sudden decrease in the SC form beyond 20 min for 1. | ||
Next the ROS species involved in DNA damage was investigated using known ROS scavengers viz. DMSO, NaN3, histidine, catalase and TEMPO. The control experiment with H2A (500 μM) but no complex showed ca. 15% conversion to NC form suggesting that H2A may itself be involved in ROS generation. 100 μM of complex 1 showed around ca. 90% of the NC form along with some linearized form and this remained unchanged in presence of DMSO, NaN3 and histidine (Fig. 9). However, in presence of catalase and TEMPO the DNA cleavage activity of complex 1 and 2 decreased to 1/3 of its original value (Fig. 9 & S6† respectively). In case of complex 3 also DMSO did not decrease the DNA cleavage activity. However, the presence of singlet oxygen scavengers NaN3 and especially histidine markedly decrease the generation of NC form (Fig. 10). There was loss of activity in presence of catalase, the peroxide mediated DNA cleavage inhibitor.
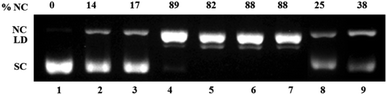 | ||
| Fig. 9 Mechanistic study for oxidative DNA cleavage of pUC 19 DNA (300 ng) in presence of 5 eq. ascorbic acid (H2A) by complex 1 (100 μM) in 50 mM Tris–HCl/NaCl buffer (pH = 7.4) after 1.5 h incubation at 37 °C using DMSO (1 eq.), NaN3 (1 eq.), histidine (1 eq.), catalase (10 U) and 4-carboxy TEMPO (1 eq.). Lane 1, DNA control; lane 2, DNA + DMSO; lane 3, DNA + NaN3; lane 4, DNA + 1; lane 5, DNA + 1 + DMSO; lane 6, DNA + 1 + NaN3; lane 7, DNA + 1 + histidine; lane 8, DNA + 1 + catalase; lane 9, DNA + 1 + 4-carboxy TEMPO. | ||
 | ||
| Fig. 10 Mechanistic study for oxidative DNA cleavage of pUC 19 DNA (300 ng) in presence of 5 eq. ascorbic acid (H2A) by complex 3 (100 μM) in 50 mM Tris–HCl/NaCl buffer (pH = 7.4) after 1.5 h incubation at 37 °C using DMSO (1 eq.), NaN3 (1 eq.), histidine (1 eq.), catalase (10 U) and 4-carboxy TEMPO (1 eq.). Lane 1, DNA control; lane 2, DNA + 3; lane 3, DNA + 3 + DMSO; lane 4, DNA + 3 + NaN3; lane 5, DNA + 3 + histidine; lane 6, DNA + 3 + catalase; lane 7, DNA + 3 + 4-carboxy TEMPO. | ||
To probe if singlet oxygen generation is enhanced in presence of light instead of a reducing agent, the complexes and DNA were exposed to a 4 W 365 nm UV light for 30 min followed by 1 h incubation in dark. However, even in presence of 170 μM of 1–3 only upto ca. 6% NC form was observed (Fig. S7†).
Cell cytotoxicity
MCF-7 cells were treated with the ligands L1, L2 and complexes 1–3 to probe the in vitro cytotoxicity. The well known compound cisplatin was used as a standard in each 96 well plate. The results obtained show that L1 and L2 has IC50 value above 250 μM. Between 1 and 2, 2 having the chloride counter anion is more effective (IC50 = 116(3) μM) than 1 (IC50 = 160(5) μM) bearing the perchlorate as counter anion. However, complex 3 is the most effective with an IC50 of 70(2) μM. The obtained data are plotted and fitted using GraphPad Prism® Ver 5.03 (Fig. S8†). IC50 values are summarised in Table 3.| IC50 (μM) ± S.D.a | |||||||
|---|---|---|---|---|---|---|---|
| L1 | L2 | 1 | 2 | 3 | Cisplatin | Carboplatinb | |
| a S.D. = standard deviation; IC50 values were calculated by variable slope model using Graph pad prism 5.0®. 6 × 10³ cells per well were treated for 48 h with increasing concentrations of tested compounds. Cytotoxicity was assessed by MTT test.b On drug exposure of 72 h (data taken from ref. 63). | |||||||
| MCF-7 | >250 | >250 | 160 ± 5 | 116 ± 3 | 70 ± 2 | 12 ± 2 | 62.19 |
Discussion
The ligands L1 and L2 show strong IR bands at 1676 and 1703 cm−1 respectively corresponding to νC![[double bond, length as m-dash]](https://www.rsc.org/images/entities/char_e001.gif) O of the amide. In addition L2 has a strong IR band at 1736 cm−1 corresponding to the νCO of the methyl ester of the conjugated methionine. L1 has a strong IR band at 1688 cm−1 corresponding to the νCO of the BOC conjugated amine. In complex 1–3 the νCO of the amide appears at 1675, 1673 and 1675 cm−1 respectively suggesting weak bonding of the –CO oxygen to the metal center. The ligands show a strong peak in the region of 1550–1562 cm−1 attributed to the νCN of the pyrazole ring. In all the three complexes the intensity of this band decreases compared to the ligand due to the nitrogen being bonded to the metal center. The little difference in the d–d band for complexes 1 (631 nm) and 3 (624 nm) shows that the coordination sphere should be very similar. Indeed the structural data show that all the complexes 1–3 have N4O2 donors and very similar geometry even in terms of the distorted Jahn–Teller axes (Table 1). The structural data for complexes 1–3 show that axial Cu–O bonds [ca. 2.31 (4) Å] are relatively longer. There appears to be a red shift for the d–d band of complex 2 since it appears at 641 nm although the coordination environment is similar. This might be due to the change in solvent from acetonitrile to methanol since 2 is not soluble in acetonitrile.
O of the amide. In addition L2 has a strong IR band at 1736 cm−1 corresponding to the νCO of the methyl ester of the conjugated methionine. L1 has a strong IR band at 1688 cm−1 corresponding to the νCO of the BOC conjugated amine. In complex 1–3 the νCO of the amide appears at 1675, 1673 and 1675 cm−1 respectively suggesting weak bonding of the –CO oxygen to the metal center. The ligands show a strong peak in the region of 1550–1562 cm−1 attributed to the νCN of the pyrazole ring. In all the three complexes the intensity of this band decreases compared to the ligand due to the nitrogen being bonded to the metal center. The little difference in the d–d band for complexes 1 (631 nm) and 3 (624 nm) shows that the coordination sphere should be very similar. Indeed the structural data show that all the complexes 1–3 have N4O2 donors and very similar geometry even in terms of the distorted Jahn–Teller axes (Table 1). The structural data for complexes 1–3 show that axial Cu–O bonds [ca. 2.31 (4) Å] are relatively longer. There appears to be a red shift for the d–d band of complex 2 since it appears at 641 nm although the coordination environment is similar. This might be due to the change in solvent from acetonitrile to methanol since 2 is not soluble in acetonitrile.The axial coordination made by the carbonyl oxygen atoms of the amide in bispyrazole based ligand is reported to be relatively labile in solution.60 Hence the longer Cu–O bonds may be susceptible to dissociation during the redox reaction in presence of H2A and O2 and promote the binding of oxygen to the CuII centre. However the change in coordination environment due to opening of such bonds may lead to instability and possible decomposition during such redox reactions. This becomes evident from the cyclic voltammetry data of the complexes 1–3. All the three complexes show that a chemical reaction is coupled with the redox processes. This may be because of an unfavourable geometry rendered by the ligand upon reduction by the electrochemical process. Complex 2 shows a redox event at E1/2 = −0.097 V (ΔEp = 193 mV) which may correspond to CuII/CuI couple and later another reduction at −0.78 V which might be due to decomposition of CuI to Cu0. 1 and 3 on the other hand shows a reduction with a maxima at ca. −0.4 V followed by a possible decomposition rendering to Cu0 at ca. −0.74 V for 1 and −0.67 for 2 respectively. The oxidation peak height is significantly shorter that the reduction peak height. The cyclic voltammetry studies suggest that the electrochemical reduction process is coupled with chemical events leading to decomposition and hence irreversibility. The irreversible oxidation peak at 0.62 V only exhibited by complex 2 may be attributed to the oxidation of the chloride anion.
The complexes 1–3 bind to DNA with binding constants (Kb) of the order of 104 M−1. The binding constant and the small changes in CT-DNA melting point (Table 2) upon interaction with the complexes signify non-intercalative binding mode and weak interaction. The ligands used are non-planar and hence the interaction observed may be more of electrostatic nature. However, the chemical redox process in presence of H2A and O2 lead to complete relaxation of the supercoiled form of pUC19 DNA at a concentration of 100 μM (Fig. 7).
In case of oxidative cleavage, where an external reducing agent is involved along with molecular oxygen, very few time dependent cleavage studies are performed to find out the rate constant since there are multiple dependence factors.14 However an estimate of the minimum incubation time needed can at least be derived from such studies. Hence, we probed the time dependent DNA cleavage of complexes 1–3 (Fig. 8) and found that they relax SC DNA to its NC form by around 30–60 min. However, the reaction did not appear to be first order with respect to the incubation time. It should be noted that the concentration of H2A used is five time as compared to the concentration of the complex. The use of a higher amount of H2A might be needed to get a better correlation of the time dependence with respect to a constant complex concentration, but higher concentration of H2A also leads to DNA cleavage by itself and hence using a higher concentration of H2A would be inappropriate for finding out the effect of the complex.
The relaxation of the SC DNA to the NC form by complexes 1–3 at 100 μM concentration is however, not unusual to observe in case of CuII complexes at such concentrations but the mechanistic studies proved to be interesting. Investigation regarding the ROS species involved in relaxation of SC DNA showed that for 1 and 2 hydroxyl radical and singlet oxygen are not involved as the ROS. Complex 3 showed a significant decrease in the chemical nuclease activity with NaN3 and especially with histidine which demonstrates that the presence of methionine pendant group involves singlet oxygen as one of the reactive species for DNA cleavage (Fig. 10).
Catalase and 4-carboxy TEMPO radical inhibited DNA cleavage significantly in 1–3 (Fig. 11). These results show that although for 1 and 2 the DNA cleavage is mediated by peroxide only but complex 3 exhibits both peroxide and singlet oxygen based relaxation of SC DNA to its nicked circular form. Complexes 1–3 have almost identical bond parameters for the metal co-ordination sphere (Table 1) and only differ in terms of ethylenediamine and 3 a methionine ester moiety.
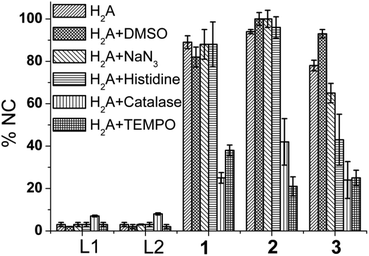 | ||
| Fig. 11 A typical bar diagram showing the formation of NC form of pUC19 by L1, L2 (100 μM), 1–3 (100 μM) in presence of H2A and the mechanistic studies with different ROS scavengers for complexes 1–3 (error bars represent standard deviation in data) showing peroxide as the possible ROS. | ||
The DNA cleavage activity of all the three complexes decreased to 1/3 of its original value (Fig. 11) in presence of catalase which suggests peroxide to be the most active species in DNA cleavage. In addition it should be noted here that although there is an additional pathway active in the methionine complex, the dose response on the DNA cleavage activity is the same in all the three complexes. The above result emphasizes that in case of complex 3 the presence of methionine may promote the otherwise kinetically inhibited reaction of generation of singlet oxygen (1O2) from peroxide, formed by the CuII in the complex upon reaction with oxygen in dark.
Complex 3 also shows higher activity in relaxing SC DNA in presence of H2O2 compared to 1 or 2 (Fig. S4†). The higher activity of H2O2 dependent DNA cleavage in 3 may be because the presence of methionine stabilizes better the Cu–ROS intermediate as compared to 1 and 2. In presence of H2O2 the relaxation activity of supercoiled pUC19 DNA follows the order 3 > 2 > 1 (Fig. S4†). Complex 3 shows ca. 72% cleavage at 170 μM concentration whereas complex 1 and 2 shows ca. 33 and 40% respectively.
A UV light mediated DNA cleavage was attempted since we found that complex 3 promotes DNA cleavage through singlet oxygen. We found that irradiation with a 4 W 365 nm UV lamp for 30 min followed by an incubation at 37 °C for 1 h in dark did not show any relaxation of SC-DNA in presence of upto 170 μM of 1–3 (Fig. S7†). The presence of 365 nm UV light in combination with the reducing agent H2A also did not show any improvement over the dark cytotoxicity for 1–3 (Fig. S7†). So the relaxation of supercoiled DNA is clearly mediated through a chemical pathway involving the reducing agent (H2A) rather than a photochemical pathway.
The complexes showed good correlation between their DNA cleavage and in vitro cellular cytotoxicity data. When tested on MCF-7 complex 3 was found to be the most cytotoxic one among the three complexes. We see that although complex 1 is the least hydrophilic (Fig. 6) and hence should be able to better penetrate the cell membrane and accumulate more in cells yet it is the least active one. We find that 2 having the more physiology relevant chloride ion is more active than 1 (Table 3) which might be due to better solubility of complex 2 as compared to 1. However, complex 3 is the most active one (IC50 ∼ 70 μM) although least lipophilic suggesting that lipophilicity is a good guideline but the cell might uptake complex 3 more through certain receptors due to the presence of methionine which is one of the essential amino acids and very much needed in cellular metabolism61,62 and its presence in 3 renders a dual pathway of DNA damage.
Conclusions
Complexes 1–3 show significant DNA cleavage activity at 100 μm concentration and the DNA cleavage in 1 and 2 is mediated through peroxide pathway whereas in 3 both peroxide and singlet oxygen based pathway is active. The DNA cleavage studies emphasize that in CuII complexes the presence of methionine as a pendant moiety in the ligand can help to generate additional ROS and induce DNA damage through multiple pathways. The results show that methionine based CuII complexes can generate singlet oxygen even in dark in presence of cellular reducing agents like H2A. The use of H2O2 as activator for 1–3 shows that the presence of methionine also facilitates generation of ROS from H2O2 by the CuII center leading to better relaxation of SC DNA to its NC form. Earlier it was shown that in dark CuII complexes bearing methionine as part of the ligand shows either hydroxyl radical or singlet oxygen based DNA cleavage activity.23,27 In this work we confirm that when methionine is present as part of the ligand in CuII complexes but does not take part in coordination then it can convert a part of the metal generated peroxide to singlet oxygen and activate a dual pathway for relaxing SC DNA, to its nicked circular form. The in vitro toxicity data of complex 3 in MCF-7 cancer cell line shows that it is not as toxic (IC50 ∼ 70 μM) as cisplatin (IC50 ∼ 12.5 μM) rather the toxicity is comparable to carboplatin (IC50 ∼ 62.5 μM)63 or certain gallium based drugs in clinic used to treat various resistant cancers.64 Improving the design of the methionine conjugated coordinating ligand to better stabilize the CuI/II state may enhance the anti-cancer activity of such complexes. Hence complex 3 warrants more investigation with this family of ligands keeping the methionine intact but changing the metal and donor sites.Acknowledgements
We sincerely thank DST for the funding (Vide Project no-SR/S1/IC-36/2010). We are also thankful to IISER Kolkata for the financial and infrastructural support including NMR and single crystal X-ray facilities. SB, SKD and GPJ thank CSIR-India for providing research fellowship. AS sincerely thanks IISER Kolkata for research fellowship.References
- O. Arrigoni and M. C. De Tullio, Biochim. Biophys. Acta, Gen. Subj., 2002, 1569, 1–9 CrossRef CAS.
- C. L. Linster and E. Van Schaftingen, FEBS J., 2007, 274, 1–22 CrossRef CAS.
- D. Zhou, H. Xiao, F. Meng, S. Zhou, J. Guo, X. Li, X. Jing and Y. Huang, Bioconjugate Chem., 2012, 23, 2335–2343 CrossRef CAS.
- J. Du, J. J. Cullen and G. R. Buettner, Biochim. Biophys. Acta, Rev. Cancer, 2012, 1826, 443–457 CrossRef CAS.
- C. Bartel, A. E. Egger, M. A. Jakupec, P. Heffeter, M. Galanski, W. Berger and B. K. Keppler, J. Biol. Inorg. Chem., 2011, 16, 1205–1215 CrossRef CAS.
- A. R. Chakravarty and M. Roy, Prog. Inorg. Chem., 2012, 57, 119–202 CAS.
- M. P. Cervantes-Cervantes, J. V. Calderon-Salinas, A. Albores and J. L. Munoz-Sanchez, Biol. Trace Elem. Res., 2005, 103, 229–248 CrossRef CAS.
- D.-D. Li, J.-L. Tian, W. Gu, X. Liu, H.-H. Zeng and S.-P. Yan, J. Inorg. Biochem., 2011, 105, 894–901 CrossRef CAS.
- A. Kellett, M. O'Connor, M. McCann, O. Howe, A. Casey, P. McCarron, K. Kavanagh, M. McNamara, S. Kennedy, D. D. May, P. S. Skell, D. O'Shea and M. Devereux, MedChemComm, 2011, 2, 579–584 RSC.
- T. K. Goswami, B. V. S. K. Chakravarthi, M. Roy, A. A. Karande and A. R. Chakravarty, Inorg. Chem., 2011, 50, 8452–8464 CrossRef CAS.
- A. K. Patra, T. Bhowmick, S. Roy, S. Ramakumar and A. R. Chakravarty, Inorg. Chem., 2009, 48, 2932–2943 CrossRef CAS.
- S. Anbu, M. Kandaswamy, P. Suthakaran, V. Murugan and B. Varghese, J. Inorg. Biochem., 2009, 103, 401–410 CrossRef CAS.
- P. U. Maheswari, M. van der Ster, S. Smulders, S. Barends, G. P. van Wezel, C. Massera, S. Roy, H. den Dulk, P. Gamez and J. Reedijk, Inorg. Chem., 2008, 47, 3719–3727 CrossRef CAS.
- Y. Jin and J. A. Cowan, J. Am. Chem. Soc., 2005, 127, 8408–8415 CrossRef CAS.
- S. Dhar, M. Nethaji and A. R. Chakravarty, Inorg. Chem., 2005, 44, 8876–8883 CrossRef CAS.
- S. Borah, M. S. Melvin, N. Lindquist and R. A. Manderville, J. Am. Chem. Soc., 1998, 120, 4557–4562 CrossRef CAS.
- M. Subramanian, U. Shadakshari and S. Chattopadhyay, Bioorg. Med. Chem., 2004, 12, 1231–1237 CrossRef CAS.
- N. Yamashita, M. Murata, S. Inoue, M. J. Burkitt, L. Milne and S. Kawanishi, Chem. Res. Toxicol., 1998, 11, 855–862 CrossRef CAS.
- A. K. Patra, T. Bhowmick, S. Ramakumar, M. Nethaji and A. R. Chakravarty, Dalton Trans., 2008, 6966–6976 RSC.
- B. Macias, M. V. Villa, B. Gomez, J. Borras, G. Alzuet, M. Gonzalez-Alvarez and A. Castineiras, J. Inorg. Biochem., 2007, 101, 444–451 CrossRef CAS.
- F. Arjmand, M. Muddassir and R. H. Khan, Eur. J. Med. Chem., 2010, 45, 3549–3557 CrossRef CAS.
- Y. Huang, Q.-S. Lu, J. Zhang, Z.-W. Zhang, Y. Zhang, S.-Y. Chen, K. Li, X.-Y. Tan, H.-H. Lin and X.-Q. Yu, Bioorg. Med. Chem., 2008, 16, 1103–1110 CrossRef CAS.
- C. Gao, X. Ma, J. Lu, Z. Wang, J. Tian and S. Yan, J. Coord. Chem., 2011, 64, 2157–2169 CrossRef CAS.
- H. Ahsan and S. M. Hadi, Cancer Lett., 1998, 124, 23–30 CrossRef CAS.
- K. Satoh, T. Kadofuku and H. Sakagami, Anticancer Res., 1997, 17, 2487–2490 CAS.
- H. Sakagami, K. Satoh, T. Kadofuku and M. Takeda, Anticancer Res., 1997, 17, 2565–2570 CAS.
- A. K. Patra, S. Dhar, M. Nethaji and A. R. Chakravarty, Dalton Trans., 2005, 896–902 RSC.
- A. K. Patra, S. Dhar, M. Nethaji and A. R. Chakravarty, Chem. Commun., 2003, 1562–1563 RSC.
- P. K. Sasmal, A. K. Patra, M. Nethaji and A. R. Chakravarty, Inorg. Chem., 2007, 46, 11112–11121 CrossRef CAS.
- T. K. Goswami, M. Roy, M. Nethaji and A. R. Chakravarty, Organometallics, 2009, 28, 1992–1994 CrossRef CAS.
- T. K. Goswami, S. Gadadhar, M. Roy, M. Nethaji, A. A. Karande and A. R. Chakravarty, Organometallics, 2012, 31, 3010–3021 CrossRef CAS.
- M. A. Pereira, W. Wang, P. M. Kramer and L. Tao, Toxicol. Sci., 2004, 77, 243–248 CrossRef CAS.
- J. M. Mato, M. L. Martinez-Chantar and S. C. Lu, Amino Acids in Hum. Nutr. Health, 2012, 173–188 CAS.
- P. D. King and M. C. Perry, Oncologist, 2001, 6, 162–176 CrossRef CAS.
- H. J. Zimmerman, Hepatotoxicity: The Adverse Effects of Drugs and Other Chemicals on the Liver, 1978 Search PubMed.
- H. J. Zimmerman and W. C. Maddrey, Hepatology, 1995, 22, 767–773 CrossRef CAS.
- A. T. Banks, H. J. Zimmerman, K. G. Ishak and J. G. Harter, Hepatology, 1995, 22, 820–827 CrossRef CAS.
- H. J. Zimmerman, Liver: Norm. Funct. Dis., 1980, 2, 687–737 CAS.
- D. D. Perrin and W. L. F. Armarego, Purification of Laboratory Chemicals, 3rd edn, 1988 Search PubMed.
- N. Burzlaff, I. Hegelmann and B. Weibert, J. Organomet. Chem., 2001, 626, 16–23 CrossRef CAS.
- C. D. Vo, D. Kuckling, H. J. P. Adler and M. Schonhoff, Colloid Polym. Sci., 2002, 280, 400–409 CAS.
- C. Dubuisson, Y. Fukumoto and L. S. Hegedus, J. Am. Chem. Soc., 1995, 117, 3697–3704 CrossRef CAS.
- G. M. Sheldrick, Z. Kristallogr., 2002, 217, 644–650 CrossRef CAS.
- G. M. Sheldrick, Int. Union Crystallogr., Crystallogr. Symp., 1991, 5, 145–157 CAS.
- P. Van der Sluis and A. L. Spek, Acta Crystallogr., Sect. A: Fundam. Crystallogr., 1990, 46, 194–201 CrossRef.
- M. E. Reichmann, C. A. Rice, C. A. Thomas and P. Doty, J. Am. Chem. Soc., 1954, 76, 3047–3053 CrossRef CAS.
- J. Marmur, J. Mol. Biol., 1961, 3, 208–218 CrossRef CAS.
- B. Macias, I. Garcia, M. V. Villa, J. Borras, M. Gonzalez-Alvarez and A. Castineiras, J. Inorg. Biochem., 2003, 96, 367–374 CrossRef CAS.
- J. Hong, Y. Jiao, J. Yan, W. He, Z. Guo, L. Zhu and J. Zhang, Inorg. Chim. Acta, 2010, 363, 793–798 CrossRef CAS.
- C. A. Detmer III, F. V. Pamatong and J. R. Bocarsly, Inorg. Chem., 1996, 35, 6292–6298 CrossRef.
- M. Gonzalez-Alvarez, G. Alzuet, J. Borras, B. Macias and A. Castineiras, Inorg. Chem., 2003, 42, 2992–2998 CrossRef CAS.
- C. Zhang, Y. Wang and F. Wang, Bull. Korean Chem. Soc., 2007, 28, 1183–1186 CrossRef CAS.
- J. Sangster and A. D. Pelton, J. Phys. Chem. Ref. Data, 1987, 16, 509–561 CrossRef CAS.
- T. Mosmann, J. Immunol. Methods, 1983, 65, 55–63 CrossRef CAS.
- B. L. Lokeshwar, E. Escatel and B. Zhu, Curr. Med. Chem., 2001, 8, 271–279 CrossRef CAS.
- M. C. Alley, D. A. Scudiero, A. Monks, M. L. Hursey, M. J. Czerwinski, D. L. Fine, B. J. Abbott, J. G. Mayo, R. H. Shoemaker and M. R. Boyd, Cancer Res., 1988, 48, 589–601 CAS.
- N. E. Brese and M. O'Keeffe, Acta Crystallogr., Sect. B: Struct. Sci., 1991, 47, 192–197 CrossRef.
- A. Wolfe, G. H. Shimer Jr. and T. Meehan, Biochemistry, 1987, 26, 6392–6396 CrossRef CAS.
- W. M. Tay, J. D. Epperson, G. F. Z. da Silva and L.-J. Ming, J. Am. Chem. Soc., 2010, 132, 5652–5661 CrossRef CAS.
- M. Giorgetti, S. Tonelli, A. Zanelli, G. Aquilanti, M. Pellei and C. Santini, Polyhedron, 2012, 48, 174–180 CrossRef CAS.
- F. Hirche, A. Schroeder, B. Knoth, G. I. Stangl and K. Eder, Br. J. Nutr., 2006, 95, 879–888 CrossRef CAS.
- R. L. Levine, J. Moskovitz and E. R. Stadtman, IUBMB Life, 2000, 50, 301–307 CrossRef CAS.
- Y.-E. Kwon, J.-Y. Park and W.-K. Kim, Anticancer Res., 2007, 27, 321–326 CAS.
- L. R. Bernstein, in Metallotherapeutic Drugs and Metal-Based Diagnostic Agents, John Wiley & Sons, Ltd, 2005, pp. 259–277 Search PubMed.
Footnotes |
| † Electronic supplementary information (ESI) available: Crystallographic data in CIF, cyclic voltammogram, UV/vis spectra of DNA binding, gel images of DNA cleavage by complexes. CCDC 916433–916435. For ESI and crystallographic data in CIF or other electronic format see DOI: 10.1039/c3dt51296g |
| ‡ Both the authors have equal contribution to this work. |
| This journal is © The Royal Society of Chemistry 2013 |