 Open Access Article
Creative Commons Attribution 3.0 Unported Licence
A detailed kinetic analysis of rhodium-catalyzed alkyne hydrogenation†
Jingwei Luoa, Allen G. Oliverb and J. Scott McIndoe*a
aDepartment of Chemistry, University of Victoria, P.O. Box 3065, Victoria, BC V8W3V6, Canada. E-mail: mcindoe@uvic.ca; Fax: +1 (250) 721-7147; Tel: +1 (250) 721-7181
bDepartment of Chemistry and Biochemistry, University of Notre Dame, Notre Dame, IN 46556, USA
First published on 20th June 2013
Abstract
Continuous monitoring using electrospray ionisation mass spectrometry (ESI-MS) shows that Wilkinson's catalyst hydrogenates a charge-tagged alkyne to the corresponding alkene, and at only a marginally slower rate, to the alkane. No rhodium-containing intermediates were observed during the reaction, consistent with the established mechanism which points at the initial dissociation of triphenylphosphine from Rh(PPh3)3Cl as being the key step in the reaction. A numerical model was constructed that the closely matched the experimental data, and correctly predicted the response of the reaction to the addition of excess PPh3.
Introduction
Hydrogenation of alkynes and alkenes mediated by rhodium complexes is a classic catalytic organometallic reaction.1 First introduced by Wilkinson,2 his eponymous catalyst Rh(PPh3)3Cl has been widely employed, thanks to the mild conditions it operates under and its selectivity for C–C multiple bonds over other unsaturated sites.3 The mechanism of the reaction has been studied by a wide range of approaches, including kinetic,4,5 ionization potentials versus LUMOs,6 temperature programmed desorption,7 energy profile study,8 kinetics flash photolysis study,9,10 and para-hydrogen induced polarisation NMR techniques.11–14 It may well be the most well-studied organometallic catalytic reaction. It is relatively complicated, with off-cycle equilibria between catalyst monomer and dimer (and hydrogenated versions thereof) and between di- and tri-phosphine species. We have examined the reaction previously ourselves using electrospray ionisation mass spectrometry (ESI-MS), wherein we doped in sub-stoichiometric quantities of a charged phosphine ligand,15 [Ph2P(CH2)4PPh2Bn]+ [PF6]−, into a reaction mixture consisting of an alkene, hydrogen and Wilkinson's catalyst, and using chlorobenzene as a solvent.16 We observed a large variety of rhodium complexes consistent with the known speciation of this reaction mixture. However, because ESI-MS operates only on ions, the overall progress of the reaction was not tracked and therefore the concentration of intermediates cannot be matched to activity. As such, establishing whether or not an observed species is an intermediate, a resting state or a decomposition product is not easy. Of course, the ESI-MS experiment can be run in conjunction with other techniques, but the ideal technique should be capable of analyzing both. We've found that is the case for ESI-MS if the substrate is charged, and here we've used a charge-tagged alkyne to enable us to track the progress of the reaction as well as detect any appreciable quantities of intermediates that include the charged tag.ESI-MS is increasingly popular as a method of establishing solution speciation in organometallic reactions.17–26 It has been used on systems with inherently charged catalysts,27,28 with neutral catalysts that become charged via oxidation29 or protonation,30 and with catalysts with deliberately charged ligands.31,32 Use of charged substrates is somewhat rarer,17,33–40 as is continuous monitoring of reaction solutions, but we favour this approach thanks to the complete picture of speciation it provides.41
Experimental
Fluorobenzene was freshly distilled from P2O5 before use. All other solvents were dispensed from an MBraun solvent purification system (SPS) immediately before use. All reactions were under nitrogen or argon atmosphere. Chemicals and solvents were purchased from Aldrich and used without subsequent purification. All mass spectra were collected by using a Micromass Q-Tof micro mass spectrometer in positive ion mode using pneumatically assisted electrospray ionization: capillary voltage, 3000 V; extraction voltage, 0.5 V; source temperature, 90 °C; desolvation temperature, 180 °C; cone gas flow, 100 L h−1; desolvation gas flow, 100 L h−1; collision voltage, 2 V (for MS experiments); collision voltage, 2–80 V (for MS/MS experiments); MCP voltage, 2700 V.ESI-MS reaction monitoring using pressurized sample infusion
A Schlenk flask was used for these experiments, as described elsewhere.42,43 A solution of [1][PF6] (10–20 mg, 0.0212–0.0424 mmol) was monitored using the PSI-ESI-MS setup. The Schlenk flask was pressurized to 3 psi using 99.999% purity hydrogen gas. Wilkinson's catalyst, Rh(PPh3)3Cl (1–4 mg, 0.0011–0.0043 mmol) was dissolved in 1 mL of fluorobenzene and injected into the PSI flask via a septum. The solution end of PEEK tubing was protected with a cannula filter system to avoid the tube being blocked by any insoluble by-products. Data were processed by normalizing the abundance of each species to the total ion count of all species identified as containing the tag. No smoothing of the data was performed.1·Br. (4-Ethynylbenzyl)triphenylphosphonium bromide
Triphenylphosphine (5.14 g, 19.61 mmol) and 4-iodobenzyl bromide (2.58 g, 8.69 mmol) were added to 10 mL toluene in a Schlenk flask and the mixture was stirred for 72 hours. The solid product was dried under high vacuum for 48 hours (4.9 g, 8.69 mmol, 99%). A portion of the product (0.3 g, 0.54 mmol) was mixed with diisopropylamine (0.55 g 5.4 mmol), PdCl2(PPh3)2 (0.0019 g, 0.027 mmol), CuI (0.001 g, 0.0054 mmol) and Me3SiC2H (0.105 g, 1.08 mmol) in a 12![[thin space (1/6-em)]](https://www.rsc.org/images/entities/char_2009.gif) :
:![[thin space (1/6-em)]](https://www.rsc.org/images/entities/char_2009.gif) 5 mixture of MeOH and toluene and allowed to react for 2 hours. Silica flash column was applied for purification, and the desired product was isolated and dried to a brown powder (0.13 g, 0.28 mmol, 5%). Crystals for X-ray crystallographic analysis were grown by vapour diffusion of hexane into a chloroform solution. ESI-MS(+) m/z 377.1, (−) m/z 78.9.
5 mixture of MeOH and toluene and allowed to react for 2 hours. Silica flash column was applied for purification, and the desired product was isolated and dried to a brown powder (0.13 g, 0.28 mmol, 5%). Crystals for X-ray crystallographic analysis were grown by vapour diffusion of hexane into a chloroform solution. ESI-MS(+) m/z 377.1, (−) m/z 78.9.1·PF6. (4-Ethynylbenzyl)triphenylphosphonium hexafluorophosphate(V)
Sodium hexafluorophosphate (0.1 g, 0.6 mmol) was dissolved in 2 mL of water, and a 1 mL methanol–water solution of 1·Br (0.030 g, 0.065 mmol) was added with stirring. The product was filtered and washed with water and dried under high vacuum for a week. The final product was a white powder (0.028 g, 0.054 mmol, 83%). 1H NMR (CDCl3): δ (ppm) 7.82 (m, 3H); 7.68 (m, 7H); 7.55 (m, 7H); 6.89 (m, 2H); 4.61, (d, 2H); 3.10 (s, 1H). 31P NMR (CDCl3): δ (ppm) 23.38 (singlet); −143.61 (septet). ESI-MS(+) m/z 377.1, (−) m/z 145.0.2·Br. N,N-Dioctyl-N-(prop-2-yn-1-yl)octan-1-aminium bromide
Trioctylamine (15.92 g, 45.06 mmol) and diethyl ether (10 mL) were introduced into an aluminium foil-wrapped Schlenk flask at room temperature. Propargyl bromide (5 mL of an 80% solution in toluene) was added, and the mixture stirred for 72 hours. The solvent was evaporated and the light brown liquid dried under vacuum for 10 h. The final product was a light brown solid (19.75 g, 41.8 mmol, 93%). ESI-MS(+) m/z 392.6, (−) m/z 78.9.2·PF6. N,N-Dioctyl-N-(prop-2-yn-1-yl)octan-1-aminium hexafluorophosphate(V)
A methanol solution (10 mL) of 2·Br (5.28 g, 11.2 mmol) and sodium hexafluorophosphate (2.8 g, 16.7 mmol) was prepared. The mixture was added dropwise into 500 mL of distilled water and stirred for 1 h. The yellow oily product was washed twice with 100 mL of distilled water under sonication and dried under vacuum. Final product was a yellowish white powder (5.2 g, 9.7 mmol, 86%). 1H NMR (CDCl3): δ (ppm) 4.08 (d, 2H); 3.26 (m, 6H); 2.78 (t, 1H); 1.66 (m, 6H); 1.27, (m, 33H); 0.88 (m, 6H). ESI-MS(+) m/z 392.6, (−) m/z 145.0.3·I. Hex-5-yn-1-yltriphenylphosphonium iodide
Triphenylphosphine (5.00 g, 19.04 mmol) was dissolved into 10 mL of toluene in a Schlenk flask at 75 °C, and 6-iodo-1-hexyne (1.00 g, 4.81 mmol) added dropwise over 10 minutes. The mixture was stirred for 72 hours, before the product was filtered off, washed with toluene and dried under high vacuum. Final product was a white powder (2.22 g, 4.72 mmol, 98%). Crystals for X-ray crystallographic analysis were grown by vapour diffusion of hexane into a chloroform solution. ESI-MS(+) m/z 343.1.1, (−) m/z 126.9.3·PF6. Hex-5-yn-1-yltriphenylphosphonium hexafluorophosphate(V)
Sodium hexafluorophosphate (0.56 g, 2.12 mmol) was dissolved in 5 mL of water, and 5 mL of a methanol–water mixed solution of [Ph3P(CH2)4C2H]+[I]− (0.5 g 1.06 mmol) was added dropwise with stirring. The product was filtered and washed with water and dried under high vacuum for a week. Final product was a white powder (0.55 g, 1.12 mmol, 53%). 1H NMR (CDCl3): δ (ppm) 7.81 (m, 3H); 7.70 (m, 12H); 3.22 (m, 2H); 2.29 (m, 2H); 1.86, (t, 1H); 1.81 (m, 3H); 1.26 (s, 1H). ESI-MS(+) m/z 343.1, (−) m/z 145.0.Results and discussion
We examined a number of charged alkynes for suitability in hydrogenation reactions. The ideal charged tag is one that conveys amenability for ESI-MS analysis without itself being involved in the reaction. It should also be easy to prepare and purify. It should be high in mass and have high surface activity, so it will dominate spectral intensity and providing very similar response factors for all ions involving that tag. It should have a relatively non-coordinating anion, to maximally reduce the extent of ion pairing, improving sensitivity and minimizing the appearance of complicating aggregate ions. Initially, a triphenylphosphonium salt in which the alkyne was remote from the charge, [Ph3P(CH2)(C6H4)C2H]+[PF6]− (1), was tried. This salt proved impervious to reaction other than at the alkyne and crystalline (see ESI† for crystal structure of the bromide salt of this cation), but proved to be too insoluble in the solvents of interest, even with a variety of different alkynes. While ESI-MS is quite sensitive enough to detect these salts in solution, the low solubility led to real problems in accurately establishing catalyst loadings because of the low concentrations required and the difficulty inherent in avoiding decomposition of the catalyst. The alkyne-functionalized trioctylamine salt, [N(C8H17)3(CH2C2H)]+[PF6]− (2), failed to meet the required criteria when analysis revealed that the ammonium tag was readily cleaved to form [N(C8H17)3H]+ at a rate that was competitive with hydrogenation of the alkyne (see ESI†), and generated numerous Rh-containing catalyst decomposition products (see ESI†). 2 also produced significant amounts of aggregates of the form [(cation)n + (anion)n−1]+,44 complicating the analysis. Accordingly, we switched to the charged alkyne [Ph3P(CH2)4C2H]+[PF6]− (3), which is readily prepared from 6-bromohexyne and triphenylphosphine, followed by salt metathesis with Na[PF6]. 3 suffered from no solubility, reactivity or aggregation problems as the [PF6]− salt, and all experiments described used this phosphonium-tagged terminal alkyne as the substrate.Crystals of [Ph3P(CH2)4C2H]+I− (the alkyne starting material, before metathesis of the iodide salt for [PF6]− to make 3) its structure determined (Fig. 1). Structural parameters are entirely ordinary, in keeping with the idea that there is nothing exceptional about the alkyne functional group – it is remote enough from the charged tag that its chemistry is unaffected by the distant modification (Fig. 2).
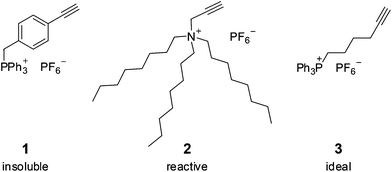 | ||
| Fig. 1 Different types of charged substrates. | ||
![X-ray crystal structure of [Ph3P(CH2)4C2H]+ I– (the precursor to 3). Key structural parameters: C5–C6 1.118 Å; C4–C5–C6 177.51°.](/image/article/2013/DT/c3dt51212f/c3dt51212f-f2.gif) | ||
| Fig. 2 X-ray crystal structure of [Ph3P(CH2)4C2H]+ I– (the precursor to 3). Key structural parameters: C5–C6 1.118 Å; C4–C5–C6 177.51°. | ||
Our initial experiments were run at high loadings of Wilkinson's catalyst in order to maximise the chances of observing catalytic intermediates involving the charge-tagged alkyne. Such high catalyst loadings also have the benefit of making the reaction considerably faster. To simplify the analysis, experiments were run under the same pressure of hydrogen as is usually employed in the PSI-ESI-MS experiment, i.e. 3–5 psi above atmospheric pressure (i.e. ∼130 kPa).42 This overpressure still represents a large excess of hydrogen; the reaction was conducted at 0.0082 mmol in 10 mL, i.e. a 0.82 mmol L−1 concentration, so one equivalent of hydrogen required just 0.4 mL of gas, and the experiment used a flask with a volume of ∼100 mL.
Hydrogenation of alkenes and alkynes is assumed to proceed via the widely accepted mechanism illustrated in Scheme 1. In previous studies using ESI-MS and a charged phosphine ligand,15 no intermediates containing the alkene were observed, though a variety of off-cycle species such as Rh2P4Cl2 and RhP3ClH2 were detected. The predominant Rh-containing species was RhP3Cl.
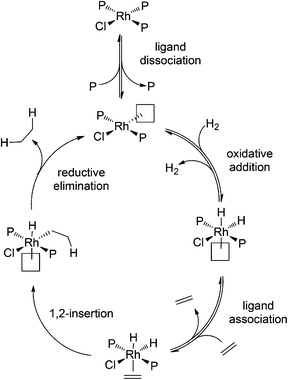 | ||
| Scheme 1 Mechanism of alkene hydrogenation using Wilkinson's catalyst, adapted from Halpern.45 | ||
Following the reaction with the charge-tagged alkyne 3 led to production of the corresponding alkene (4) and alkane (5), as expected (Fig. 3). The reaction was run at room temperature with a high catalyst loading to maximize the chances of observing a rhodium-containing intermediate that included the charged tag, but no such intermediates were observed. This negative result tells us that the 1,2-insertion and the reductive elimination are not turnover limiting, or we would expect the intermediates prior to each of these steps to attain an appreciable abundance. It does not tell us whether the phosphine dissociation, oxidative addition of dihydrogen, or alkyne/alkene binding are turnover-limiting, because the tagged ligand is not involved in any of these steps.
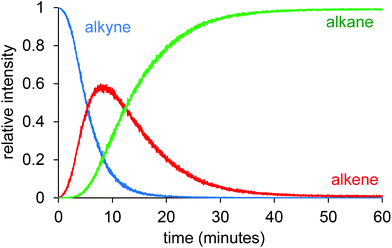 | ||
| Fig. 3 Relative intensity vs. time traces for alkyne (3), alkene (4) and alkane (5). | ||
The experiment was conducted at different temperatures in order to exclude the possibility that the reactivity observed is some sort of artifact of the electrospray process itself or a gas-phase phenomenon. Cooks noted that certain reactions are greatly accelerated during supersonic expansion in the ESI process (by several orders of magnitude in one example).46 However, if that were the case in these reactions, we would expect to see similar reactivity regardless of the reaction flask temperature. However, this is patently not the case; the reaction is very fast at high flask temperatures, and very slow at cold flask temperatures, and both were collected under ESI source conditions that were identical. This observation is strong evidence for the data representing solution rather than gas-phase conditions. The three temperatures examined were 0.0 °C, 23.0 °C (ambient) and 58.2 °C. The temperature of the solution was not controlled between flask and ESI source, so in each case, there was a brief period (on the order of a few seconds) in which the reaction temperature was altered (Fig. 4).
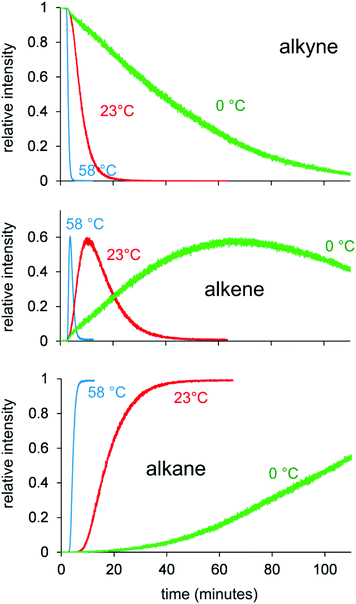 | ||
| Fig. 4 Traces for disappearance of alkyne (top), appearance and disappearance of alkene (middle), and appearance of alkane (bottom) at temperatures of 0 °C, 23 °C and 58 °C. | ||
It is clear from the data that reduction of the alkyne and alkene are competitive processes with similar rates, since alkane starts being produced as soon as the alkene is generated. We can numerically model these processes to allow us to estimate the key rate constants, though the model is complicated by the fact that both cycles operate simultaneously and in competition with one another (Fig. 5).
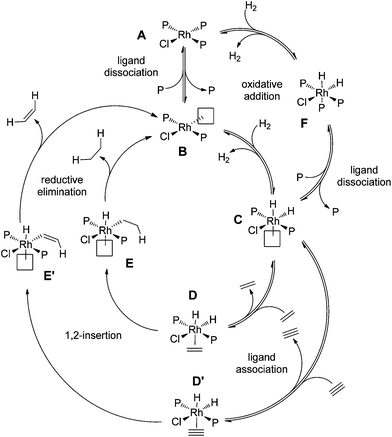 | ||
| Fig. 5 Catalytic cycle for hydrogenation of alkyne to alkane, where the two hydrogenations compete with one another. | ||
We used the program PowerSim,47 modelling each of the steps using published rate constants as a starting point wherever possible.4,48,49 For the reaction at 23 °C and 17% catalyst loading, the modelled rates that provided the best match with experimental data are listed in Table 1. Given the large number of independent parameters, the numbers need to be treated with some reservations, but they provide a satisfying solution to the experimental data based on the accepted mechanism (Fig. 6). The model is, as expected, highly insensitive to changes rates of the fastest reactions, but the rate of phosphine dissociation and the relative rates of the alkene vs. alkyne association are expected to be fairly accurate.
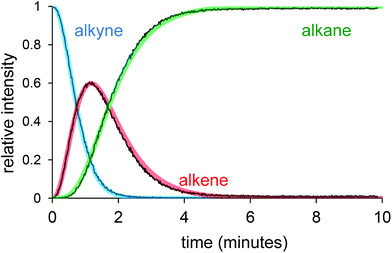 | ||
| Fig. 6 Match between simulated and experimental reaction progress curves. The thin black lines are the experimental curves; the thick transparent lines are the calculated curves. | ||
| Rate constant, k | Rate constant, k for forward reactiona | Rate constant, k for back reactiona |
|---|---|---|
| a Concentrations (in mmol L−1) used were as per the experimental section. First order rate constants have units of s−1; second order rate constants have units of mmol−1 s−1. | ||
| A → B + P | 0.00385 | 13.6 |
| A + H2 → F | 0.0001 | 1 × 10⁻⁸ |
| F → C + P | 0.0033 | 13.6 |
| B + H2 → C | 4000 | 1 |
| C + alkene → D | 47 | 5000 |
| C + alkyne → D′ | 141 | 4000 |
| D → E | 10![[thin space (1/6-em)]](https://www.rsc.org/images/entities/char_2009.gif) 000 000 | 0 |
| E → B + alkane | 10![[thin space (1/6-em)]](https://www.rsc.org/images/entities/char_2009.gif) 000 000 | 0 |
| D′ → E′ | 10![[thin space (1/6-em)]](https://www.rsc.org/images/entities/char_2009.gif) 000 000 | 0 |
| E′ → B + alkene | 10![[thin space (1/6-em)]](https://www.rsc.org/images/entities/char_2009.gif) 000 000 | 0 |
A key step to note is the slowness of the initial ligand dissociation to form B, the unsaturated complex P2RhCl, and the extent to which this reaction lies towards the catalyst precursor A. To match accurately the rest of the reaction, the final steps of the reaction prove to be fast (modelled as irreversible reactions with rates of 10![[thin space (1/6-em)]](https://www.rsc.org/images/entities/char_2009.gif) 000 units, but the model is essentially insensitive to changes in these rates once they are faster than the earlier reactions in the cycle), and the slowest steps in the productive part of the cycle are the ligand association of alkene or alkyne with the unsaturated 16e RhIII complex, P2Rh(H)2Cl, C. That a ligand association should be slow is somewhat counter-intuitive unless the fact that a solvent molecule needs to be displaced first is taken into account (solvent involvement was not explicitly modelled). The model predicts that the ligand association reaction lies a long way towards the unsaturated (=solvent coordinated) complex, and that the forward reaction is approximately three times faster for the alkyne over the alkyne (the back reactions are much faster and both of similar magnitude). This low level of selectivity means that partial hydrogenation50–53 is not feasible with Wilkinson's catalyst, at least without the addition of modifying agents.54
000 units, but the model is essentially insensitive to changes in these rates once they are faster than the earlier reactions in the cycle), and the slowest steps in the productive part of the cycle are the ligand association of alkene or alkyne with the unsaturated 16e RhIII complex, P2Rh(H)2Cl, C. That a ligand association should be slow is somewhat counter-intuitive unless the fact that a solvent molecule needs to be displaced first is taken into account (solvent involvement was not explicitly modelled). The model predicts that the ligand association reaction lies a long way towards the unsaturated (=solvent coordinated) complex, and that the forward reaction is approximately three times faster for the alkyne over the alkyne (the back reactions are much faster and both of similar magnitude). This low level of selectivity means that partial hydrogenation50–53 is not feasible with Wilkinson's catalyst, at least without the addition of modifying agents.54
Because the key rate constant is the ligand dissociation step to generate the unsaturated 14 electron RhP2Cl from RhP3Cl, we would expect the reaction to be inhibited by the addition of PPh3 (the mechanism predicts a reaction rate that is inversely first order in triphenylphosphine concentration). That proves to be true; the reaction slows substantially with added PPh3. The experiments were conducted with 5% catalyst at 91.0 °C, in order to expedite the analyses. Extra PPh3 was loaded before the catalyst solution was added, with 0 eq., 1 eq. to catalyst and 2 eq. to catalyst. The changes in reaction rate were predicted well by our numerical model when we altered only the initial concentration of PPh3 (Fig. 7), adding confidence to its accuracy.
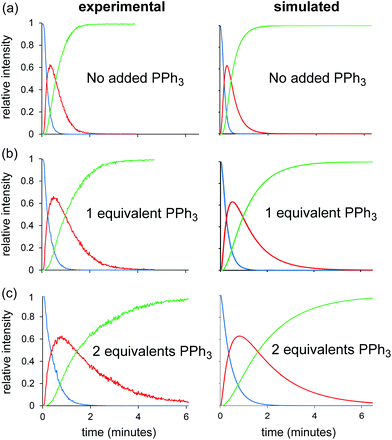 | ||
| Fig. 7 Experimental traces for hydrogenation of 3 using Wilkinson's catalyst (5 mol%) at 91 °C in the presence of (a) no added PPh3, (b) one equivalent of PPh3, and (c) two equivalents of PPh3. The right-hand column shows the corresponding traces calculated by the numerical model, wherein only the starting concentration of PPh3 has been altered. | ||
Conclusions
Alkyne hydrogenation can be studied in dense kinetic detail using pressurised sample infusion to continuously and directly monitor the reaction using ESI-MS. Confidence in the quality and reliability of the data so obtained is enhanced by the excellent matches between experimental data and that obtained by numerically modelling the reaction based on a well-established mechanism. Both the model and the experimental data responded in the same way to perturbations to the concentration of free phosphine, which predictably slows the reaction given that the turnover-limiting step involves dissociation of the phosphine from Wilkinson's catalyst to generate the unsaturated, 14-electron complex that rapidly oxidatively adds hydrogen.Acknowledgements
JSM thanks the Natural Sciences and Engineering Research Council (NSERC) of Canada for a Discovery Grant and a Discovery Accelerator Supplement, the Canada Foundation for Innovation (CFI) and the British Columbia Knowledge Development Fund (BCKDF), and the University of Victoria for instrumentation and operational funding. We thank Dr Lisa Rosenberg for a donation of Wilkinson's catalyst. We also thank Professor Peter Chen for useful discussions on the subject of numerical modelling.References
- B. R. James, Homogeneous hydrogenation, John Wiley & Sons Canada, Limited, 1973 Search PubMed.
- J. F. Young, J. A. Osborn, F. H. Jardine and G. Wilkinson, Chem. Commun., 1965, 131–132 RSC.
- J. A. Osborn, F. H. Jardine, J. F. Young and G. Wilkinson, J. Chem. Soc. A., 1966, 1711–1732 RSC.
- J. Halpern, T. Okamoto and A. Zakhariev, J. Mol. Catal., 1977, 2, 65–68 CrossRef CAS.
- M. I. Cabrera, P. D. Zgolicz and R. J. Grau, Appl. Catal., A, 2008, 334, 291–303 CrossRef CAS.
- D. J. Nelson, R. Li and C. Brammer, J. Org. Chem., 2004, 70, 761–767 CrossRef.
- M. Bowker, J. Gland, R. Joyner, Y. Li, M. Slin'ko and R. Whyman, Catal. Lett., 1994, 25, 293–308 CrossRef CAS.
- N. Koga, C. Daniel, J. Han, X. Y. Fu and K. Morokuma, J. Am. Chem. Soc., 1987, 109(11), 3455–3456 CrossRef CAS.
- D. Wink and P. C. Ford, J. Am. Chem. Soc., 1985, 107, 1794–1796 CrossRef CAS.
- D. A. Wink and P. C. Ford, J. Am. Chem. Soc., 1987, 109, 436–442 CrossRef CAS.
- S. B. Duckett, C. L. Newell and R. Eisenberg, J. Am. Chem. Soc., 1993, 115, 1156–1157 CrossRef CAS.
- S. B. Duckett, C. L. Newell and R. Eisenberg, J. Am. Chem. Soc., 1994, 116, 10548–10556 CrossRef CAS.
- I. V. Koptyug, K. V. Kovtunov, S. R. Burt, M. S. Anwar, C. Hilty, S.-I. Han, A. Pines and R. Z. Sagdeev, J. Am. Chem. Soc., 2007, 129, 5580–5586 CrossRef CAS.
- J. Bargon, J. Kandels and P. Kating, J. Chem. Phys., 1993, 98, 6150 CrossRef CAS.
- D. M. Chisholm and J. Scott McIndoe, Dalton Trans., 2008, 3933–3945 RSC.
- D. M. Chisholm, A. G. Oliver and J. S. McIndoe, Dalton Trans., 2010, 39, 364–373 RSC.
- P. Chen, Angew. Chem., Int. Ed., 2003, 42, 2832–2847 CrossRef CAS.
- S. Torker, D. Merki and P. Chen, J. Am. Chem. Soc., 2008, 130, 4808–4814 CrossRef CAS.
- N. Shankaraiah, W. A. da Silva, C. K. Z. Andrade and L. S. Santos, Tetrahedron Lett., 2008, 49, 4289–4291 CrossRef CAS.
- F. Avila-Salas, C. Sandoval, J. Caballero, S. Guiñez-Molinos, L. S. Santos, R. E. Cachau and F. D. González-Nilo, J. Phys. Chem. B, 2012, 116, 2031–2039 CrossRef CAS.
- L. S. Santos, Eur. J. Org. Chem., 2008, 2008, 235–253 CrossRef.
- A. Kamal, N. Markandeya, N. Shankaraiah, C. R. Reddy, S. Prabhakar, C. S. Reddy, M. N. Eberlin and L. Silva Santos, Chem.–Eur. J., 2009, 15, 7215–7224 CrossRef CAS.
- M. Eberlin, Eur. J. Mass. Spectrom., 2007, 13, 19–28 CrossRef CAS.
- P. S. D. Robinson, G. N. Khairallah, G. da Silva, H. Lioe and R. A. J. O'Hair, Angew. Chem., Int. Ed., 2012, 51, 3812–3817 CrossRef CAS.
- V. Ryzhov, A. Y. Lam and R. J. O'Hair, J. Am. Soc. Mass Spectrom., 2009, 20, 985–995 CrossRef CAS.
- K. L. Vikse, Z. Ahmadi, C. C. Manning, D. A. Harrington and J. S. McIndoe, Angew. Chem., Int. Ed., 2011, 123, 8454–8456 CrossRef.
- L. Banu, V. Blagojevic and D. K. Bohme, J. Phys. Chem. B, 2012, 116, 11791–11797 CrossRef CAS.
- D. E. Polyansky, J. T. Muckerman, J. Rochford, R. Zong, R. P. Thummel and E. Fujita, J. Am. Chem. Soc., 2011, 133, 14649–14665 CrossRef CAS.
- J. D. Bridgewater, J. Lim and R. W. Vachet, Anal. Chem., 2006, 78, 2432–2438 CrossRef CAS.
- Z.-J. Wu, S.-W. Luo, J.-W. Xie, X.-Y. Xu, D.-M. Fang and G.-L. Zhang, J. Am. Soc. Mass Spectrom., 2007, 18, 2074–2080 CrossRef CAS.
- S. M. Jackson, D. M. Chisholm, J. S. McIndoe and L. Rosenberg, Eur. J. Inorg. Chem., 2011, 2011, 327–330 CrossRef.
- C. H. Beierlein, B. Breit, R. A. Paz Schmidt and D. A. Plattner, Organometallics, 2010, 29, 2521–2532 CrossRef CAS.
- A. O. Aliprantis and J. W. Canary, J. Am. Chem. Soc., 1994, 116, 6985–6986 CrossRef CAS.
- M. A. Schade, J. E. Fleckenstein, P. Knochel and K. Koszinowski, J. Org. Chem., 2010, 75, 6848–6857 CrossRef CAS.
- I. Ahmed, A. M. Bond, R. Colton, M. Jurcevic, J. C. Traeger and J. N. Walter, J. Organomet. Chem., 1993, 447, 59–65 CrossRef CAS.
- R. Colton and J. C. Traeger, Inorg. Chim. Acta, 1992, 201, 153–155 CrossRef CAS.
- D. J. F. Bryce, P. J. Dyson, B. K. Nicholson and D. G. Parker, Polyhedron, 1998, 17, 2899–2905 CrossRef CAS.
- C. Decker, W. Henderson and B. K. Nicholson, J. Chem. Soc., Dalton Trans., 1999, 3507–3513 RSC.
- C. Hinderling, C. Adlhart and P. Chen, Angew. Chem., Int. Ed., 1998, 37, 2685–2689 CrossRef CAS.
- C. Adlhart, C. Hinderling, H. Baumann and P. Chen, J. Am. Chem. Soc., 2000, 122, 8204–8214 CrossRef CAS.
- M. A. Henderson, J. Luo, A. Oliver and J. S. McIndoe, Organometallics, 2011, 30, 5471–5479 CrossRef CAS.
- K. L. Vikse, M. P. Woods and J. S. McIndoe, Organometallics, 2010, 29, 6615–6618 CrossRef CAS.
- K. L. Vikse, Z. Ahmadi, J. Luo, N. van der Wal, K. Daze, N. Taylor and J. S. McIndoe, Int. J. Mass Spectrom., 2012, 323–324, 8–13 CAS.
- P. J. Dyson, J. S. McIndoe and D. Zhao, Chem. Commun., 2003, 508–509 RSC.
- J. Halpern, Inorg. Chim. Acta, 1981, 50, 11–19 CrossRef CAS.
- T. Müller, A. Badu-Tawiah and R. G. Cooks, Angew. Chem., Int. Ed., 2012, 51, 11832–11835 CrossRef.
- Powersim Studio Academic, Powersim Software AS, Bergen, Norway, 2012 Search PubMed.
- C. A. Tolman, P. Z. Meakin, D. I. Lindner and J. P. Jesson, J. Am. Chem. Soc., 1974, 96, 2762–2774 CrossRef CAS.
- P. Meakin, J. P. Jesson and C. A. Tolman, J. Am. Chem. Soc., 1972, 94, 3240–3242 CrossRef CAS.
- M. Armbrüster, M. Behrens, F. Cinquini, K. Föttinger, Y. Grin, A. Haghofer, B. Klötzer, A. Knop-Gericke, H. Lorenz, A. Ota, S. Penner, J. Prinz, C. Rameshan, Z. Révay, D. Rosenthal, G. Rupprechter, P. Sautet, R. Schlögl, L. Shao, L. Szentmiklósi, D. Teschner, D. Torres, R. Wagner, R. Widmer and G. Wowsnick, ChemCatChem, 2012, 4, 1048–1063 CrossRef.
- M. P. R. Spee, J. Boersma, M. D. Meijer, M. Q. Slagt, G. van Koten and J. W. Geus, J. Org. Chem., 2001, 66, 1647–1656 CrossRef CAS.
- I. N. Michaelides and D. J. Dixon, Angew. Chem., Int. Ed., 2013, 52, 806–808 CrossRef CAS.
- M. Yan, T. Jin, Y. Ishikawa, T. Minato, T. Fujita, L.-Y. Chen, M. Bao, N. Asao, M.-W. Chen and Y. Yamamoto, J. Am. Chem. Soc., 2012, 134, 17536–17542 CrossRef CAS.
- K. Urabe, Y. Tanaka and Y. Izumi, Chem. Lett., 1985, 14, 1595–1596 CrossRef.
Footnote |
| † Electronic supplementary information (ESI) available. CCDC 937932 and 937933. For ESI and crystallographic data in CIF or other electronic format see DOI: 10.1039/c3dt51212f |
| This journal is © The Royal Society of Chemistry 2013 |
