 Open Access Article
A cartography of the van der Waals territories†‡
Santiago Alvarez
Departament de Química Inorgànica and Institut de Química Teòrica i Computacional, Universitat de Barcelona, Martí i Franquès 1-11, 08028 Barcelona, Spain. E-mail: santiago@qi.ub.es
First published on 1st May 2013
Abstract
The distribution of distances from atoms of a particular element E to a probe atom X (oxygen in most cases), both bonded and intermolecular non-bonded contacts, has been analyzed. In general, the distribution is characterized by a maximum at short E⋯X distances corresponding to chemical bonds, followed by a range of unpopulated distances – the van der Waals gap – and a second maximum at longer distances – the van der Waals peak – superimposed on a random distribution function that roughly follows a d3 dependence. The analysis of more than five million interatomic “non-bonded” distances has led to the proposal of a consistent set of van der Waals radii for most naturally occurring elements, and its applicability to other element pairs has been tested for a set of more than three million data, all of them compared to over one million bond distances.
1. Introduction
Except for the noble gases, atoms have seldom an independent life. They may appear in pairs, linked by strong covalent bonds as in dihydrogen, dioxygen, dinitrogen and dihalogen molecules, in somewhat larger molecules such as P4 or S8 and forming networks such as those of graphite, diamond or in close packed structures of metals. If ionized, they are surrounded by ions of opposite sign or by solvent molecules, as exemplified by the halides or the alkaline cations. An important group of chemists are more concerned about polyatomic molecules, in which atoms are held together by more or less strong covalent bonds. Moreover, there has been growing interest in understanding how the atoms in neighboring molecules stick together through an assortment of weak bonding interactions1 such as hydrogen bonding,2 π–π stacking,3 halogen bonding,4 cation–π and anion–π,5 or van der Waals interactions.6,7In spite of the little significance of atoms as independent chemical species, the whole conceptual framework of contemporary chemistry is based on the idea that atoms of a given element retain most of their identity in whichever molecular or extended matrix they are. We are ready to accept that an atom of a particular element preserves its personality even in different situations in which its number of valence electrons may be quite different, as witnessed by the widely variable oxidation states that can be found for transition metals. The chromium group metals, for instance, can appear with oxidation states between −4 and +6.8 One of the properties that we ascribe to the atoms of each element is an atomic size, admitting that different size measures should be adopted for ions, atoms within molecules, and atoms connected through van der Waals forces. These sizes are semi-quantitatively represented by ionic, covalent and van der Waals radii, respectively,9 which have been traditionally deduced mostly from experimental interatomic distances. In spite of the extensive use made of such empirical parameters for the analysis of molecular and crystal structures, only in recent years was a set of consistent covalent radii made available for most of the naturally occurring elements.10 What is the current situation with van der Waals radii?
The van der Waals radii and associated van der Waals surfaces are extensively used for crystal packing and supramolecular interaction analysis,11 in the search for a better understanding of the physical properties of molecular crystals, such as melting points,12 magnetic behaviour13 or electrical conductivity.14 The important role played by the van der Waals radii in Chemistry15 and the wide use made of those proposed by Bondi16,17 are highlighted by over 500 yearly citations to his original publication during the last five years. One of the shortcomings of Bondi's radii, however, is that they are available for only 38 elements, including just a few transition metals and only uranium among the f-block elements. Moreover, those radii show no clear periodic trends and some of them are intriguingly close to the respective covalent radii. In a remarkable study, Rowland and Taylor carried out a statistical analysis of intermolecular contacts in X-ray crystal structures to deduce van der Waals radii for a few main group elements, which were found to be consistent with those proposed earlier by Bondi18 but, unfortunately, such a study has not been extended to the whole periodic table up to now.
More recent attempts to establish a set of van der Waals radii are due to Batsanov,19 who provided data for 68 elements, including transition metals but no lanthanides and actinides, with the exception of Th and U. An intriguing feature of this set of radii is that transition metals from the 3d, 4d and 5d series all have quite similar values. It must be stated that those radii have been estimated from bond distances assuming that the van der Waals radius for a given element is 0.8 Å longer than its covalent radius. A related approach has been applied by Datta and co-workers,20 who have also proposed van der Waals radii for transition elements by incrementing the sum valence parameters by a constant amount, a procedure later extended in a simplified way by Hu and co-workers to lanthanides and several actinides.21,22
From a different viewpoint, using van der Waals distances from theoretical calculations, Truhlar presented a set of radii compatible with Bondi's set, increasing the number of represented elements by adding the remaining 16 main group elements, but disregarding again transition and rare earth elements, and deduced from computational studies on van der Waals interactions with noble gas atomic probes.23 Radii deduced from computational data have been traditionally used for the calculation of intermolecular interactions in force fields for molecular mechanics calculations.24
The methodology proposed earlier by Rowland and Taylor will be applied in this work to fully exploit the wealth of structural data on intermolecular interactions present in the Cambridge Structural Database (CSD),25 in an attempt to establish representative van der Waals radii of as many elements as possible. In so doing, I shall make no attempt to consider in detail the well known anisotropy in the distribution of the van der Waals contacts,26 and will adopt the simplest approach, considering spherical van der Waals atoms, while disregarding in general such fine details as the oxidation state and coordination number of the element under consideration.
2. Overview of the interatomic distance distributions
The approach adopted in this work consists in extracting a van der Waals radius for each element E from the experimental distances of its intermolecular contacts with a reference element X, whose van der Waals radius, rX, has been previously determined. Before doing so, we need to understand the generalities of the distribution of interatomic E–X distances, both bonding and non-bonding. A characteristic example is provided by the Sr–O distance distribution (Fig. 1), for which we make no distinction here as to the atom's oxidation state or coordination number for simplicity. In the Sr–O distance distribution map one finds several distinct regions: (i) the short distances (between 2.4 and 3.2 Å) corresponding to chemical bonds, (ii) a range of distances at which practically no structures are found (between 3.2 and 3.6 Å in the Sr–O map), forming a van der Waals gap between the intra- and intermolecular Sr–O distances, (iii) a peak corresponding to a maximum in the distribution function, which can be assigned to Sr⋯O van der Waals interactions, centered at around 4.8 Å, that I will refer to as the van der Waals peak, and (iv) a region of randomly distributed non-interacting O atoms around Sr, whose frequency is expected to increase with the size of the sphere of radius d, i.e., with the cube of the interatomic distance.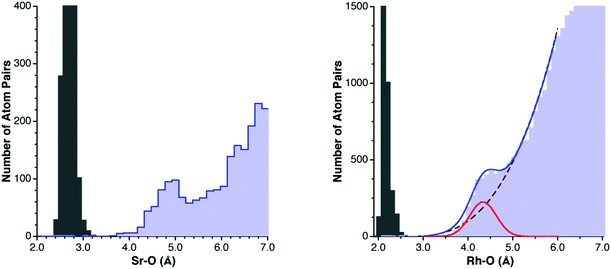 | ||
| Fig. 1 Left: Distribution of Sr–O distances attributed to covalent bonds (gray bins) and to intermolecular contacts (light blue bins). Right: Distribution of the intermolecular Rh⋯O distances (light blue bins) and fitting to the idealized distribution function of eqn (1) (continuous line), deconvoluted into the van der Waals (red line) and random (dashed line) contributions, with the Rh–O bond distance distribution shown for reference (gray bins). | ||
For subsequent discussion, it will be useful to have at hand a qualitative depiction of a typical E–X distance distribution map (Scheme 1). This view, which includes the bonding region and the van der Waals gap, provides a wider perspective than the commonly adopted description that considers only the van der Waals peak and the overlapping random distribution function, and for which the relationship between intermolecular potential energy and distance distribution has been discussed by Dance6 within the conceptual framework of the structure correlation principle introduced by Dunitz and Bürgi.27 I consider throughout this work as “bonds” only the single bonds for simplicity, since multiple bonding can alter the bond peak only at the short distances extreme and will not affect the region defining the onset of the van der Waals gap.
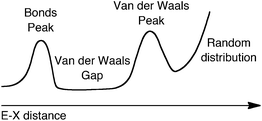 | ||
| Scheme 1 | ||
It is worth noting that the non-interacting and van der Waals regions often overlap. We could ideally express the number of E⋯X contacts at a distance d in the intermolecular region (i.e., above the van der Waals gap) as the sum of the number of van der Waals-interacting atom pairs, described by a Gaussian distribution centered at dmax with a full width at half maximum of the peak of 2.3548σ, and the number of randomly distributed non-interacting pairs, which should increase with the volume of a sphere of radius d, i.e., it should increase with d3. One could therefore attempt to define the non-bonded interatomic distance distribution function by eqn (1), where the first term describes the position (dmax), width (σ) and relative abundance (calibrated by the weighting parameter a) of van der Waals contacts, and the second term represents the shortest non-bonding distance (d0) and the relative abundance of non-interacting atom pairs (weighting parameter b).
 | (1) |
From eqn (1) we can roughly quantify the relative abundance of van der Waals and randomly distributed contacts at the center of the van der Waals peak. Thus, the percentage of van der Waals contacts at d = dmax is given by eqn (2):
 | (2) |
A nice example of how the experimental distribution of non-bonded distances follows the law represented by eqn (1) is provided by the Rh–O contacts (Fig. 1, right). Fitting the region around the van der Waals peak of the experimental histogram to eqn (1) yields the following parameters: a = 3.90, dmax = 4.33 Å, σ = 0.29 Å, b = 78.4, and d0 = 2.57 Å. The application of eqn (2) tells us that at dmax the intermolecular Rh⋯O contacts can be estimated to be composed of 56% van der Waals interactions and 44% randomly distributed, non-interacting Rh/O pairs, visually shown by deconvoluting the distribution curve into its two components (Fig. 1b). This parameter should be useful to calibrate the quality of the dataset for a particular element: a high ρvdW value implies a clear identification of the position of the van der Waals peak and a high accuracy in the resulting van der Waals radius, whereas small values indicate that the van der Waals peak may not be clearly distinguished from the random distribution background. As a rule of thumb, ρvdW values of 45% or less indicate relatively poorly defined van der Waals peaks and a large uncertainty in the resulting van der Waals radii.
The main parameters that quantify an idealized E–X distance map are summarized in Scheme 2, where RE and RX are the covalent radii, g1 and g2 indicate the lower and upper limits of the van der Waals gap (i.e., the longest bonded and shortest non-bonded distances, respectively), rE and rX are the van der Waals radii, and 2.35σ is the width of the van der Waals peak at half height. Note that g1 and g2 will be taken here as the experimental distances that define the van der Waals gap or pseudogap, whereas d0 results from fitting the experimental data to eqn (1). Similarly, hmax will indicate the position of the maximum of the van der Waals peak in the histogram of experimental distances, whereas dmax refers to the maximum of the fitted distribution function of eqn (1). Finally, point z indicates the borderline between the van der Waals peak and the purely random distribution of atom pairs.
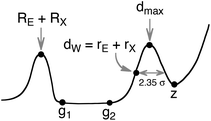 | ||
| Scheme 2 | ||
One should not forget, however, that the general picture given in Schemes 1 and 2 may be modified in specific cases by the presence of hydrogen bonds,2,28 secondary bonding with Lewis acid or basic atoms,29 ionic bonding, metallophilic bonding,30 π-stacking interactions,3 or some other of the plethora of intermolecular interactions that are frequently grouped under the generic terms of van der Waals or non-covalent interactions.1 Special care must be taken in those cases to distinguish the different types of intermolecular bonding associated with specific regions of the distance maps.31
2.1. Hydrogen bonding
Special caution must be taken not to count an intermolecular distance between two atoms as due to a van der Waals interaction if there may be other reasons for their proximity. The most common such case is that of hydrogen bonding. The distance between an arbitrary element E and oxygen, for instance, may be determined by either direct hydrogen bonding between E and O, or via an indirect H-bonding interaction (Scheme 3). The distribution of O⋯O distances constitutes a paradigmatic example. For hydrogen-bonded pairs one finds a maximum frequency centered at about 2.9 Å (Fig. 2), and intermolecular contacts disregarding hydrogen-containing atoms give a van der Waals peak at around 3.3 Å. Clearly, if atom pairs linked through hydrogen bonding were not excluded for the analysis of the van der Waals contacts, a too short van der Waals distance would artificially result. | ||
| Scheme 3 | ||
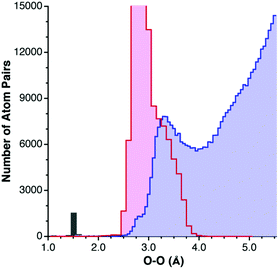 | ||
| Fig. 2 Distribution of hydrogen-bonded O⋯O contacts (pink bins), compared with that of the non-hydrogen bonded O⋯O distances (light blue bins), and bond distances (gray bin). | ||
The price to be paid for disregarding hydrogen-containing atom pairs is that the size of the dataset may be dramatically reduced and it may be difficult to observe the VdW peak in some cases. That is what happens for nitrogen, which forms many hydrogen-bonds to oxygen, and the dataset for N⋯O contacts with no hydrogen atoms shown in Fig. 3a does not allow one to establish the position of the van der Waals peak. A look at the analogous N⋯N contacts, in contrast (Fig. 3b), shows the existence of a relatively small portion of hydrogen bonds, and the distribution of the H-free structures insinuates a maximum at around 3.9 Å. Inclusion of hydrogen-containing N atoms in the N⋯N contact dataset (Fig. 2.2c) results in a histogram in which both a small shoulder corresponding to hydrogen-bonded N⋯N distances (centered at around 3.2 Å) and a large neat peak at ca. 3.7 Å are nicely distinguished.
 | ||
| Fig. 3 (a) Distribution of intermolecular N⋯O distances disregarding H-containing N and O atoms (light blue bins) and those from hydrogen-bonded NHO groups (pink bins), with also N–O bond distances shown (gray bins) as reference. (b) Intermolecular N⋯N distances disregarding H-containing N atoms (light blue bins) and those from hydrogen-bonded NHN groups (pink bins). (c) All intermolecular N⋯N contacts (light blue bins), showing overlapping peaks for H-bonded atom pairs (centered at around 3.1 Å) and for van der Waals contacts (centered around 3.9 Å). | ||
3. Methodology
Searches for intermolecular contacts were carried out in the CSD,25,32 version 5.33 with two updates, containing a total of 603![[thin space (1/6-em)]](https://www.rsc.org/images/entities/char_2009.gif) 297 structures (February 2012), and some elements with less well defined histograms were later revised including the third and fourth updates (May and August 2012), and further final checks with version 5.34 and 1 update (November 2012). The searches were limited to structures with atomic coordinates, no disorder and not polymeric. All symmetry-related atom pairs were considered in the statistic analysis. For alkaline and alkaline-earth elements, atoms with no connectivity defined (coordination number zero) were disregarded, since intramolecular contacts would in that case be retrieved as if they were intermolecular ones. Other constraints used in the searches for specific elements are indicated below in Table 1, and more details of the version of the CSD used for each element are provided in the ESI.† Histograms of the distances found were then represented and analyzed following the procedure described by Rowland and Taylor,18 to deduce the distance corresponding to the half height of the van der Waals peak. Such a distance is also the point of maximum slope of that peak, and its derivation has been shown to be more robust than alternative definitions.18 Whenever possible, the distance histogram was fitted to eqn (1) in the region around the van der Waals peak. The relevant histogram parameters and the fitting coefficients are provided in the ESI† and the corresponding curves are shown superimposed to the histograms in Fig. 4, 7 and 9. The ρvdW parameters (eqn (2)) are also given below (Table 1).
297 structures (February 2012), and some elements with less well defined histograms were later revised including the third and fourth updates (May and August 2012), and further final checks with version 5.34 and 1 update (November 2012). The searches were limited to structures with atomic coordinates, no disorder and not polymeric. All symmetry-related atom pairs were considered in the statistic analysis. For alkaline and alkaline-earth elements, atoms with no connectivity defined (coordination number zero) were disregarded, since intramolecular contacts would in that case be retrieved as if they were intermolecular ones. Other constraints used in the searches for specific elements are indicated below in Table 1, and more details of the version of the CSD used for each element are provided in the ESI.† Histograms of the distances found were then represented and analyzed following the procedure described by Rowland and Taylor,18 to deduce the distance corresponding to the half height of the van der Waals peak. Such a distance is also the point of maximum slope of that peak, and its derivation has been shown to be more robust than alternative definitions.18 Whenever possible, the distance histogram was fitted to eqn (1) in the region around the van der Waals peak. The relevant histogram parameters and the fitting coefficients are provided in the ESI† and the corresponding curves are shown superimposed to the histograms in Fig. 4, 7 and 9. The ρvdW parameters (eqn (2)) are also given below (Table 1).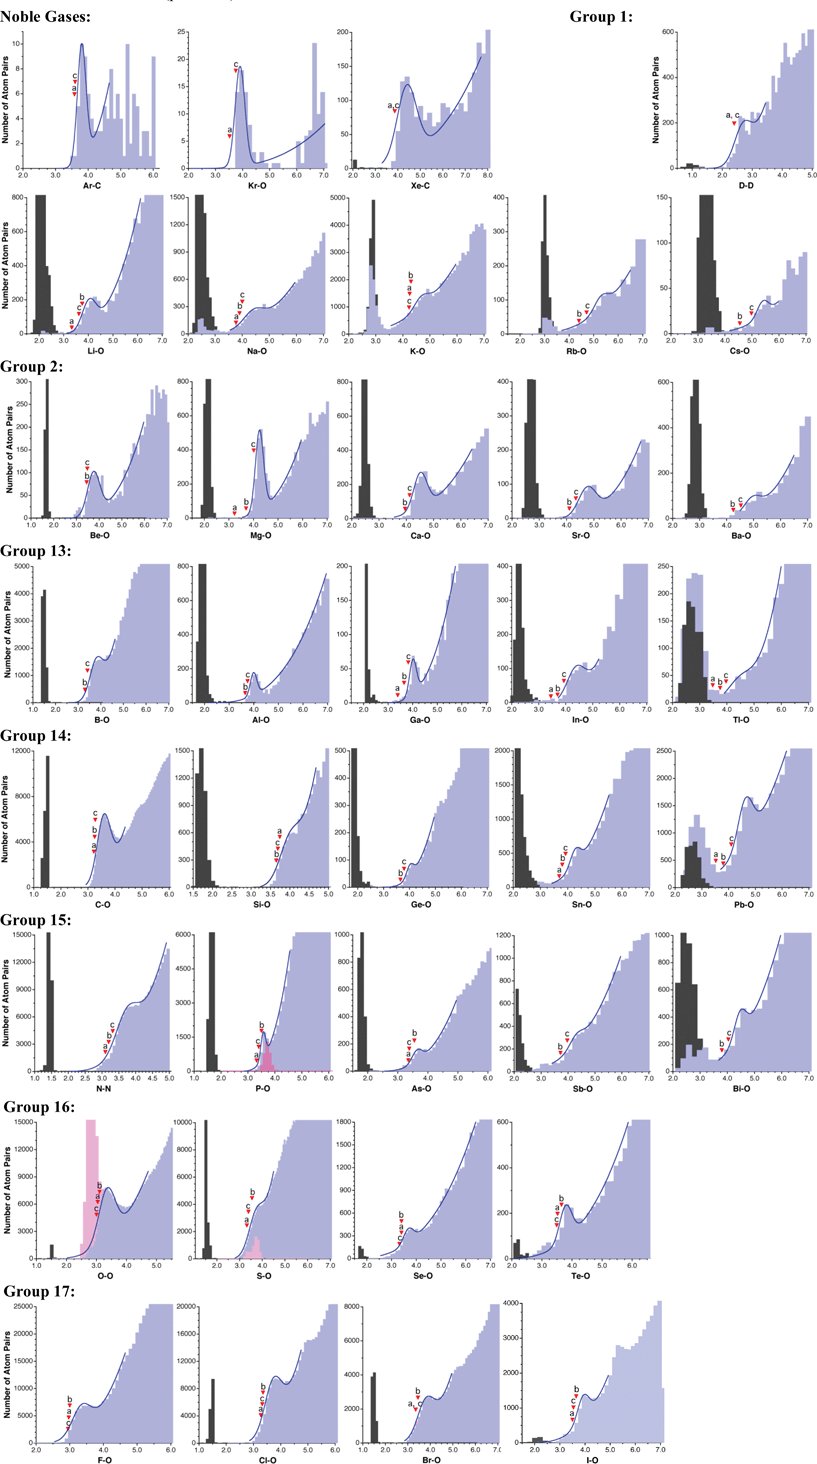 | ||
| Fig. 4 Distribution of intermolecular E⋯O contacts (light blue bins) and E–O single bond distances for elements of the s and p groups. The marks indicate (a) the sum of Bondi's radii, (b) the sum of Batsanov's radii, and (c) the sum of van der Waals radii proposed in this work. For some elements, also the distribution of the hydrogen-bonded E⋯O distances is shown (pink bins). | ||
| Z | E | Bondi | Batsanov | rvdW | ρvdW (%) | Data | Observations |
|---|---|---|---|---|---|---|---|
| 1 | H | 1.20 | 1.20 | 66 | 9888 | D⋯D, neutron diffraction, O and N excluded | |
| 2 | He | 1.40 | [1.43] | 12 | He-water clathrate | ||
| 3 | Li | 1.81 | 2.2 | 2.12 | 76 | 11![[thin space (1/6-em)]](https://www.rsc.org/images/entities/char_2009.gif) 067 067 | Zero-coordinated Li disregarded |
| 4 | Be | 1.9 | 1.98 | 90 | 3515 | ||
| 5 | B | 1.8 | 1.91 | 70 | 152![[thin space (1/6-em)]](https://www.rsc.org/images/entities/char_2009.gif) 194 194 | ||
| 6 | C | 1.70 | 1.7 | 1.77 | 82 | 385![[thin space (1/6-em)]](https://www.rsc.org/images/entities/char_2009.gif) 475 475 | Only sp3 C atoms, R ≤ 2.5% |
| 7 | N | 1.55 | 1.6 | 1.66 | 52 | 187![[thin space (1/6-em)]](https://www.rsc.org/images/entities/char_2009.gif) 967 967 | N⋯N contacts, R ≤ 3.5% |
| 8 | O | 1.52 | 1.55 | 1.50 | 73 | 420![[thin space (1/6-em)]](https://www.rsc.org/images/entities/char_2009.gif) 207 207 | OH excluded, R ≤ 3.5% |
| 9 | F | 1.47 | 1.5 | 1.46 | 66 | 497![[thin space (1/6-em)]](https://www.rsc.org/images/entities/char_2009.gif) 497 497 | OH excluded |
| 10 | Ne | 1.54 | [1.58] | 12 | Ne⋯Ne in solid Ne | ||
| 11 | Na | 2.27 | 2.4 | 2.50 | 51 | 16![[thin space (1/6-em)]](https://www.rsc.org/images/entities/char_2009.gif) 016 016 | Zero-coordinated Na disregarded, OH excluded |
| 12 | Mg | 1.73 | 2.2 | 2.51 | 92 | 11![[thin space (1/6-em)]](https://www.rsc.org/images/entities/char_2009.gif) 581 581 | Zero-coordinated Mg disregarded |
| 13 | Al | 2.1 | 2.25 | 75 | 9877 | ||
| 14 | Si | 2.22 | 2.1 | 2.19 | 55 | 15![[thin space (1/6-em)]](https://www.rsc.org/images/entities/char_2009.gif) 077 077 | |
| 15 | P | 1.80 | 1.95 | 1.90 | 67 | 178![[thin space (1/6-em)]](https://www.rsc.org/images/entities/char_2009.gif) 077 077 | OH excluded |
| 16 | S | 1.80 | 1.8 | 1.89 | 58 | 741![[thin space (1/6-em)]](https://www.rsc.org/images/entities/char_2009.gif) 158 158 | OH excluded, R ≤ 7.5% |
| 17 | Cl | 1.75 | 1.8 | 1.82 | 69 | 641![[thin space (1/6-em)]](https://www.rsc.org/images/entities/char_2009.gif) 448 448 | OH excluded, monocoordinated Cl only |
| 18 | Ar | 1.76 | 1.83 | 93 | 527 | Ar⋯C contacts | |
| 19 | K | 2.75 | 2.8 | 2.73 | 28 | 76![[thin space (1/6-em)]](https://www.rsc.org/images/entities/char_2009.gif) 013 013 | Zero-coordinated K disregarded |
| 20 | Ca | 2.4 | 2.62 | 78 | 5420 | Zero-coordinated Ca disregarded | |
| 21 | Sc | 2.3 | 2.58 | 93 | 1287 | ||
| 22 | Ti | 2.15 | 2.46 | 36 | 6685 | ||
| 23 | V | 2.05 | 2.42 | 37 | 17![[thin space (1/6-em)]](https://www.rsc.org/images/entities/char_2009.gif) 485 485 | Polyoxometallates and OH excluded | |
| 24 | Cr | 2.05 | 2.45 | 71 | 60![[thin space (1/6-em)]](https://www.rsc.org/images/entities/char_2009.gif) 314 314 | ||
| 25 | Mn | 2.05 | 2.45 | 79 | 81![[thin space (1/6-em)]](https://www.rsc.org/images/entities/char_2009.gif) 976 976 | ||
| 26 | Fe | 2.05 | 2.44 | 67 | 207![[thin space (1/6-em)]](https://www.rsc.org/images/entities/char_2009.gif) 868 868 | ||
| 27 | Co | 2.0 | 2.40 | 81 | 186![[thin space (1/6-em)]](https://www.rsc.org/images/entities/char_2009.gif) 046 046 | ||
| 28 | Ni | 1.63 | 2.0 | 2.40 | 76 | 115![[thin space (1/6-em)]](https://www.rsc.org/images/entities/char_2009.gif) 164 164 | |
| 29 | Cu | 1.40 | 2.0 | 2.38 | 75 | 42![[thin space (1/6-em)]](https://www.rsc.org/images/entities/char_2009.gif) 451 451 | Only six-coordinated Cu |
| 30 | Zn | 1.39 | 2.1 | 2.39 | 74 | 68![[thin space (1/6-em)]](https://www.rsc.org/images/entities/char_2009.gif) 186 186 | |
| 31 | Ga | 1.87 | 2.1 | 2.32 | 80 | 6066 | |
| 32 | Ge | 2.1 | 2.29 | 50 | 13![[thin space (1/6-em)]](https://www.rsc.org/images/entities/char_2009.gif) 207 207 | ||
| 33 | As | 1.85 | 2.05 | 1.88 | 54 | 22![[thin space (1/6-em)]](https://www.rsc.org/images/entities/char_2009.gif) 962 962 | OH excluded |
| 34 | Se | 1.90 | 1.9 | 1.82 | 46 | 36![[thin space (1/6-em)]](https://www.rsc.org/images/entities/char_2009.gif) 624 624 | OH excluded |
| 35 | Br | 1.83 | 1.9 | 1.86 | 68 | 172![[thin space (1/6-em)]](https://www.rsc.org/images/entities/char_2009.gif) 324 324 | Monocoordinated Br only |
| 36 | Kr | 2.02 | 2.25 | 98 | 131 | ||
| 37 | Rb | 2.9 | 3.21 | 33 | 1960 | Zero-coordinated Rb disregarded | |
| 38 | Sr | 2.55 | 2.84 | 84 | 2094 | Zero-coordinated Sr disregarded | |
| 39 | Y | 2.4 | 2.75 | 89 | 3487 | ||
| 40 | Zr | 2.3 | 2.52 | 64 | 5523 | ||
| 41 | Nb | 2.15 | 2.56 | 50 | 3647 | Polynuclear excluded | |
| 42 | Mo | 2.1 | 2.45 | 63 | 138![[thin space (1/6-em)]](https://www.rsc.org/images/entities/char_2009.gif) 249 249 | ||
| 43 | Tc | 2.05 | 2.44 | 79 | 2880 | ||
| 44 | Ru | 2.05 | 2.46 | 73 | 165![[thin space (1/6-em)]](https://www.rsc.org/images/entities/char_2009.gif) 471 471 | ||
| 45 | Rh | 2.0 | 2.44 | 54 | 34![[thin space (1/6-em)]](https://www.rsc.org/images/entities/char_2009.gif) 854 854 | ||
| 46 | Pd | 1.63 | 2.05 | 2.15 | 49 | 35![[thin space (1/6-em)]](https://www.rsc.org/images/entities/char_2009.gif) 830 830 | |
| 47 | Ag | 1.72 | 2.1 | 2.53 | 50 | 27![[thin space (1/6-em)]](https://www.rsc.org/images/entities/char_2009.gif) 221 221 | Zero-coordinated Ag disregarded |
| 48 | Cd | 1.62 | 2.2 | 2.49 | 74 | 21![[thin space (1/6-em)]](https://www.rsc.org/images/entities/char_2009.gif) 952 952 | |
| 49 | In | 1.93 | 2.2 | 2.43 | 80 | 5230 | |
| 50 | Sn | 2.17 | 2.25 | 2.42 | 44 | 30![[thin space (1/6-em)]](https://www.rsc.org/images/entities/char_2009.gif) 075 075 | |
| 51 | Sb | 2.2 | 2.47 | 26 | 15![[thin space (1/6-em)]](https://www.rsc.org/images/entities/char_2009.gif) 850 850 | Polynuclear excluded | |
| 52 | Te | 2.00 | 2.1 | 1.99 | 67 | 13![[thin space (1/6-em)]](https://www.rsc.org/images/entities/char_2009.gif) 772 772 | OH excluded |
| 53 | I | 1.98 | 2.1 | 2.04 | 53 | 56![[thin space (1/6-em)]](https://www.rsc.org/images/entities/char_2009.gif) 317 317 | Monocoordinated I only |
| 54 | Xe | 2.16 | 2.06 | 86 | 2264 | Xe⋯C contacts | |
| 55 | Cs | 3.0 | 3.48 | 46 | 775 | Zero-coordinated Cs disregarded | |
| 56 | Ba | 2.7 | 3.03 | 58 | 2402 | Zero-coordinated Ba disregarded | |
| 57 | La | 2.5 | 2.98 | 80 | 6471 | Zero-coordinated La disregarded | |
| 58 | Ce | 2.88 | 81 | 3681 | Zero-coordinated Ce disregarded | ||
| 59 | Pr | 2.92 | 78 | 3360 | |||
| 60 | Nd | 2.95 | 81 | 6346 | |||
| 62 | Sm | 2.90 | 84 | 4162 | |||
| 63 | Eu | 2.87 | 80 | 7042 | |||
| 64 | Gd | 2.83 | 84 | 6682 | |||
| 65 | Tb | 2.79 | 81 | 5538 | |||
| 66 | Dy | 2.87 | 83 | 3615 | |||
| 67 | Ho | 2.81 | 82 | 2493 | |||
| 68 | Er | 2.83 | 86 | 4246 | |||
| 69 | Tm | 2.79 | 84 | 1141 | |||
| 70 | Yb | 2.80 | 83 | 4664 | |||
| 71 | Lu | 2.74 | 86 | 2018 | |||
| 72 | Hf | 2.25 | 2.63 | 86 | 936 | ||
| 73 | Ta | 2.2 | 2.53 | 80 | 2793 | Polynuclear excluded | |
| 74 | W | 2.1 | 2.57 | 62 | 47![[thin space (1/6-em)]](https://www.rsc.org/images/entities/char_2009.gif) 936 936 | Polynuclear excluded | |
| 75 | Re | 2.05 | 2.49 | 75 | 61![[thin space (1/6-em)]](https://www.rsc.org/images/entities/char_2009.gif) 593 593 | ||
| 76 | Os | 2.0 | 2.48 | 90 | 129![[thin space (1/6-em)]](https://www.rsc.org/images/entities/char_2009.gif) 040 040 | ||
| 77 | Ir | 2.0 | 2.41 | 73 | 18![[thin space (1/6-em)]](https://www.rsc.org/images/entities/char_2009.gif) 335 335 | ||
| 78 | Pt | 1.72 | 2.05 | 2.29 | 67 | 55![[thin space (1/6-em)]](https://www.rsc.org/images/entities/char_2009.gif) 873 873 | |
| 79 | Au | 1.66 | 2.1 | 2.32 | 49 | 5132 | Only square planar Au |
| 80 | Hg | 1.70 | 2.05 | 2.45 | 81 | 30![[thin space (1/6-em)]](https://www.rsc.org/images/entities/char_2009.gif) 628 628 | Coordination number two or higher for Hg |
| 81 | Tl | 1.96 | 2.2 | 2.47 | 71 | 3486 | |
| 82 | Pb | 2.02 | 2.3 | 2.60 | 49 | 36![[thin space (1/6-em)]](https://www.rsc.org/images/entities/char_2009.gif) 781 781 | |
| 83 | Bi | 2.3 | 2.54 | 43 | 14![[thin space (1/6-em)]](https://www.rsc.org/images/entities/char_2009.gif) 030 030 | ||
| 89 | Ac | [2.8] | 33 | Ac⋯Cl contacts in AcCl3 | |||
| 90 | Th | 2.4 | 2.93 | 83 | 964 | ||
| 91 | Pa | [2.88] | 94 | 48 | Pa⋯C contacts in (NEt4)[PaOCl5] | ||
| 92 | U | 1.86 | 2.3 | 2.71 | 74 | 35![[thin space (1/6-em)]](https://www.rsc.org/images/entities/char_2009.gif) 070 070 | OH excluded |
| 93 | Np | 2.82 | 55 | 830 | OH excluded | ||
| 94 | Pu | 2.81 | 77 | 1299 | |||
| 95 | Am | 2.83 | 94 | 128 | |||
| 96 | Cm | [3.05] | 99 | 90 | |||
| 97 | Bk | [3.4] | 3 | Bk⋯Cl contacts in Cs2BkCl6 | |||
| 98 | Cf | [3.05] | 100 | 14 | Only one crystal structure | ||
| 99 | Es | [2.7] | 2 | Es⋯Cl contacts in EsCl3 |
In this work, the van der Waals radii have been deduced from intermolecular distances to oxygen atoms whenever possible. The use of oxygen as a reference has been chosen for several reasons:
(i) Oxygen is a ubiquitous element that participates in a wealth of molecules and is often present in solvation molecules (e.g., water, alcohols, ethers or ketones), in oxoanions or in crown ethers associated with cations. Oxygen atoms appear in 75% of the structural dataset explored (compare with 68% for N, 22% for Cl, 21% for S, 17% for P, or 10% for F).
(ii) Oxygen is generally mono- or dicoordinated, leaving a wide volume available for intermolecular interactions involving its lone pairs. In contrast, carbon, for instance, is most often surrounded by four substituents that sterically hinder direct van der Waals interactions.
(iii) The van der Waals radius for oxygen can be well-established from the homoatomic O⋯O contact distribution, which is coincident with the widely used value proposed earlier by Bondi.
To avoid the results being biased by the presence of hydrogen bonding, E and O atoms with bonded hydrogens were disregarded in searches for the electronegative elements most likely to present hydrogen bonding (N, P, As, O, S, Se, F, Cl and Br). For the case of sulphur, a more elaborate search was carried out to rule out those S⋯O pairs that have intervening atoms, but the resulting van der Waals radius differs only by 0.01 Å from that obtained by simply excluding SH and OH groups. Therefore, no further attempts have been made to preclude intervening atoms, since the searches become more convoluted and much slower.
For some elements for which the van der Waals peak could not be clearly identified in the E⋯O distance histogram a different probe element was chosen to define a van der Waals radius: N from N⋯N contacts, H from D⋯D contacts in neutron diffraction structures only, Ne from Ne⋯Ne contacts in solid neon, and Xe and Ar from contacts to C atoms. For He, the van der Waals radius was deduced from contacts to oxygen in only one structure, that of the water clathrate.33 For some actinides rough estimates have been obtained from contacts in only one crystal structure: Ac from contacts to Cl in AcCl3,34 Pa from contacts to C in (NEt4)[PaOCl5],35 Bk from contacts to Cl in Cs2[BkCl6],36 Cf from contacts to O in [Cf(H2O)9](CF3SO3)3,37 and Es from contacts to Cl in EsCl3.38 For the study of the C⋯O contacts, given the large amount of data available, further restrictions were applied to the structural search, limiting it to sp3 carbon atoms and to structures with an experimental R factor not larger than 2.5%. In addition, for N⋯N contacts the R factor was limited to 3.5%.
It must be stressed that the analysis presented here aims at providing a general picture of the van der Waals distances for a given element. One could be more accurate by being more restrictive in the definition of the chemical nature of a given atom. For instance, if we restrict the search for S⋯O intermolecular contacts to compounds of the type R2S and to the lone pairs hemisphere, thus disregarding steric substituent effects on the other hemisphere, the resulting histogram shows much more clearly the van der Waals peak, and the corresponding radius for sulphur would decrease from 1.89 to 1.73 Å. It is therefore important to keep in mind that, even if van der Waals radii are given here with two decimal figures for internal consistency, differences of 0.1 Å or less should not be considered to be significant.
4. Results
The histograms showing the distribution of the E⋯X intermolecular and E–X bond distances are presented in Fig. 4 (s- and p-block elements), 7 (transition metals) and 9 (f-block elements), together with the corresponding fitting to eqn (1) whenever possible. More numerical information, such as the shortest and longest distances that define the van der Waals gap (g1 and g2, see Scheme 2), and the position of the maximum for the van der Waals peak (hmax) are provided in the ESI.† I will discuss first the general aspects of the van der Waals maps obtained, and the ensuing van der Waals radii, collected in Table 1, will be discussed in the next section from a wider perspective.4.1. s and p Elements
The E⋯X intermolecular distance distributions found for the main group elements are shown in Fig. 4, where X is oxygen in all the cases except for H, N, Ar and Xe, for which contacts to H, N, C and C have been analyzed, respectively. For hydrogen, only structures with deuterium–deuterium contacts determined by neutron diffraction have been considered, but deuterium atoms bonded to O or N have been excluded to avoid the results being biased by the formation of hydrogen bonds. The resulting van der Waals radius, 1.20 Å, is coincident with that proposed by Bondi. It must be noted also that intermolecular H⋯H contacts in alkanes at twice that radius are found in the crystal structures of methane, octahedrane or dodecahedrane.39 It seems, therefore, that the value originally given by Bondi represents very well the van der Waals contacts found in crystal structures, without modifying it as proposed by Rowland and Taylor.18All alkaline elements present distributions of the E⋯O contact distances with two peaks. The short distance peaks should be attributed to chemical bonds, not always coded as such in the CSD for these elements. This can be clearly seen by comparing the histograms for E–O bond distances and for E⋯O contacts (Fig. 4). A similar situation will be found below for a few other elements.
While well-defined van der Waals peaks are found for the lighter alkaline elements (Li and Na), they appear for the heavier elements as more or less concealed shoulders in the distribution map, with low ρvdW values of 28–46%. The centers of those peaks shift from Li to Rb (from 2.5 to 5.4 Å), as expected. A distinctive feature of these elements is that none of them presents a van der Waals gap separating bonding from non-bonding distances.
The alkaline-earths present some differences with the alkalines. On the one hand, no peaks for “contacts” at bonding distances appear now, provided atoms with zero coordination number are disregarded. On the other hand, in contrast with the alkaline elements, the lighter alkaline earths present sharp van der Waals gaps, which turn into a pseudo gap for Ba. The van der Waals peaks can be clearly located in all cases (ρvdW values of 58% or higher).
The group 13 elements behave in much the same way as the alkaline-earths, with quite well-defined van der Waals maxima and the van der Waals gap becoming more diffuse as we go down the group. The short and long distance peaks come from atom pairs correctly classified as bonds and non-bonds, respectively, with the exception of Tl. This element presents a continuum of Tl⋯O distances between the bonded and van der Waals peaks, and the latter is rather small compared to the background distribution, which will result in a high uncertainty for its radius.
Among the group 14 elements, carbon is the only one with a very clear van der Waals peak, while the position of the Si peak is subject to a high uncertainty. The position of the van der Waals peak shifts gradually to longer distances as we go down this group. Clear van der Waals gaps appear only for the lighter elements C and Si, while a continuum of distances is found for Sn and Pb, while the intermediate element, Ge, presents a pseudo gap.
The behaviour of the pnicogens is similar to that of the group 14 elements, although it must be recalled that the analysis of intermolecular contacts for nitrogen has been performed on the set of N⋯N contacts, since the N⋯O ones do not show a distinct van der Waals peak and the radius for N has been deduced from the distribution of N⋯N contacts, as discussed above (Fig. 2). Only Sb displays a rather small van der Waals peak in this group, which results in a high uncertainty for the deduced radius. Chalcogens and halogens give neat van der Waals peaks. While the former follow the same trends down as previous groups, the halogens have little tendency to appear with distances within the van der Waals gap.
No statistical analysis could be carried out for the lighter noble gases (He and Ne) due to the lack of a significant structural dataset. However, a reasonable amount of data could be retrieved for Kr, Ar and Xe, although for Kr and Xe the E⋯C rather than the E⋯O distances have been analyzed. For those elements sharp van der Waals peaks can be identified in spite of the relatively small datasets available. For that reason, only tentative values of van der Waals radii will be proposed for them below.
It must be stressed that the van der Waals territory is poorly defined for the heaviest p-block elements, Tl, Pb and Bi. Maxima can be identified in the M⋯O distance distribution map with some confidence only for Bi. The analysis of M⋯X contacts for these metal atoms with other elements (X = C, N, F, Cl or S) does not reveal clear van der Waals peaks either. The fuzziness of the van der Waals region for these elements might be due to the limited number of structural data available, or to the shallowness of their van der Waals potential wells.
4.2. Transition metals
When analyzing the structural data for transition metals, special care must be taken with the early elements to disregard polyoxometallates, because they have such an accumulation of metal and oxygen atoms that one M⋯O van der Waals interaction implies the existence of several other contacts at slightly longer distances (Scheme 4) and, as a result, the number of M⋯O contacts at short distances is overestimated. This problem is illustrated for the case of W in Fig. 5, where the peak for polynuclear complexes (with four or more tungsten atoms per molecule) is shifted to short distances relative to that for mono-, di- and trinuclear compounds, resulting in a rather flat peak for the whole set of contacts when molecules with any nuclearity are included in the analysis. The price to pay for ruling out the polynuclear compounds is that we are left with smaller datasets, resulting in a poor resolution of the van der Waals peaks for Ti, V and Ta, whereas fair distance maps could be obtained for the other early transition metals. The distributions of distances from transition metals to oxygen are shown in Fig. 7. Most transition metals show distinct van der Waals peaks, with the exceptions of Ti, V, Ag, Ta and Hg. Also, most transition elements present van der Waals gaps or pseudogaps, with a few exceptions to be discussed.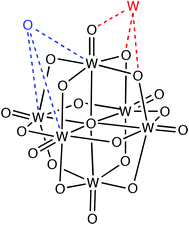 | ||
| Scheme 4 | ||
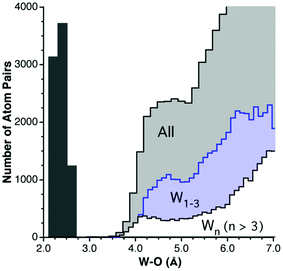 | ||
| Fig. 5 Distribution of intermolecular W⋯O distances for all tungsten complexes (light gray bins above 3.6 Å), for tungsten atoms in complexes with a nuclearity of four or higher (white bins) and for tungsten atoms in low nuclearity complexes (light blue bins). The distribution of the W–O bond distances (dark gray bins below 3.0 Å) is also shown for reference. | ||
Let us now focus on some specific cases that require further comment, starting with copper. For the analysis of the Cu⋯O distances I ruled out the large number of Jahn–Teller distorted copper(II) complexes that may appear in the CSD as four coordinate, and for which long axial Cu–O bonds might then be counted as rather short contacts. Also in the case of copper(I), the facile change in coordination number between 2 and 4 results in a number of compounds with intermediate coordination numbers,40 which might end up being counted as rather short van der Waals contacts. The distribution of all Cu–O distances, bonded and non-bonded, regardless of the copper oxidation state and coordination number, is shown in Fig. 6a. There one can recognize three peaks superimposed on the background random distribution function, from left to right: a sharp peak at 1.9 Å that incorporates bond distances for both CuI and CuII, a smaller and wider peak with a maximum around 2.4 Å corresponding to the Jahn–Teller-elongated bonds that extend all the way to the non-bonded region, and a third peak at about 4.2 Å that can be clearly attributed to van der Waals contacts. Four different types of Cu–O distances are plotted separately in Fig. 6b: CuII–O bonds, CuI–O bonds, all Cu⋯O contacts, and Cu⋯O contacts for six-coordinated copper atoms. It becomes clear that there is no cutoff distance between Jahn–Teller elongated bonds and short intermolecular contacts. Therefore, the use of an unconstrained search for Cu⋯O contacts is likely to bias the results by recovering a significant number of long bonds, leading to an underestimation of the copper van der Waals radius. The strategy adopted here consists in restricting the searches to coordinatively saturated CuII complexes or, in other words, to six-coordinated copper atoms, for which the van der Waals peak is not contaminated by weak bonds (Fig. 6b). It must be noted that the position of the van der Waals peak is quite similar in the unrestricted and restricted searches, and the differences are purely at the quantitative level, which lead to estimated half-heights of 2.31 and 2.38 Å, respectively, still within the accepted error bar of 0.1 Å. With the restriction to only six-coordinated copper atoms, a pseudogap appears between bonded and non-bonded distances.
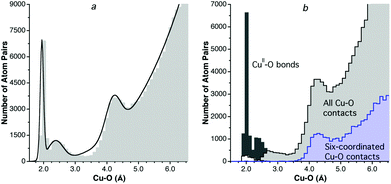 | ||
| Fig. 6 (a) Distribution of all bonded and non-bonded Cu⋯O distances in the range of 1.5–6.5 Å. (b) Distribution of CuII–O bond distances (dark gray bins), CuI–O bond distances (white bins), all intermolecular Cu⋯O distances (light gray bins), and intermolecular distances for six-coordinated Cu atoms (light blue bins). | ||
Among the 4d and 5d series (Fig. 7), four elements deserve closer inspection: Pd, Ag, Au and Hg. Let us discuss these cases in increasing order of atomic number. The Pd⋯O contact distribution shows a distinct peak surprisingly centered at a shorter distance than those of its neighbors (4.2 Å vs. 4.4, 4.5 and 5.2 Å for Ru, Rh and Ag, respectively). One may think that the coordinative unsaturation of PdII in square planar complexes is responsible for the short approach of non-bonded atoms, which is also found, e.g., for Pd⋯N contacts. For instance, the PdII ion has been found by a combination of diffraction and EXAFS techniques to be coordinated in aqueous solution by four water molecules at Pd–O distances of 2.04 Å (cf. the sum of covalent radii of 2.05 Å10), while two additional water molecules are axially semi-coordinated at distances in the range of 2.7–3.5 Å,41 consistent with crystallographic characterization of axially coordinated molecules in some square planar Pd complexes at less than 2.80 Å.42 It can also be seen that the short Pd⋯O intermolecular distances come mostly from O atoms nearly aligned with the symmetry axis of the Pd coordination plane (Fig. 8a), and that such distances increase on the average if larger angles are considered. In spite of all these caveats, a comparison of intermolecular and bonded distances reveals the existence of a wide pseudogap (Fig. 8b), and the van der Waals radius deduced for Pd, no matter how short it may seem to us, is representative of non-bonded contacts found for this metal and should not be artificially modified unless deeper theoretical and structural studies provide us with some tool to sort out other non-van der Waals interactions hidden under the peak found in the intermolecular distance distribution map.
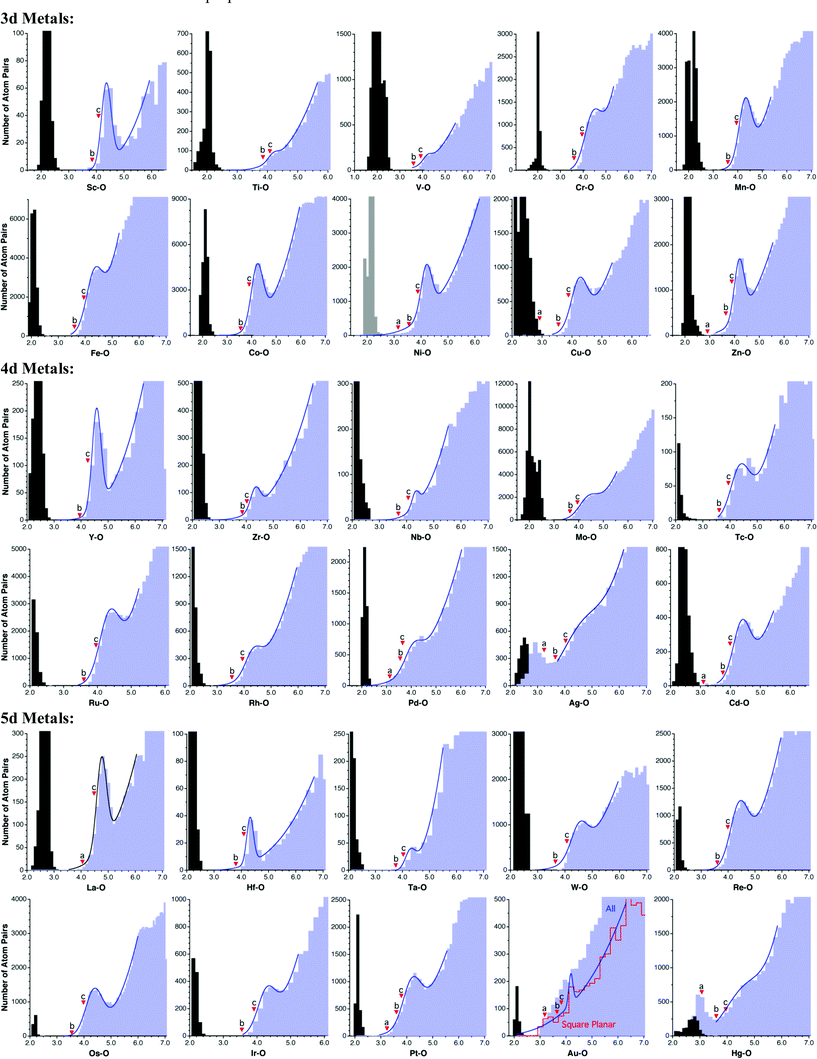 | ||
| Fig. 7 Distribution of intermolecular M⋯O contacts (light blue bins) and M–O single bond distances (gray bins) for elements of the d block. The triangular marks indicate (a) the sum of Bondi's radii, (b) the sum of Batsanov's radii, and (c) the sum of van der Waals radii proposed in this work. | ||
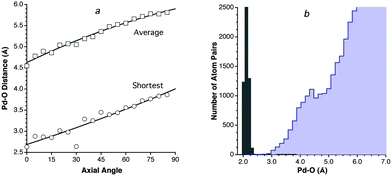 | ||
| Fig. 8 (a) Dependence of the shortest (circles) and average (squares) Pd⋯O intermolecular distances on the angle with the normal to the molecular plane at square planar Pd complexes. (b) Distribution of intermolecular Pd⋯O distances (light blue bins) and of Pd–O bond distances (gray bins). | ||
In the case of Ag, the distribution of intermolecular distances to oxygen presents a peak centered at 2.75 Å (Fig. 7) that overlaps with the peak of the Ag–O bonds, centered at 2.4 Å (to be compared to a covalent radii sum of 2.11 Å). Moreover, the absence of a gap suggests that the purported intermolecular contacts may be associated with semicoordinated groups, given the coordinative unsaturation of silver in linear and trigonal complexes, and the high energetic cost of distorting the coordination sphere to make it four coordinated.43 However, attempts to restrict the searches to four-coordinated silver atoms, which might be considered as coordinatively saturated, yield similar results, with a continuous distribution of distances between the covalent bonds and the van der Waals contacts. In spite of all this, a fair estimate of the van der Waals radius can still be made, even if with a somewhat higher uncertainty than for other elements. The fitting of the Ag–O contacts distribution to eqn (1) is consistent with a peak at shorter distance than the maximum detected in the histogram (4.5 and 5.2 Å, respectively) and suggests that the van der Waals radius deduced for Ag from the histogram may be somewhat overestimated.
Another ill-behaved transition metal is Au, for which one can hardly identify a van der Waals peak when all the gold compounds are analyzed together. As just discussed for Ag, one may think that coordinative unsaturation of di- and tricoordinated gold atoms gives rise to a variety of semi-coordination situations that prevent the identification of a neat van der Waals peak. An analysis of the structures with short “non-bonded” distances reveals that they come in most cases from oxygen atoms semicoordinated to two- or three-coordinate gold(I), or to square planar gold(III) complexes. Restricting the analysis to square planar complexes (easily sorted out from the CSD with the help of the Shape program),44 results in a sharp peak centered at 4.0 Å (Fig. 7), a slightly shorter distance than Ir and Pt (centered at 4.3 and 4.2 Å, respectively). The smaller peak at shorter distances (3.2 Å) can be unequivocally attributed, by inspection of the corresponding structures,45 to weak axial coordination of oxygen atoms.
Finally, the van der Waals peak of Hg appears as a shoulder and no van der Waals gap is observed for this element. Note that a peak of purported intermolecular contacts appears within the range of bonding distances (Fig. 7), but it disappears if the search is restricted to Hg atoms with coordination number four or higher. This indicates that those atom pairs are poorly described as di- or tricoordinated Hg with short contacts to oxygen atoms, but correspond rather to undisclosed Hg–O bonds. Nevertheless, a van der Waals peak can be reasonably identified at around 4.7 Å. The resulting van der Waals radius, 2.46 Å, is practically unaffected when the dataset is restricted to mercury atoms with coordination number four or higher and is similar to those found for other 5d metals. However, some doubts about the applicability of this parameter to other mercury-element contacts arise from the analysis of the homoatomic Hg⋯Hg contacts, an issue that will be addressed in more depth below.
4.3. Lanthanides and actinides
If we turn finally to the f-block elements (Fig. 9), we observe that each lanthanide presents a well defined van der Waals peak (ρvdW values of 78% or higher), separated by a wide gap from the Ln–O bond distances. Both the position of the van der Waals maximum and the resulting radii are nearly constant throughout the 4f series. In spite of the scarcity of structural data available for actinides, the distribution of contact distances allows for an unequivocal detection of some van der Waals peaks, with ρvdW values higher than 70% except for Np. The available datasets for Cm and Cf are the smallest ones and only tentative values of radii can be proposed from the distance distribution maps shown in Fig. 9, while with the only structure available for Bk only a poor estimate of its van der Waals radius can be deduced from Bk⋯Cl contacts. All actinides present a strict gap except for uranium that has a pseudogap.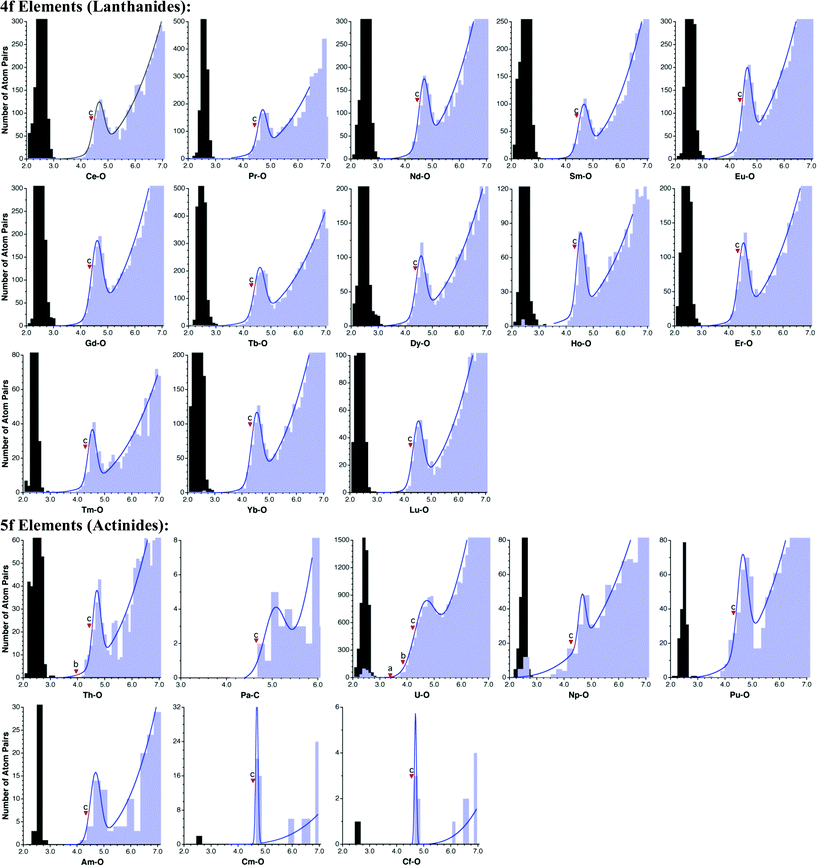 | ||
| Fig. 9 Distribution of intermolecular M⋯O contacts (light blue bins) and E–O single bond distances (gray bins) for elements of the f groups. The marks indicate (a) the sum of Bondi's radii, (b) the sum of Batsanov's radii, and (c) the sum of van der Waals radii proposed in this work. | ||
5. Discussion
The study of the element–probe distances reveals the existence of van der Waals peaks for all elements of the periodic table for which structural data is available (Fig. 4, 7 and 9). The position of that peak for each element (i.e., the hmax value) is given in Fig. 10. Remarkably, there are three different situations regarding the existence or not of a van der Waals gap separating the bonded and non-bonded distances: (i) many elements present a true gap, with no structures showing E–X distances within a given range (the longest bonded distance and the shortest contact are given in the ESI†); those elements for which only one to three atom pairs are found in the gap are included in this class; (ii) for Ar and Kr there are lower limits for the Ar⋯C and Kr⋯O contacts of 3.45 and 3.70 Å, respectively, but there being no characterized Ar–C and Kr–O bonds, we cannot strictly talk of a van der Waals gap in those cases.; (iii) a number of elements present a pseudo-gap, within which a non-negligible but statistically irrelevant number of atom pairs can be found, in such a way that an apparent gap is seen in the histograms of Fig. 4, 7 and 9; and (iv) fourteen elements (mostly alkaline elements and heavy metals at the right of the periodic table) present no gap at all, but a continuous distribution of intermolecular distances forming a valley in-between the bonded and van der Waals peaks.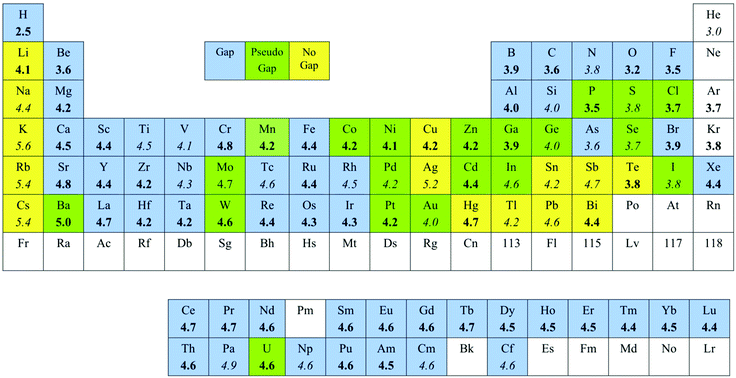 | ||
| Fig. 10 Position of the van der Waals peak (hmax) for the E⋯X contacts studied (bold face numbers indicate well defined peaks, numbers in italics indicate poorly defined peaks and larger uncertainty in their positions), and behaviour regarding the van der Waals gap: elements presenting a true gap are in light blue, those with no E–X bonds known are in white, elements that show a pseudo-gap are in green, and those without van der Waals gap are in yellow. | ||
The van der Waals radii resulting from the above structural analysis are presented in Table 1, together with those proposed earlier by Bondi and by Batsanov. The number of distances used for deducing the radius for a given element (data column in Table 1) is given to provide some indication of how representative that radius may be, although no quantitative meaning should be attached to such numbers, since a large fraction of the distances may appear beyond the van der Waals peak and thus corresponds to the random distribution background. Remember also that the fraction of non-random atom pairs at the center of the van der Waals peak deduced from the fitting of experimental data to eqn (1) (ρvdW, also given in Table 1) provides a fair indication of how clearly the van der Waals peak can be identified amidst the background of randomly distributed distances, and also some information on the relative abundance of the E⋯X contacts for the given combination of element and probe atom. The following discussion will focus first on the periodic trends of the proposed radii, comparing them with those of the covalent radii, and then a comparison with the sets of radii proposed by other authors will be presented. Finally, the proposed radii will be compared with ionic radii.
5.1. Periodic trends
A plot of the proposed van der Waals radii as a function of the atomic number reveals a periodic dependence roughly parallel to that shown by the covalent radii10 (Fig. 11). Two important differences are found in the transition metals region. One is a sharp drop of the van der Waals radii from the transition metal series to the p-block elements of the same period, which is in contrast with a smooth variation of the covalent radii. Another significant difference is that the van der Waals radii of the 3d and 4d transition elements experience lesser contraction along the period than the covalent radii, as can be appreciated by the slopes of the two curves in the 3d and 4d zones in Fig. 11. Thus, while the covalent radii decrease by nearly 0.5 Å from Sc to Zn, the contraction of the van der Waals radii is of only 0.2 Å. The 4d and 5d series present a similar behaviour, with the exception of Pd, Pt and Ag discussed above. Disregarding those three metals, all elements of groups 6 to 12 present similar van der Waals radii of about 2.4 Å in the 3d and 4d series, while the 5d metals span a wider range of values (from 2.57 Å for W to 2.28 Å for Hg). It is worth mentioning that no sign of different van der Waals regions for high- and low-spin complexes can be found in the distance distribution maps of Mn, Fe and Co (Fig. 7), in contrast with what was found earlier for the covalent radii,10 and even an attempt to separately analyze the Mn⋯O contacts of high and low spin Mn complexes classified according to the presence of long and short Mn–N distances led to van der Waals peaks centered at the same distance.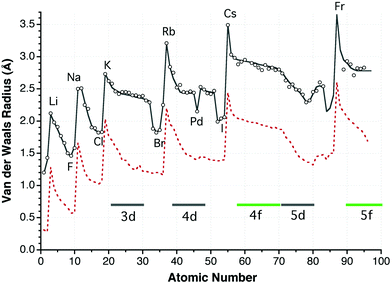 | ||
| Fig. 11 Dependence of the van der Waals radii on the atomic number (circles; the line shown is provided only as a guide to the eye), and of the covalent radii (dashed line).10 | ||
On average, each van der Waals radius is 0.9 Å longer than the corresponding covalent one, with differences ranging from 0.6 to 1.2 Å. The largest radius for each period corresponds to the alkaline element, although the radius of Mg appears to be as large as that of Na. Another difference with the periodic trends of the covalent radii is that the halogens appear to have smaller van der Waals radii than the noble gases. Again, not much significance should be attached to such an observation, since the van der Waals radii for the noble gases have been deduced from limited structural datasets in most cases, and using different probe atoms than for the halogens. The periodic trend for the heavy p-block metals (Hg, Tl, Pb and Bi) should be taken with a grain of salt, due to the large uncertainty in the values of their van der Waals radii discussed above.
If we look at the variations down the periodic main groups, we see that there is a sharp increase in the van der Waals radius from the second to the third row (up to 0.5 Å), and smaller increases (around 0.2 Å) accompany further descent down the group. A similar behaviour is found for the position of the van der Waals peaks (Fig. 10). For the transition metals, however, the van der Waals sizes vary very little down a group. This fact, together with the small variation of the radii of the 4f elements, indicates the absence of a lanthanide contraction in the van der Waals radii, in contrast with the well-known effect that appears for covalent radii.
5.2. Comparison with previous van der Waals radii sets
The radii deduced in this work are not significantly different from those proposed by Bondi16 for s- and p-block elements in most cases. By definition, the radii proposed here consistently point to the slope of the van der Waals peaks of the E⋯O contacts. Similarly, 21 of Bondi's radii for the s and p block elements also indicate a position in-between the onset of the van der Waals gap and the maximum of the peak. Four of those Bondi's radii (Li, Ga, Kr and Sn), however, are somewhat short in comparison, and the corresponding E⋯O radii sums point to the onset of the van der Waals population, while the sums for Mg and In are within the van der Waals gap and pseudogap, respectively. More troublesome are the cases of Tl and Pb, whose Bondi radii sums with oxygen point to the tail of the E–O chemical bonds region.Even if only a small number of radii were proposed by Bondi for transition metals, these appear to be in general inconsistent for describing the E⋯O contacts. Bondi's transition metal–oxygen radii sums may thus point to the onset of the van der Waals peak (Ni, Pt, Au), well into the van der Waals gap (Zn and Cd), or even to the chemical bond territory (Cu, Ag and Hg). Also Bondi's radius for U appears to be some 0.8 Å shorter than that reported here and the corresponding U–O radii sum points to the van der Waals gap. In summary, Bondi's radii set covers only 38 chemical elements (most transition elements, all lanthanides and all actinides except U are missing), appears to be inconsistent, pointing to different regions of the van der Waals territory for different elements, and presents an erratic periodic dependence. The good news is that Bondi's radii for main group elements seem to be free from those pitfalls, with the exception of some heavy elements and highly electropositive metals, and are not significantly different from those deduced here.
Batsanov's set of radii19 covers a wider portion of the periodic table than Bondi's (64 elements, with practically no lanthanides or actinides, except for Th and U); it is in general more consistent with the radii proposed in this work, and shows clearer periodic trends. However, the radii for main group elements and those for transition metals have somewhat different meanings: while the E–O radii sums for main group elements point to the slope of the van der Waals peak, those for transition metals consistently mark the onset of the peak. Some specific elements yield van der Waals sums that point to the middle of the van der Waals gap or pseudogap (Hf, Hg, Tl, Pb and Th), while for As and Te the van der Waals sums point to the peak's summit. It has been pointed out in the introduction that Batsanov's radii for all transition metals, including the 3d, 4d and 5d series, have quite similar values, a trend that is also present in the set of van der Waals radii proposed here.
The radii proposed by Truhlar et al.,23 based on a computational study, are short of providing coverage of the full periodic table, with no values given for transition metals and rare earths. Furthermore, the radii for the main group elements show wide fluctuations along the same period. It must be recalled that those radii are deduced from the calculated potential energy curves of the interaction of bare element atoms with some probes (Ne, HF and CH4), which may not be representative of the van der Waals interactions of atoms within molecules.
5.3. Comparison with ionic radii
Following the suggestion of Pauling9 that some van der Waals radii should be similar to the corresponding ionic radii, it seems interesting to compare the vdW parameters deduced here with the ionic radii proposed by Pauling and by Shannon and Prewitt.46 Since the ionic radii are highly sensitive to the oxidation state and coordination number, the comparison is carried out only with the largest ionic radius for each element, usually corresponding to the lowest oxidation state and the highest coordination number.If we disregard the van der Waals radii with high uncertainty (in italics in Table 1), it is found that the cationic radii are in most cases 1.0–1.5 Å shorter than the corresponding van der Waals radii (Fig. 12). Only for Kr is the van der Waals radii close to the cationic one (0.6 Å larger). In contrast, the anionic radii for the most electronegative elements (N, O, F, S, Cl, Se, Br, Te and Br) are all very similar to the van der Waals ones.
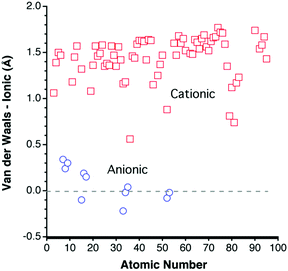 | ||
| Fig. 12 Difference of the van der Waals and ionic radii,9,46,47 represented as a function of the atomic number for cations (squares) and anions (circles). A positive value corresponds to a van der Waals radius larger than the ionic radius. | ||
5.4. Meaning and applications of van der Waals radii
We have now an operative definition of the van der Waals radii sums as the point of maximum slope of the van der Waals peak, as shown by Rowland and Taylor to be the case for the well established Bondi radii (Scheme 2). The set of van der Waals radii proposed here for most elements of the periodic table has been deduced from the E⋯X intermolecular distance distributions (X being oxygen in most cases) according to that definition. The next issue to be addressed is how can we apply those van der Waals radii to extract chemical information from experimental interatomic distances. Comparison of an E–X distance with a distance distribution map of the general type shown in Scheme 2 should allow us to classify that atom pair as pertaining to one of four possible situations (from short to long distances):(i) They form an E–X chemical bond if the distance falls within the short distance peak (i.e., dEX < g1), whose possible multiple bonding character is usually well calibrated.
(ii) They represent a secondary bond, another type of weak bonding (e.g., hydrogen bonding) or even an unusual bonding interaction if their distance falls within the van der Waals gap (i.e., g1 < dEX < g2).
(iii) They are likely to be affected by a van der Waals stabilizing interaction if the distance is within the van der Waals peak (i.e., g2 < dEX < z). An estimate of the probability of such contacts being due to a van der Waals interaction is provided by the parameter ρvdW obtained from a fitting of the distribution histogram to eqn (2) (Table 1).
(iv) E and X are essentially non-interacting atoms if the distance between them is beyond the van der Waals peak (i.e., dEX > z).
It is clear that the best way to address the analysis of the E⋯X interaction in a particular compound would be to compare its distance with the specific E–X van der Waals map. However, preparing such a map requires some expertise on structural databases and a significant effort and, consequently, we generally use the sum of the van der Waals radii to try to decide which of these bonding situations is compatible with the E–X distance without taking the pains to build a distance map. This approach, however, is tantamount to representing the whole distance distribution map by a single parameter. Although clearly a severe simplification, its application is so widespread in chemistry and crystallography, and the qualitative information it can provide is often so useful, that it is worthwhile trying to see precisely how we can use a single parameter (a van der Waals radii sum) to approximately describe the whole van der Waals territory.
All the parametric information on the van der Waals territory now at hand (Table 1 and ESI†) could be used in an approximate way to classify an E⋯X distance into one of four categories just described, by deducing some rules of thumb from a statistical analysis of all the collected parameters, as summarized in Table 2. Noting, however, that one or more of the parameters may be not well defined for some particular atom pairs, the statistics have taken into account only those parameters that are considered to be meaningful. The van der Waals radii sums determined here (dW) and the position of the maxima of the corresponding peaks (hmax) present a fair linear correlation, and therefore a reasonable guess of hmax can be made from the van der Waals radii sum. The position of the peak is expected to be on average 0.3 Å above the radii sum (80% of the 85 elements with a well-defined van der Waals map have a difference between the two parameters of less than 0.50 Å for the element-probe atom pairs chosen in this work). The position of the shortest non-bonded distance (g2) can be roughly estimated to be 0.7 Å shorter than the radii sum, and the width of the gap to be 0.6 Å. Finally, the long distance end of the van der Waals peak (z) is on average 0.4 Å above its maximum. These results can be summarized as a general semi-quantitative van der Waals map (Scheme 5), whose significant points can be roughly guessed for a particular atom pair from their radii sum dW.
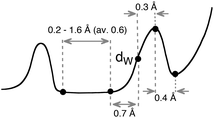 | ||
| Scheme 5 | ||
| Average | Esd | Min. | Max. | |
|---|---|---|---|---|
| Δg ( = g2 − g1) | 0.6 | 0.4 | 0.2 | 1.6 |
| dw − g2 | 0.7 | 0.3 | 0.0 | 1.4 |
| hmax − dw | 0.3 | 0.2 | 0.0 | 1.2 |
| z − hmax | 0.4 | 0.1 | 0.1 | 0.7 |
A translation of the data shown in Table 2 and Scheme 5 to the language of chemical bonding yields the following rules of thumb that should provide a semi-quantitative guide to the meaning of a given intermolecular distance between an E–X atom pair:
(a) All E–X distances comprised between 0.7 Å less and 0.7 Å more than the radii sum (dW) are likely to be within the van der Waals peak, while longer distances indicate non-interacting atoms.
(b) Distances shorter than the radii sum by more than 1.3 Å correspond most likely to a chemical bond, and those 0.7 to 1.3 Å shorter fall within the van der Waals gap, thus suggesting a special bonding situation that asks for a deeper analysis.
It is common practice to consider the van der Waals surface of a molecule as its impenetrable surface, and to assume that it is defined by the van der Waals radii of its constituent atoms. As pointed out by Dance,6 the van der Waals radius does not correspond to the shortest approach distance and the radii sum should not be used as a cutoff distance. By definition, the radii proposed here point to the leading edge of the van der Waals peak, a few tens of Ångstrom above the cutoff for intermolecular contacts. Probably some confusion exists in this respect because for some elements the radii proposed by Bondi do in fact correspond to a cutoff distance (Fig. 4: Mg, Ga, In, Tl, Sn, Pb, I, Kr, Xe Cd, La, Pd, Pt, Hg and U), while for others they are consistent with the definition adopted in this work and point somewhere in-between the onset of the van der Waals peak and its maximum. Let us consider an example that shows how some intermolecular contacts were analyzed in the past and how they can be interpreted with the semi-quantitative rules given here. In a study of the H⋯H distances in cooperative OH⋯OH⋯O hydrogen bonds, Steiner and Saenger assumed that Bondi's van der Waals radius for H of 1.20 Å “implies that in crystal structures the shortest possible non-bonding H⋯H distance is ∼2.4 Å.” Since those authors found shorter distances, they went on to propose that a more realistic van der Waals radius would be close to 1.0 Å. The definition of the van der Waals radius (Scheme 2) and a look at the D⋯D distance map (Fig. 4) and the corresponding parameters (Table 1) lead us to conclude that twice the van der Waals radius does not signal the shortest possible distance. The shortest known non-bonded D⋯D distance reported by neutron diffraction up to now is 1.719 Å in d7-L-serine,48 which is in nice agreement with the rule of thumb summarized in Scheme 5 that includes within the van der Waals region all distances 0.7 Å or less shorter than the van der Waals sum (i.e., D⋯D contacts longer than 1.7 Å). Along the same lines, it is worth insisting on the claim made by Dance6 that crystal packing analysis should not be limited to distances smaller than the van der Waals radii sum, and that the majority of van der Waals contacts are beyond that distance.
The mapping of the van der Waals territories presented in this work should facilitate a revision of the assignment of some “bonds” or “non-bonds” in the structural literature and databases, and should as well provide a more precise definition of what can and what cannot be considered to be a bond in terms of interatomic distances. A clear hint is given by the spurious peaks of supposedly intermolecular contacts coinciding with the bonded distances peak (Fig. 4, 7 and 9). It should also clarify the bonding situation of electropositive atoms, which are found in the structural databases very often as uncoordinated, notably the alkaline and alkaline earth elements, as well as Ag, La, Tl and the halogens.
The varying degree with which the van der Waals peaks stand out of the random distribution function of intermolecular distances, as indicated by the ρvdW values in Table 1, points to the existence of van der Waals bonds of varying strengths depending on the atom pair considered. In some cases, the absence of a van der Waals peak even suggests the non-existence of stabilizing van der Waals interactions between specific atom pairs. The distance distribution maps analyzed also reveal in some cases a fine structure, and in other cases significant deviation from the d3-dependence of a random distribution function at long distances, which might be worth analyzing in more detail in the future. For instance, the I⋯O map presents a second peak centered at quite a long distance of 5.3 Å, whose nature is not obvious. A similar behaviour is observed for chlorine. Also a second peak is insinuated in the maps of Cr, Mn and Os at 6.0 Å.
A paradoxical result of the analysis reported here is that the family of elements which presents a clearer distribution of the van der Waals peaks preceded by a very well defined van der Waals gap is that of the lanthanides, for which the only van der Waals radii available are those proposed recently by Hu et al.,21,22 derived from bonded rather than from non-bonded distances. In contrast, several light s and p block elements, for which radii have long been in use, have in general a less well defined van der Waals region.
Even if it is impractical to make a comprehensive survey of the degree of transferability of the proposed van der Waals radii to contacts with elements other than the ones used here as probes (mostly oxygen), one must be in principle careful not to make such extrapolations in a blind way. In order to get a few first examples of how well the position of a particular E–Y van der Waals peak can be predicted by the present set of radii, a selected sample of more than one hundred atom pairs has been analyzed and their radii sums have been compared with their distance distribution maps, provided in the ESI.†
Among the analyzed dataset (117 atom pairs), a van der Waals peak has been identified for 88% of the cases. Those datasets can further be classified according to the degree of confidence with which the peak can be determined, as very well, well and fairly characterized (44%), poorly and very poorly (38%), or of dubious (7%) characterization. For most of the 103 identified peaks (86%), the van der Waals radii sum points to its ascending slope or to its summit (i.e. the value of hmax − dW is −0.2 Å or larger). Even in those cases in which the identification of the van der Waals peak is dubious, the radii sum is a good indicator of the rudimentary distance map obtained. The atom pairs for which the van der Waals peak is found at distances significantly longer (0.3 Å or more) than the radii sum all involve one of the following heavy elements: Ag, Au, Hg, Tl, Pb and Bi. It must be noted, however, that contacts of the same heavy metals with other elements present van der Waals peaks consistent with their radii sums (ESI†). Thus, in general, a variety of atom pairs tested attest to the transferability of the van der Waals radii deduced here, including E–N, E–Cl and E–E contacts, as well as the widely studied halide-phenyl contacts.
A family that deserves a closer scrutiny is that of the homoatomic contacts involving Pd, Pt, Cu, Ag and Au. For the group 11 metals, for instance, there is a peak of intermolecular contacts centered at a quite short distance, pretty close to the bonds peak, eventually overlapping in the case of Au. Those peaks are also short of the expected van der Waals distance by 0.9 to 1.5 Å, way beyond the expected error bar of at most 0.2 Å. A reasonable interpretation is that the short distance peak corresponds to the ubiquitous metallophilic interactions presented by those elements.30 In fact, if the analysis of intermolecular Au⋯Au contacts is restricted to metal atoms with coordination number higher than three, the short distance peak disappears. For these metals, a less clear peak is insinuated at longer distances (peak B in Table 3), which is in fair agreement with the position expected for van der Waals peaks from the corresponding radii. The fact that such peaks are so weak suggests that the metallophilic interactions are predominant and leave little room for pure van der Waals interactions at longer distances. Indeed, other M⋯Element intermolecular distance distributions for M = Cu and Au do show van der Waals peaks at around the sum of the corresponding radii (ESI†), thus confirming the applicability of the radii of those metals except for the homoatomic metallophilic interactions. The singularity of the homoatomic interactions involving those metals has been confirmed by testing similar contacts for their neighbors in the periodic table – Os, Zn, Cd, Ir, In and Rh – all of which have distributions of intermolecular M⋯M contacts well represented by twice the present van der Waals radii.
| M | dcov | Bonds | Contacts | dW | |
|---|---|---|---|---|---|
| A | B | ||||
| Pd | 2.78 | 2.7 | 3.4 | 4.8 | 4.30 |
| Pt | 2.72 | 2.6 | 3.3 | 4.9 | 4.58 |
| Cu | 2.64 | 2.6 | 3.9 | 5.3 | 4.76 |
| Ag | 2.90 | 2.9 | 3.6 | 5.8 | 5.06 |
| Au | 2.72 | 2.8 | 3.2 | 4.4 | 4.64 |
An interesting case is that of the S⋯S contacts,49 which recently spurred a debate on the existence or not of sulphur–sulphur bonding in Cu3S2 clusters synthesized by Tolman and co-workers.50 The S⋯S contacts seem also to cooperate with Au⋯S and Au⋯Au interactions in determining the structural diversity of dithiocarboxylato and xanthato complexes of gold.51 The S⋯S distance distribution map (Fig. 13a) shows that twice the van der Waals radius of sulphur (3.78 Å) points near the summit, at a little longer distance than the peak's half height (3.5 Å). Following the rule of thumb proposed here, all S⋯S distances between 3.1 and 4.5 Å would be expected to fall within the van der Waals peak, in excellent agreement with the distribution histogram (double-headed arrow in Fig. 13a). Similarly, from the van der Waals sum one could expect all distances of 2.5 Å or less to correspond to S–S bonds, which is nicely consistent with both the distance distribution at short distances and the bond distance expected from the sulphur covalent radius of 1.05 Å.10 However, the van der Waals radius of sulphur leaves a no-man's land between 2.5 and 3.1 Å, the pseudogap zone in which a few structures appear (there is still a small true gap between 2.89 and 3.00 Å) and for which the existence or not of chemical bonding can hardly be decided only on the grounds of interatomic distances. The distribution of other chalcogen–chalcogen intermolecular contacts, which are important for the supramolecular assembly of a variety of organic metals52 or of tubular structures,53 agrees well with the radii sum (see ESI†).
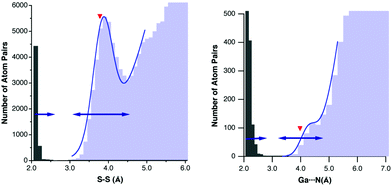 | ||
| Fig. 13 Distribution of (a) S–S and (b) Ga–N distances classified in the CSD as bonds (gray bins) and as intermolecular contacts (light blue bins), together with a fitting to eqn (1) around the van der Waals peak (solid line). The red triangles indicate the sum of the van der Waals radii proposed in this work and the arrows indicate the ranges of bonding and van der Waals distances predicted from the radii sums according to Scheme 5. | ||
Other examples that deserve comment are those of the Ga⋯N and Ga⋯Cl contacts, for which the van der Waals peak can barely be distinguished from the background of randomly distributed atom pairs. The van der Waals radii sums can help us make an educated guess on the position of the peak, as seen for the Ga⋯N case in Fig. 13b, for which fitting to eqn (1) gives a dmax value of 4.25 Å, to be compared with the radii sum of 3.98 Å and with the expected hmax value of 4.28 Å (Scheme 5).
The intermolecular Pt⋯H contacts present at first sight a continuous distance distribution, but a close-up of the short distance region reveals the existence of a small peak centered at around 2.6 Å that corresponds to the weak hydrogen bonds to platinum.54 The fact that this peak appears at distances much shorter than the van der Waals sum (3.49 Å), pretty close to that of the agostic interactions,55 clearly tells us that it corresponds to non-van der Waals interactions.
Two interesting cases are those of the homoatomic contacts of Li and Ba. In the case of Li, a maximum is found in the distribution of the purported intermolecular contacts at a much shorter distance than the twice its van der Waals radius. A detailed inspection of the structures in that region, however, reveals that they have Li atoms with no bonds defined (i.e., coordination number zero); hence the short Li⋯Li contacts are in fact intramolecular contacts between ligand-bridged atoms rather than intermolecular ones. If Li atoms with coordination numbers 0 or 1 are disregarded, the contact distance distribution is well-represented by twice its van der Waals radius. The same situation is found for Ba⋯Ba contacts, and these findings led to the systematic disregard of zero-coordinated alkaline and alkaline-earth elements in the present work.
It is especially important to test the transferability of the newly proposed van der Waals radii for lanthanides. The number of compounds of a given lanthanide having contacts to a specific element is in many cases not large, but we can consider all of them collectively, given their nearly constant van der Waals radii (taking an average value of 2.85 Å) if we disregard La. The van der Waals sums for a variety of Ln⋯X contacts (X = N, Cl, P, S, Br) have been tried, and in all cases they correctly point to the slope of the corresponding van der Waals peak (see the ESI†).
6. Conclusions
This work has presented a series of distance distribution maps for intermolecular contacts between an element E and a probe element X (oxygen in most cases). Most elements present a distinct gap in the distance distribution that allows for a clear differentiation between bonded and non-bonded atom pairs. Some elements (alkaline elements, Cu, Ag, Hg, In, Sn, Pb, Sb, Bi and Te), in contrast, present a continuous distribution of distances that prevents us from establishing a sharp borderline between bonded and non-bonded interactions based on a distance criterion. A third group of elements present van der Waals pseudogaps, within which a non-negligible but statistically irrelevant number of structures can be found.Based on the analysis of the intermolecular distances, a set of van der Waals radii for the most naturally occurring elements has been deduced. Periodic trends have been discussed, and the proposed radii have been compared to covalent and ionic radii and to previously proposed van der Waals radii. A tentative interpretation of the nature of a contact between two atoms can be made by comparison with the van der Waals radii sum, following the simple semi-quantitative rules deduced here. For instance, distances 0.7 Å shorter or longer than the radii sum are likely to correspond to van der Waals interactions, but only distances approximately 1.3 Å shorter than the radii sum can unequivocally be assigned to chemical bonds based on a distance criterion. An additional set of distance distribution maps for E⋯Y contacts has been analyzed and compared to the calculated van der Waals radii sum, showing good transferability of the radii proposed. The van der Waals radii for elements for which the available structural data do not allow to extract such information could be reasonably estimated to be 0.9 Å larger than the covalent radii. This paper presents the first complete set of van der Waals radii for lanthanides deduced from intermolecular distances, all of which present well defined van der Waals peaks in the distribution of Ln⋯O contacts and show near constant radii throughout the series, similarly to their covalent radii, but with values longer than those extrapolated from bond distances.21
The homoatomic intermolecular contacts for the coinage metals (Pd, Pt, Cu, Ag and Au) appear at much shorter distances than the van der Waals radii deduced here predict. This can be taken as an indication that those metallophilic interactions are not purely dispersive ones, in contrast to those found between those metals and main group elements such as N, Cl or P. The use of the radii deduced here from E⋯X contacts to a sample of more than one hundred different E⋯Y atom pairs provides reasonable estimates of the observed intermolecular distance maps. The exceptions are the heavy metals Hg to Bi, which give good results for some elements but poorer ones for others, as a result of the limited number of structural data available or of their little tendency to form van der Waals contacts or both.
References
- P. Hobza and K. Müller-Dethlefs, Non-covalent Interactions. Theory and Experiment, RSC Publishing, Cambridge, 2010 Search PubMed.
- G. R. Desiraju and T. Steiner, The Weak Hydrogen Bond, Oxford University Press, Oxford, 1999 Search PubMed.
- I. Dance and M. Scudder, CrystEngComm, 2009, 11, 2233 RSC.
- P. Metrangolo and G. Resnati, Chem.–Eur. J., 2001, 7, 2511 CrossRef CAS.
- A. Frontera, D. Quiñonero and P. M. Deyà, WIRE Comput. Mol. Sci., 2011, 1, 440 CrossRef CAS; A. Frontera, P. Gamez, M. Mascal, T. J. Mooibroek and J. Reedijk, Angew. Chem., Int. Ed., 2011, 50, 9564 CrossRef.
- I. Dance, New J. Chem., 2003, 27, 22 RSC.
- R. Chauvin, J. Phys. Chem., 1992, 96, 9194 CrossRef CAS.
- G. Aullón and S. Alvarez, Theor. Chem. Acc., 2009, 123, 67 CrossRef; S. Alvarez and E. Ruiz, in Supramolecular Chemistry, From Molecules to Nanomaterials, ed. J. W. Steed and P. A. Gale, John Wiley & Sons, Chichester, 2012, vol. 5, p. 1993 Search PubMed.
- L. Pauling, The Nature of the Chemical Bond, Cornell University Press, Ithaca, NY, 3rd edn, 1960 Search PubMed.
- B. Cordero, V. Gómez, A. E. Platero-Prats, M. Revés, J. Echeverría, E. Cremades, F. Barragán and S. Alvarez, Dalton Trans., 2008, 2832 RSC.
- D. M. P. Mingos and A. L. Rohl, J. Chem. Soc., Dalton Trans., 1991, 3419 RSC; A. Gavezzotti, J. Am. Chem. Soc., 1983, 105, 5220 CrossRef CAS.
- Y. L. Slovokhotov, I. S. Neretin and J. A. K. Howard, New J. Chem., 2004, 28, 967 RSC.
- J. J. Novoa, E. D'Oria and M. A. Carvajal, in Making Crystals by Design, ed. D. Braga and F. Grepioni, 2007, p. 27 Search PubMed.
- M. Fourmigué and P. Batail, Chem. Rev., 2004, 104, 5379 CrossRef CAS; A. Penicaud, K. Boubekeur, P. Batail, E. Canadell, P. Auban-Senzier and D. Jérome, J. Am. Chem. Soc., 1993, 115, 4101 CrossRef; S. Alvarez, R. Vicente and R. Hoffmann, J. Am. Chem. Soc., 1985, 107, 6253 CrossRef.
- Y.V. Zefirov and P. M. Zorkii, Russ. Chem. Rev., 1989, 58, 421 CrossRef; G. R. Desiraju, Crystal Engineering. The Design of Organic Solids, Elsevier, Amsterdam, 1989 Search PubMed.
- A. Bondi, J. Phys. Chem., 1964, 68, 441 CrossRef CAS.
- A. Bondi, J. Phys. Chem., 1966, 70, 3006 CrossRef CAS.
- R. S. Rowland and R. Taylor, J. Phys. Chem., 1996, 100, 7384 CrossRef CAS.
- S. S. Batsanov, Inorg. Mater., 2001, 37, 871 CrossRef CAS; S. S. Batsanov, Neorg. Mater., 2001, 37, 1031 Search PubMed.
- S. Nag, K. Banerjee and D. Datta, New J. Chem., 2007, 31, 832 RSC.
- S.-Z. Hu, Z.-H. Zhou and B. E. Robertson, Z. Kristallogr., 2009, 224, 375 CrossRef CAS.
- S.-Z. Hu, Z.-H. Zhou and K.-R. Tsai, Acta Phys. Chim. Sin., 2003, 19, 1073 CAS.
- M. Mantina, A. C. Chamberlin, R. Valero, C. J. Cramer and D. G. Truhlar, J. Phys. Chem. A, 2009, 113, 5806 CrossRef CAS.
- N. L. Allinger, X. Zhou and J. Bergsma, J. Mol. Struct. (THEOCHEM), 1994, 312, 69 CrossRef.
- F. H. Allen, Acta Crystallogr., Sect. B: Struct. Sci., 2002, 58, 380 CrossRef.
- J. P. M. Lommerse, A. J. Stone, R. Taylor and F. H. Allen, J. Am. Chem. Soc., 1996, 118, 3108 CrossRef CAS; S. C. Nyburg and C. H. Faerman, Acta Crystallogr., Sect. B: Struct. Sci., 1985, 41, 274 CrossRef; T. N. G. Row and R. Parthasarathy, J. Am. Chem. Soc., 1981, 103, 477 CrossRef.
- H.-B. Bürgi, in Perspectives in Coordination Chemistry, ed. A. F. Williams, C. Floriani and A. E. Meerbach, Verlag Helvetica Chimica Acta, Basel, 1992 CrossRef CAS; H.-B. Bürgi, Acta Crystallogr., Sect. A: Fundam. Crystallogr., 1998, 54, 873 CrossRef CAS; H.-B. Bürgi and J. D. Dunitz, Structure Correlations, VCH, Weinheim, 1994 CrossRef; P. Murray-Rust, H.-B. Bürgi and J. D. Dunitz, J. Am. Chem. Soc., 1975, 97, 921 CrossRef.
- T. Steiner, Angew. Chem., Int. Ed., 2002, 41, 48 CrossRef CAS.
- A. G. Orpen, Acta Crystallogr., Sect. B: Struct. Sci., 2002, 58, 398 CrossRef; J. Starbuck, N. C. Norman and A. G. Orpen, New J. Chem., 1999, 23, 969 RSC.
- M. A. Carvajal, S. Alvarez and J. J. Novoa, Chem.–Eur. J., 2004, 10, 2117 CrossRef CAS; P. Pyykkö, Chem. Rev., 1997, 97, 597 CrossRef; H. Schmidbaur and A. Schier, Chem. Soc. Rev., 2012, 41, 370 RSC.
- T. Steiner and W. Saenger, Acta Crystallogr., Sect. B: Struct. Sci., 1991, 47, 1022 CrossRef.
- I. J. Bruno, J. C. Cole, P. R. Edgington, M. Kessler, C. F. Macrae, P. McCabe, J. Pearson and R. Taylor, Acta Crystallogr., Sect. B: Struct. Sci., 2002, 58, 389 CrossRef.
- D. Londono, J. L. Finney and W. H. Kuhs, J. Chem. Phys., 1992, 97, 547 CrossRef CAS.
- W. H. Zachariasen, Acta Crystallogr., 1948, 1, 265 CrossRef CAS.
- D. Brown, C. T. Reynolds and P. T. Moseley, J. Chem. Soc., Dalton Trans., 1972, 657 Search PubMed.
- L. R. Morss and J. Fuger, Inorg. Chem., 1969, 8, 1433 CrossRef CAS.
- C. Apostolidis, et al., Angew. Chem., Int. Ed., 2010, 49, 6343 CrossRef CAS.
- D. K. Fujita and B. B. Cunningham, Inorg. Nucl. Chem. Lett., 1969, 5, 307 CrossRef CAS.
- J. Echeverría, G. Aullón, D. Danovich, S. Shaik and S. Alvarez, Nat. Chem., 2011, 3, 323 CrossRef.
- A. Ruiz-Martínez, D. Casanova and S. Alvarez, Chem.–Eur. J., 2010, 16, 6567 Search PubMed.
- D. T. Bowron, E. C. Beret, E. Martin-Zamora, A. K. Soper and E. Sánchez-Marcos, J. Am. Chem. Soc., 2012, 134, 962 CrossRef CAS.
- Q.-F. Sun, K. M.-C. Wong, L.-X. Liu, H.-P. Huang, S.-Y. Yu, V. W.-W. Yam, Y.-Z. Li, Y.-J. Pan and K.-C. Yu, Inorg. Chem., 2008, 47, 2142 CrossRef CAS; R.-F. Song, C.-Z. Zhang, F. Li, S.-C. Jin and Z.-S. Jin, Chem. Res. Chin. Univ., 1992, 8, 399 Search PubMed.
- M. A. Carvajal, S. Alvarez and J. J. Novoa, J. Am. Chem. Soc., 2004, 126, 1465 CrossRef CAS.
- M. Llunell, D. Casanova, J. Cirera, J. M. Bofill, P. Alemany, S. Alvarez, M. Pinsky and D. Avnir, SHAPE, Universitat de Barcelona and The Hebrew University of Jerusalem, Barcelona, 2003 Search PubMed.
- H. J. Keller, I. Leichert, G. Uhlmann and J. Weiss, Chem. Ber., 1977, 110, 1684 CrossRef CAS; M. S. Hussain and E. O. Schlemper, J. Chem. Soc., Dalton Trans., 1982, 751 RSC; M. S. Hussain and S. A. A. Al-Hamoud, J. Crystallogr. Spectrosc. Res., 1986, 16, 647 CrossRef; P. G. Jones, Acta Crystallogr., Sect. C: Cryst. Struct. Commun., 1984, 40, 804 CrossRef; P. G. Jones, R. Schelbach, E. Schwarzmann, C. Thone and A. Vielmader, Z. Naturforsch., B: Chem. Sci., 1988, 43, 807 Search PubMed; K. J. Kilpin, W. Henderson and B. K. Nicholson, Polyhedron, 2007, 26, 204 CrossRef; E. Kimura, Y. Kurogi, T. Kolke, M. Shionoya and Y. Iitaka, J. Coord. Chem., 1993, 28, 33 CrossRef; V. A. Afanas'eva, L. A. Glinskaya, R. F. Klevtsova, N. V. Mironov and L. A. Sheludyakova, Zh. Struct. Khim., 2007, 48, 298 Search PubMed; M. Rossignoli, P. V. Bernhardt, G. A. Lawrance and M. Maeder, J. Chem. Soc., Dalton Trans., 1997, 323 RSC; R. V. Parish, J. P. Wright and R. G. Pritchard, J. Organomet. Chem., 2000, 596, 165 CrossRef; G. Nardin, L. Randaccio, G. Annibale, G. Natile and B. Pitteri, J. Chem. Soc., Dalton Trans., 1980, 220 RSC; A. Dar, K. Moss, S. M. Cottrill, R. V. Parish, C. A. McAuliffe, R. G. Pritchard, B. Beagley and J. Sandbank, J. Chem. Soc., Dalton Trans., 1992, 1907 RSC; A. S. K. Hashmi, M. Rudolph, J. P. Weyrauch, M. Wolfle, W. Frey and J. W. Bats, Angew. Chem., Int. Ed., 2005, 44, 2798 CrossRef; V. A. Afanas'eva, L. A. Glinskaya, R. F. Klevtsova and N. V. Mironov, Koord. Khim., 2010, 36, 703 Search PubMed; V. R. Bojan, J. M. López-de-Luzuriaga, E. Manso, M. Monge and E. Olmos, Organometallics, 2011, 30, 4486 CrossRef.
- R. D. Shannon, Acta Crystallogr., Sect. A: Fundam. Crystallogr., 1976, 32, 751 CrossRef.
- J. E. Huheey, E. A. Keiter and R. L. Keiter, Inorganic Chemistry. Principles of Structure and Reactivity, Harper Collins, New York, 4th edn, 1993 Search PubMed.
- S. A. Moggach, W. G. Marshall and S. Parsons, Acta Crystallogr., Sect. B: Struct. Sci., 2006, 62, 815 Search PubMed.
- S. Alvarez, R. Hoffmann and C. Mealli, Chem.–Eur. J., 2009, 15, 8358 CrossRef CAS.
- E. C. Brown, T. J. York, W. E. Antholine, E. Ruiz, S. Alvarez and W. B. Tolman, J. Am. Chem. Soc., 2005, 127, 13752 CrossRef CAS; T. J. York, I. Bar-Nahum and W. B. Tolman, Inorg. Chem., 2007, 46, 8105 CrossRef.
- M. Reza-Azani, O. Castillo, M. L. Gallego, T. Parella, G. Aullón, O. Crespo, A. Laguna, S. Alvarez, R. Mas-Ballesté and F. Zamora, Chem.–Eur. J., 2012, 18, 9965 CrossRef.
- M. L. Mercuri, P. Deplano, L. Pilia, A. Serpe and F. Artizzu, Coord. Chem. Rev., 2010, 254, 1419 CrossRef CAS.
- R. Gleiter, D. B. Werz and B. J. Rausch, Chem.–Eur. J., 2003, 9, 2676 CrossRef CAS.
- S. Rizzato, J. Bergès, S. A. Mason, A. Albinati and J. Kozelka, Angew. Chem., Int. Ed., 2010, 49, 7440 CrossRef CAS; M. J. Calhorda, Chem. Commun., 2000, 801 RSC.
- M. Brookhart, M. L. H. Green and G. Parkin, Proc. Natl. Acad. Sci. U. S. A., 2007, 104, 6908 CrossRef CAS.
Footnotes |
| † Electronic supplementary information (ESI) available. See DOI: 10.1039/c3dt50599e |
| ‡ Dedicated to Prof. Antonio Laguna |
| This journal is © The Royal Society of Chemistry 2013 |
