 Open Access Article
Synthesis, characterization and testing of a new V2O5/Al2O3–MgO catalyst for butane dehydrogenation and limonene oxidation†
Zea Strassberger, Enrique V. Ramos-Fernandez, Agnes Boonstra, Remy Jorna, Stefania Tanase* and Gadi Rothenberg*
Van 't Hoff Institute for Molecular Sciences, University of Amsterdam, Science Park 904, 1098XH Amsterdam, The Netherlands. E-mail: s.grecea@uva.nl; g.rothenberg@uva.nl; Web: http://www.hims.uva.nl/hcsc Fax: (+)31 (0) 20 525 5604
First published on 21st February 2013
Abstract
We report the synthesis and characterization of new V2O5/Al2O3–MgO catalysts and their application in oxidative dehydrogenation and epoxidation reactions. The materials were prepared by wet impregnation under excess acid conditions. Anchoring of the desired species on the support occurs via an exchange reaction between the vanadium complex and surface hydroxyl groups. The IR and UV-Vis spectra of these catalysts indicate the presence of monomeric vanadium species at 5 wt% V2O5 loading, along with small amounts of polymeric species at 5 and 10 wt% V2O5 loadings. Electron paramagnetic resonance (EPR) spectroscopy reveals the presence of ferromagnetic VO2+ dimers following calcination at 773 K. The catalysts were then tested in two reactions, namely the gas phase oxidative dehydrogenation of n-butane under flow conditions at 773 K and the liquid phase epoxidation of limonene with H2O2. The dehydrogenation reaction gave butenes and 1,3-butadiene in moderate selectivity at 8–10% conversion. The epoxidation of limonene was less successful, giving 50–70% selectivity to the 1,2-epoxide at 10–20% conversion.
1. Introduction
Heterogeneous catalysis is somewhere between art, science and technology. The science part is more obvious to the general observer. Solid catalysts are ubiquitous in the chemical industry (over 90% by volume of all chemicals are made using heterogeneous catalysis).1–4 Despite this, and notwithstanding the many years of research into the mechanisms of reactions on surfaces, we still do not know how most catalysts actually work.5 In fact, catalyst discovery is often serendipitous.6–9In this respect, the left side of the periodic table is somewhat neglected. Most catalytic studies concentrate on the electron-rich transition metals. The reason is that many of these metals can easily switch between two relatively stable oxidation states, making them ideal active site candidates. However, there are exceptions on the basic side. Vanadium, for example, is stable as V2+, V3+, V4+, and V5+. The V5+ state is found in tetrahedral (VO4), pentahedral (VO5) and octahedral (VO6) forms and tends to form polyoxoanions. Surface V5+ sites are usually present as isolated monomeric VO4 species at low vanadium loadings. These species are often good catalysts, thanks to their accessibility and high activity.10,11
In this paper, we report the synthesis and characterization of a new type of vanadium catalyst supported on a combined acid–base support: Al2O3–MgO. The advantages of this bifunctional support are detailed elsewhere.12 We elucidate the oxidation states at the active site using electron paramagnetic resonance (EPR) and study the nanometric properties of the catalyst using a variety of surface and bulk techniques. These catalysts were then tested in two types of reactions: gas-phase oxidative dehydrogenation of n-butane under flow conditions at 773 K and liquid-phase epoxidation of limonene with H2O2.
2. Experimental section
The V2O5 precursors used were high-purity oxalic acid and ammonium metavanadate (Sigma-Aldrich; ≥99% pure). As oxide support we used Al2O3–MgO (a gift sample from Eurosupport).13 All products were identified by comparing their GC retention times to those of authentic samples. Surface area measurements were performed by the BET method using N2 at 77 K on a Thermo Scientific Surfer instrument. Samples were dried in vacuum (1.10−3 mbar) for 3 h at 200 °C prior to the measurement.Infrared spectra (4000–300 cm−1, resol. 0.5 cm−1) were recorded on a Varian 660 FTIR spectrometer equipped with a Gladi ATR device, using the reflectance technique. Ligand field spectra were obtained on a Perkin-Elmer Lambda 900 spectrophotometer using the diffuse reflectance technique and MgO as a reference. Electron paramagnetic resonance (EPR) spectra were collected on a Brucker EMXplus instrument (magnetic field calibrated with DPPH (g = 2.0036)).
GC analysis was done using an Interscience GC-8000 gas chromatograph with a 14% cyanopropylphenyl/86% dimethyl polysiloxane capillary column (Rtx-1701, 30 m; 25 mm ID; 1 μm df). Samples were diluted in 1 ml methanol. GC conditions: isotherm at 50 °C (2 min); ramp at 2 °C min−1 to 70 °C; ramp at 70 °C min−1 to 140 °C; ramp at 10 °C min−1 to 260 °C; isotherm at 260 °C (2 min).
2.1 Procedure for TPR experiments
Hydrogen TPR studies were carried out for all catalysts. Samples of ca. 50 mg were loaded into a quartz U-tube reactor and pre-treated under nitrogen flow (40 ml min−1) at 473 K for 30 min. The samples were cooled to room temperature and the gas stream was switched to 5% H2/N2 (40 ml min−1). The samples were then heated to 1000 K (heating rate 10 K min−1). Hydrogen consumption was determined quantitatively by a thermal conductivity detector (TCD). A water trap was placed before the TCD. Consequently, the TCD measures only the consumed hydrogen quantity.2.2 Procedure for catalyst synthesis
Example: V2O5-350-5 (5% V2O5 on ESM 350, catalyst A). Oxalic acid solution (0.75 g, 8.1 mmol, in 50 ml water) was added to a solution of ammonium metavanadate (0.32 g, 2.7 mmol, in 100 ml water). The mixture was stirred at 900 rpm for ca. 10 min until an orange clear solution formed. This solution was added to 5 g of ESM350 support (60![[thin space (1/6-em)]](https://www.rsc.org/images/entities/char_2009.gif) :40 Al2O3–MgO) in a 250 ml round-bottomed flask and stirred 900 rpm for 10 min at ambient temperature. The final suspension was evaporated while stirring overnight on an oil bath at 100 °C, giving a white powder. This was first dried at 120 °C for 24 h and then calcined at 500 °C for 4 h (heating rate 2 °C min−1).
:40 Al2O3–MgO) in a 250 ml round-bottomed flask and stirred 900 rpm for 10 min at ambient temperature. The final suspension was evaporated while stirring overnight on an oil bath at 100 °C, giving a white powder. This was first dried at 120 °C for 24 h and then calcined at 500 °C for 4 h (heating rate 2 °C min−1).Catalysts B and C were similarly prepared using 5.4 mmol (0.64 g) and 8.1 mmol (0.96 g) of ammonium metavanadate and equivalent amounts of oxalic acid, respectively.
2.3 Procedure for limonene epoxidation
All reactions were run in stainless steel 40 ml autoclaves. A solution of 1.2 ml (6.2 mmol) limonene, 6 ml H2O2 (35% aq.), 1.3 ml (12.4 mmol) benzonitrile and 0.025 g of the catalyst in 40 ml acetone:2-butanol (2:8) was charged in the reactor and heated to 65 °C for 6 h. Blank experiments with or without the support were performed in the same conditions. After the reaction, the reactors were cooled down to room temperature using an ice bath. Reactions were analysed by GC (anisole external standard).2.4. Procedure for n-butane oxidative dehydrogenation
The catalyst was activated in situ before reaction in a flow of 45 ml min−1 N2 and 5 ml min−1 O2 at 500 °C. The reactions were carried out at 1 atm and 500 °C in a continuous-flow fixed-bed vertical quartz reactor (4 mm i.d.), which was controlled with a fully automated system built in-house. The partial pressures of C4H10, O2 and N2 were set up at 92:92:829 mbar respectively. The ratio of catalyst mass to initial n-butane mass flow, so-called weight hourly space velocity, WHSV, was 7.7 h−1. A 3 mm quartz wool layer above the catalyst served as a preheating zone. Isothermal conditions were kept by diluting the catalyst bed with ground glass; the reaction temperature was continuously monitored by a thermocouple at the catalyst bed. Reactor effluents were analyzed on-line by using both an Interscience Compact GC equipped with a TCD detector and a Porabond Q column and a mass spectrometer. The measurement analytical repeatability was better than 0.5%.TOFs were calculated as mol of n-butane converted per hour divided by the total mol of vanadium oxide. These calculations were based on the assumption that all catalysts have a monolayer coverage of vanadium oxide. No estimation of the active site was calculated.
3. Results and discussion
3.1 Catalyst synthesis
The catalysts were prepared by wet impregnation using stoichiometric amounts of ammonium metavanadate and oxalic acid (see the Experimental section for details). The maximum amount of vanadium oxide that can form in a two-dimensional layer, e.g. monolayer coverage, depends on both the support surface area and the concentration of reactive surface hydroxyl groups.11 Therefore, we selected three different V2O5 loadings. Table 1 gives the catalyst composition and surface properties. We observed that for a good impregnation, one must use an excess of oxalic acid with respect to NH4VO3 (eqn (1)). This is because the acid acts both as a reducing agent and a complexing agent (eqn (1)).14 In these conditions, the sorption of the vanadyl complex is carried out from acidic solutions. Therefore, the surface hydroxyl groups are protonated and the support surface has a positive charge (eqn (2), where x = the number of functional groups at the oxide surface).11| NH4VO3 + 3H2C2O4 → H2[VO(C2O4)2] + 2CO2 + 2H2O + NH3 + 1/2H2 | (1) |
| S–OH + H+ → (S–OH2)+ | (2) |
| x(S–OH2)+ + [VO(C2O4)2]2− → (S–O)x[VO(C2O4)2−x] + xH2C2O4 | (3) |
| Catalysta | wt% V2O5b | V atomsc (nm2) | BET surface area (m2 g−1) | Pore volume (cm3 g−1) |
|---|---|---|---|---|
| a In all cases, the support was 40:60 Al2O3–MgO, as 5 mm extrudates.b Actual vanadium content determined by ICP.c The vanadium loading divided by the surface area of the catalyst. | ||||
| A | 4.2 | 1.5 | 217 | 0.30 |
| B | 8.9 | 4.9 | 140 | 0.36 |
| C | 12.5 | 5.2 | 190 | 0.35 |
The attachment of the desired species on the support occurs via an exchange reaction between the vanadium complex and (protonated) surface hydroxyl groups (eqn (3)). Importantly, ammonium and oxalate ions decompose fully, leaving no traces on the catalyst surface after calcination at 500 °C.15 Note that the ICP vanadium loadings are consistently lower than the nominal ones. This suggests that for a complete complexation of vanadyl species a higher excess should be used and thus the theoretical values would be reached.
3.2 Catalyst characterisation
We first investigated the catalyst surface structure by IR spectroscopy. Fig. 1 shows the spectra for the catalysts and the plain support. The intensity of the hydroxyl group stretching modes (at ca. 3000 cm−1) decreases upon addition of 5% and 10% V2O5 to the support (catalysts A and B, see Fig. S1† for details). This indicates that the anchoring of the vanadium species on the support occurs via surface OH groups (see Fig. S1 in the ESI†). The broad band between 1000 and 1100 cm−1 reflects the V![[double bond, length as m-dash]](https://www.rsc.org/images/entities/char_e001.gif) O stretch of vanadyl groups on the Al2O3 sites. These groups possess a short terminal VO bond and three bridging V–O–Al bonds.16 The weaker broad band between 850 and 900 cm−1 is characteristic of pyrovanadate (V2O74−).16 Note that the IR spectrum of the catalyst C shows two important bands at 830 cm−1 and 890 cm−1, respectively. These bands are assigned to vanadate and pyrovanadate species on the MgO surface.17–19 We suggest that the surface vanadium species are attached to the alumina sites in catalysts A and B, and to magnesia sites in catalyst C.
O stretch of vanadyl groups on the Al2O3 sites. These groups possess a short terminal VO bond and three bridging V–O–Al bonds.16 The weaker broad band between 850 and 900 cm−1 is characteristic of pyrovanadate (V2O74−).16 Note that the IR spectrum of the catalyst C shows two important bands at 830 cm−1 and 890 cm−1, respectively. These bands are assigned to vanadate and pyrovanadate species on the MgO surface.17–19 We suggest that the surface vanadium species are attached to the alumina sites in catalysts A and B, and to magnesia sites in catalyst C. | ||
| Fig. 1 IR spectra of the plain support and catalysts A–C. | ||
Both Al2O3 and MgO tend to polarize and be surface charged once suspended in an aqueous solution. However, the surface charge depends on the pH of the solution.20 If this is below the zero point charge (ZPC), the oxide surface is positively charged and will adsorb the negatively charged vanadium complex. The ZPC is higher for MgO (pH = 12.1–12.7) than for Al2O3 (pH = 7.0–9.0). Therefore, the magnesia sites are more positively charged than the alumina ones. Indeed, the pH of the solution is lower at higher vanadium loadings (see ESI† for details). The measured pH of the solutions at low loadings is higher than the ZPC. This means that the surface would be more negatively charged than the alumina site. Therefore, vanadium species bind to Al2O3 at low loadings (5% and 10%) and to MgO at high loading (15%). This is in agreement with the IR data discussed above.
The diffuse reflectance UV-visible (DRUV) spectra of the catalysts A–C show a broad band with maxima around 260 nm, 290 nm and 315 nm, due to the ligand-to-metal charge transfer (LMCT) transitions of V5+ (see Fig. 2). These bands originate from VO4 species in tetrahedral coordination.21 The spectra of B and C display a slight tail extending beyond 540 nm. This indicates the presence of small amounts of polymeric species. It also agrees with the results of Muylaert et al.,10 who reported polymeric vanadium oxides at higher V loadings. The spectra of A and B are almost identical in the UV range. We conclude that the domain size of the dispersed vanadium species remains unchanged, while the number of polymerized vanadium species increases at higher vanadium loadings.
 | ||
| Fig. 2 Diffuse reflectance UV-Vis spectra for catalysts A–C. | ||
Vanadium oxide remains as a highly dispersed amorphous monolayer phase at low loadings.22 This phase contains isolated vanadium oxide species anchored to the surface. Our support ESM350 (60:40 Al2O3–MgO) has a surface area of 175 m2 g−1, requiring 16 wt% V2O5 for monolayer coverage. The XRD patterns of catalysts A–C (see also Fig. S2 in the ESI†) after calcination at 500 °C are similar to that of the MgO–Al2O3 support. This suggests indeed that no crystalline V2O5 are present, in agreement with the IR spectra. Note that the ICP analysis shows that the vanadium loading is well below the monolayer coverage in all catalysts. BET surface areas of the calcined catalysts at 500 °C are presented in Table 1. The BET surface area for catalysts A and C is higher than that of the support. These values are highly reproducible when using the same catalyst sample or a catalyst sample coming from a different synthesis performed in identical conditions. This suggests that some pores are washed during the synthesis. B has the lowest surface area. The BET values seem to decrease with increasing vanadia loading (catalysts A and B), but strongly depend on the active species at the support surface (catalysts B and C).23
Polycrystalline vanadia can dissociate partially upon heating.24 It loses oxygen, resulting in V4+ defects. Some studies suggest that a specific reaction between the dispersed V5+ ion and the matrix occurs upon calcination at elevated temperatures. This results in the formation of V4+ even in the presence of air.25,26 Clary et al. showed that the presence of vanadyl units in octahedral surroundings occurs at coverage below monolayer.27 This is also the case for catalysts A–C. We therefore used electron paramagnetic resonance (EPR) for estimating the presence of paramagnetic surface VO2+ species.
The VO2+ ion has a d1 electronic configuration. In the presence of a magnetic field, the electron can orient parallel or antiparallel to the magnetic field vector. This leads to two energy levels with mS = ±1/2. Because the nuclear spin of V4+ is I = 7/2, a so-called hyperfine interaction between S and I can arise. This leads to a further splitting of the two electronic states into 2I + 1 sublevels. The spin Hamiltonian then takes the form:
| H = βSgB0 + SAI − gNβNIB0 | (4) |
The EPR spectra of A and B (Fig. 3 and Fig. S3–S4 in the ESI†) at room temperature display a line centered at ca. 3300 G. This indicates the presence of VO2+ sites connected by oxygen bridges, forming polymeric species. The broadening is due to the effective spin–spin exchange interactions between neighboring VO2+ centres within the structure. For the same reason, the anisotropic g and hyperfine structures (hfs) are not well resolved. The band at half-field from the forbidden ΔMS = ±2 transitions occurs at 1650 G. This indicates intramolecular ferromagnetic interactions in the exchange-coupled d1–d1 systems (VO2+–VO2+) and thus of a triplet ground state. It also indicates the presence of dimers at the catalyst surface. Lower temperatures give better hfs resolution, albeit with a slight decrease in signal intensity. At 30 K, the spectrum centered at 3300 G consists of the overlapping of low- and high-field parallel and perpendicular components.
 | ||
| Fig. 3 The X-band EPR spectra of the non-reduced catalyst B recorded at 70 and 30 K. The inset cartoon shows a possible structure of the V(O)2V dimer wherein the two VO double bonds are orthogonal, in agreement with the ferromagnetic interaction indicated by the band at half-field. | ||
A qualitative interpretation of the magnetic interactions in transition metal dimers is usually based on the interaction between pairs of natural magnetic orbitals.28 The unpaired electron in the oxovanadium(IV) unit resides in a metal-centered orbital with dxy character, with the oxo group oriented along the z-axis. The direct overlap pathway leads to an antiferromagnetic interaction when the V(O)2V or V(O)V core is planar and the V–V distance is short. In an anti-coplanar configuration, the orthogonality depends on the structural parameters of the dimer core. Moreover, the direct overlap between the two magnetic orbitals is expected to be rather small. Conversely, in a ferromagnetically coupled system the two magnetic orbitals are orthogonal. In our case such a condition favors the observed ferromagnetic interaction. This suggests that the VO2+ dimers formed at the alumina surface have either an anti-coplanar configuration, or that the vanadyl ions sit in two different geometrical surroundings.
The absorption band due to the d–d transition ion in the range 500–800 nm (Fig. 2) is absent for catalyst A and weak for B and C. This indicates that the amount of V4+ is small. Thus, UV-Vis and EPR techniques are complementary for our studies. For catalysts A and B, we performed the spectroscopic analysis for both hydrated samples and non-hydrated ones (the latter were treated at 200 °C for 4 h). However, we did not observe any change in the spectra.
3.3 Characterization of the reduced catalyst
We further used temperature programmed reduction (TPR) to investigate the reducibility of the supported vanadium oxide.29Fig. 4 shows the hydrogen TPR profiles of catalysts A–C. The profiles of pure V2O5 and the support are also shown for comparison. Pure V2O5 shows two reduction peaks at 937 K and 968 K, plus a broad peak at 1000 K. These three peaks correspond to the V5+ → V4+ → V3+ stepwise reduction,21 progressing through V2O5 → V6O13 → V2O4 → V2O3.10,21,30 Conversely, the support reduces at temperatures above 1000 K. The TPR profiles of catalysts A–C reveal an intense peak at 870 K, 885 K, and 880 K respectively. The sharpness indicates a uniform distribution of the surface vanadia species. Table 2 lists the formal average oxidation states (AOS). | ||
| Fig. 4 Temperature programmed reduction plots for catalysts A–C, using hydrogen as the reducing agent. For completeness, the TPR profile of pure V2O5 is included in the ESI (Fig. S6†). | ||
| Catalysta | Total H2 consumption (μmol gcat−1) | H2/V (mol mol−1) | AOS of Vb | Tmax (K) |
|---|---|---|---|---|
| The formal average oxidation state of vanadium upon reduction was estimated assuming that the reduction of V5+ to V4+ corresponds to a consumption of 0.5 H2/V.a In all cases, the support was 40:60 Al2O3–MgO, as 5 mm extrudates.b Average oxidation state of vanadium. | ||||
| A | 576 | 1.04 | 2.9 | 870 |
| B | 1263 | 1.14 | 2.7 | 885 |
| C | 1801 | 1.09 | 2.8 | 880 |
Using EPR, we gained further information about the nature of the reduced vanadium species. Catalysts A and B were reduced in hydrogen using the same conditions employed for TPR studies. The reduced A does not show EPR in ambient conditions. Fig. 5 shows the EPR spectra of reduced A and B recorded at 70 K and 298 K, respectively. These indicate the presence of V4+ ions. In both cases, the unpaired electron associated with V4+ (d1) interacts with the nuclear magnetic moment of 51V (I = 7/2) to give a complicated hyperfine structure. For A, the absence of the EPR spectrum at 298 K indicates the presence of V4+ in an axial ligand field. This may arise from a distorted octahedron or tetrahedron of oxygen ions surrounding a V4+ ion. In both octahedral and tetrahedral ligand fields, V4+(d1) has excited states close to the ground state, giving short spin–lattice relaxation times. Therefore, the EPR spectra are not detectable at room temperature. A tetragonal distortion of V4+ in B may be responsible for the EPR activity at 298 K. The perpendicular components of the EPR spectrum indicate the presence of two chemically distinct V4+ species. This may arise from a different interaction of the V4+ with the surface oxygen atoms of Al2O3 support. We suggest that the V4+ is stabilized on alumina by removing oxygen from the V–O–V linkage in a dimeric surface vanadia species. After exposure to air, reduced catalyst A is EPR active at 298 K (see Fig. S5 in the ESI†) while the spectrum of reduced B remains unchanged. All these spectra are complex and can be interpreted as a superposition of at least two signals. Both EPR and TPR data strongly indicate the coexistence of different surface vanadium species.
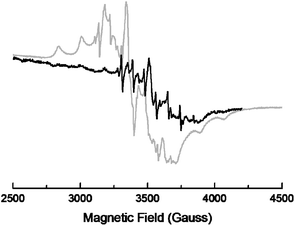 | ||
| Fig. 5 EPR spectra of the reduced catalysts A at 70 K (grey line) and B at 298 K (black line). | ||
3.4 Catalytic dehydrogenation of n-butane
Following the characterization studies, we tested catalysts A–C in the oxidative dehydrogenation of n-butane (see the results in Fig. 6). The n-butane conversion for catalysts A, B and C are 3.8, 7.9 and 4.7% respectively. There is no straight correlation between the conversion values and the loadings. This is due to the different types of vanadium species. To make this comparison loading independent, we represented in Fig. 6 the TOF for all the catalysts. Samples A and B perform similarly in terms of TOF. However, catalyst C has a significant lower activity than catalyst B. This concurs with our characterization studies. The vanadium species are placed on top of the alumina sites for catalysts A and B whilst they are located on the magnesia site in catalyst C. The lower TOF value for catalyst C can be explained taking into account two different factors: (a) for catalyst C the metal loading is close to the theoretical limit to form a monolayer. This suggests that not all the vanadium atoms are available for reaction and hence the TOF is underestimated and (b) V atoms which are in close proximity to MgO (or even forming vanadate) have less intrinsic activity due to the weaker adsorption of the hydrocarbon in this system.31,32 The highest selectivity for ODH products was achieved with catalyst C, which has the highest vanadium content. The difference in butenes and butadienes selectivity is mainly related to CO2 formation. Similar results were reported previously.33,34 It is well known that the incipient carbonaceous species formed in ODH reactions are rapidly oxidized to CO and CO2 in the presence of vanadium-based catalysts.33,34 Accordingly, deactivation by coke formation does not occur in our conditions. | ||
| Fig. 6 Product distribution (columns) and TOF (dots) using different catalysts in the dehydrogenation of n-butane. Reactions were run in a flow reactor at 500 °C and 1 atm pressure. | ||
Generally, high selectivity is obtained for highly dispersed isolated and polymerized species in close proximity to the basic sites (magnesia).35 Note that coke formation was not found, and the conversion and selectivities were stable for at least 24 h on stream.
3.5 Catalytic epoxidation of limonene with hydrogen peroxide
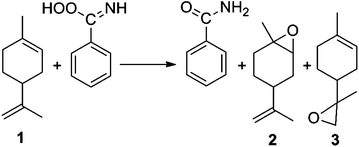
We also tested catalysts B and C in the epoxidation of (R)-limonene using hydrogen peroxide as an oxidant (eqn (5)). | (5) |
These liquid-phase reactions were run in stainless steel autoclaves, using methanol as the solvent at 65 °C. Product yields were monitored by GC. The main product was the (R)-1,2-epoxide 2, with some epoxidation of the exocyclic double bond, giving the (R)-8,9-epoxide 3. Additionally, we observed small amounts of the epoxide hydrolysis product, (1S,2S,4R)-limonene-1,2-diol, as well as traces of other diols, carvone, and carveol.36–38 These minor by-products were quantified together and denoted as “Others” in Table 3. To avoid any effect of hydrogen peroxide concentration changes on the reaction rate, an 8:1 H2O2–limonene molar excess was used.39
| Entry | Catalyst | Conversiona (%) | Selectivitya (%) | ||
|---|---|---|---|---|---|
| 1,2-Limonene oxide 2 | 8,9-Limonene oxide 3 | Others | |||
| Reaction conditions: 1.2 ml (6.2 mmol) limonene 1, 6.0 ml H2O2 (molar ratio 8:1 H2O2:limonene), 1.3 ml (12.4 mmol) benzonitrile; 0.025 g catalyst; 40 ml acetone:2-butanol (ratio 2:8), 65 °C, 6 h.a Quantitative GC-analysis using an external standard (anisole) calibration.b Blank experiment (no catalyst or benzonitrile).c Blank experiment, no catalyst.d Al2O3–MgO (40%–60%). | |||||
| 1 | Noneb | 1.7 | 43.9 | 45.8 | 10.3 |
| 2 | Nonec | 4 | 51.3 | 37.9 | 10.8 |
| 3 | Support onlyd | 8.5 | 55.5 | 36.8 | 7.8 |
| 4 | B | 13.7 | 69.3 | 26.4 | 4.3 |
| 5 | C | 18.3 | 74.4 | 20.1 | 5.5 |
In agreement with the results of Aramendia et al.,40 we observed that the presence of benzonitrile is a must for the reaction to proceed. A possible pathway for this reaction is described by eqn (6) and (7). In the first step, the catalytic reaction of benzonitrile and hydrogen peroxide gives a peroxycarboximidic acid. Subsequently, one oxygen atom of the acid is inserted in the olefin, giving the corresponding amide and the epoxide. Indeed, we identified the amide formation. A series of control experiments showed that benzonitrile is essential. Our studies show that the selectivity towards the epoxide 2 increases when V2O5 is added on the Al2O3–MgO surface. This suggests that the limonene oxidation takes place on both the support and on the vanadium site.
 | (6) |
 | (7) |
The main oxidation products are the epoxides 2 and 3. In the aqueous medium they can easily hydrolyse to the corresponding diols. However, only traces of limonene glycol were observed. We believe that this is due to the basic character of the support and the catalysts. Limonene glycol is likely to form by acid catalysed hydration of limonene oxide. In fact, limonene epoxidation catalysed by V2O5 on acidic supports gives polymers as the main reaction products.41 For catalyst B, vanadia is supported on the alumina sites and it has a high dispersion. Alumina has surface Lewis acid sites with high relative strength. A decrease of the Lewis acidic sites occurs when vanadia is highly dispersed. This is because the former aluminium uncoordinated cations will bind VOx units. Therefore, the free basic sites of the magnesia prevent the formation of limonene glycol in this case.
We also tested our reaction conditions for catalyst leaching. Leaching tests were performed in duplicate experiments using catalyst B. First, we ran our reactions under standard conditions (see the Experimental part) for 1 h with catalyst B. Then, we stopped the reaction, filtered out the catalyst and re-started the reaction without the catalyst. Three samples were collected in total: the first sample after 1 h with the catalyst, the second one after 3 h reaction without the catalyst and the third sampling at the end of the 6 h reaction, always without the catalyst. The first sampling, with the catalyst in the reaction mixture, reached a 4.5% conversion. The second sampling, after filtration of the catalyst, showed an increase of conversion up to 7.3%. The same conversion was measured at the end of the 6 h reaction (see Fig. S7 in the ESI†).
Sheldon and Arends42 formulated the question of leaching in three scenarios: (i) the metal does not leach and the observed catalysis is truly heterogeneous; (ii) the metal does leach but is not an active catalyst; the observed catalysis is (predominantly) heterogeneous; (iii) the metal leaches to form a (highly active) homogeneous catalyst; the observed catalysis is homogeneous. We observe only 3% improvement of the conversion, which is comparable to the background result using a bare support. Therefore, our system resembles mainly the second case,42 where some metal ions leach but the catalyst is predominantly heterogeneous.
3 Conclusions
Supporting vanadium oxide on a bifunctional acid/base support such as alumina–magnesia gives promising catalysts that can be used for oxidative dehydrogenation. At 500 °C and 1 atm pressure, the conversion and selectivity were stable over 24 h without coke formation. These catalysts are also useful, albeit to a lesser extent, for liquid-phase ring-epoxidation. Using IR, UV-Vis and EPR spectroscopy we identified the surface structure of V2O5 supported on Al2O3–MgO. Our results indicate the presence of both monomeric and dimeric species at the alumina surface. Importantly, EPR studies reveal a ferromagnetic coupling of the individual magnetic moments of the V4+ ions within the surface dimer species. Both TPR and EPR of the reduced catalysts indicate the coexistence of different surface vanadium species.Funding sources
This research has been performed within the framework of the CatchBio program. The authors gratefully acknowledge the support of the Smart Mix Program of the Netherlands Ministry of Economic Affairs and the Netherlands Ministry of Education, Culture and Science.Acknowledgements
We thank Prof. E. Bouwman (UL) for access to the UV-Vis, EPR and XRD facilities and Dr M. C. Mittelmeijer-Hazeleger (UvA) for technical support.Notes and references
- S. Dasgupta and B. Torok, Curr. Org. Synth., 2008, 5, 321–342 CrossRef CAS.
- D. R. Modeshia and R. I. Walton, Chem. Soc. Rev., 2010, 39, 4303–4325 RSC.
- G. Rothenberg, Catalysis: Concepts and Green Applications, Wiley-VCH, Weinheim, 2008 Search PubMed.
- A. Goifman, J. Gun, V. Gitis, A. Kamyshny, O. Lev, J. Donner, H. Bornick and E. Worch, Appl. Catal., B, 2004, 54, 225–235 CrossRef CAS.
- G. Rothenberg, Catal. Today, 2008, 137, 2–10 CrossRef CAS.
- G. Gasparini, M. Dal Molin and L. J. Prins, Eur. J. Org. Chem., 2010, 2429–2440 CrossRef CAS.
- G. J. Hutchings, J. Mater. Chem., 2009, 19, 1222–1235 RSC.
- B. R. James and F. Lorenzini, Coord. Chem. Rev., 2010, 254, 420–430 CrossRef CAS.
- N. R. Shiju and V. V. Guliants, Appl. Catal., A, 2009, 356, 1–17 CrossRef CAS.
- I. Muylaert and P. Van Der Voort, Phys. Chem. Chem. Phys., 2009, 11, 2826–2832 RSC.
- B. M. Weckhuysen and D. E. Keller, Catal. Today, 2003, 78, 25–46 CrossRef CAS.
- Z. Strassberger, S. Tanase and G. Rothenberg, Eur. J. Org. Chem., 2011, 5246–5249 CrossRef CAS.
- http://www.eurosupport.nl.
- E. P. Reddy and R. S. Varma, J. Catal., 2004, 221, 93–105 CrossRef CAS.
- D. Tibiletti, E. A. de Graaf, S. P. Teh, G. Rothenberg, D. Farrusseng and C. Mirodatos, J. Catal., 2004, 225, 489–497 CrossRef CAS.
- M. A. Vuurman, D. J. Stufkens, A. Oskam, G. Deo and I. E. Wachs, J. Chem. Soc., Faraday Trans., 1996, 92, 3259–3265 RSC.
- G. Busca, Mater. Chem. Phys., 1988, 19, 157–165 CrossRef CAS.
- Note that IR bands of surface metal oxide species below 800 cm−1 could not be detected because they are obscured by strong absorption of the MgO–Al2O3 support.
- N. R. Shiju, M. Anilkumar, S. P. Gokhale, B. S. Rao and C. V. V. Satyanarayana, Catal. Sci. Technol., 2011, 1, 1262–1270 CAS.
- F. Pinna, Catal. Today, 1998, 41, 129–137 CrossRef CAS.
- A. E. Lewandowska, M. A. Banares, D. F. Khabibulin and O. B. Lapina, J. Phys. Chem. C, 2009, 113, 20648–20656 CAS.
- K. V. R. Chary and G. Kishan, J. Phys. Chem., 1995, 99, 14424–14429 CrossRef CAS.
- G. T. Went, S. T. Oyama and A. T. Bell, J. Phys. Chem., 1990, 94, 4240–4246 CrossRef CAS.
- G. Centi, E. Giamello, D. Pinelli and F. Trifiro, J. Catal., 1991, 130, 220–237 CrossRef CAS.
- A. Adamski, Z. Sojka, K. Dyrek and M. Che, Solid State Ionics, 1999, 117, 113–122 CrossRef CAS.
- A. Adamski, Z. Sojka, K. Dyrek, M. Che, G. Wendt and S. Albrecht, Langmuir, 1999, 15, 5733–5741 CrossRef CAS.
- K. V. R. Chary, T. Bhaskar, J. J. Maheshwar, K. Ramesh and V. V. Rao, Appl. Catal., A, 2000, 202, 133–139 CrossRef CAS.
- A. P. Ginsberg, Inorg. Chim. Acta, Rev., 1971, 5, 45–68 CrossRef CAS.
- J. Beckers and G. Rothenberg, Dalton Trans., 2008, 6573–6578 RSC.
- N. R. Shiju, M. Anilkumar, S. P. Mirajkar, C. S. Gopinath, B. S. Rao and C. V. Satyanarayana, J. Catal., 2005, 230, 484–492 CrossRef CAS.
- J. M. López Nieto, J. Soler, P. Concepción, J. Herguido, M. Menéndez and J. Santamarìa, J. Catal., 1999, 185, 324–332 CrossRef.
- T. Blasco, J. M. L. Nieto, A. Dejoz and M. I. Vazquez, J. Catal., 1995, 157, 271–282 CrossRef CAS.
- J. Soler, J. M. López Nieto, J. Herguido, M. Menéndez and J. Santamaría, Catal. Lett., 1998, 50, 25–30 CrossRef CAS.
- J. M. L. p. Nieto, Top. Catal., 2006, 41, 3–15 CrossRef.
- N. Steinfeldt, D. Müller and H. Berndt, Appl. Catal., A, 2004, 272, 201–213 CrossRef CAS.
- M. V. Cagnoli, S. G. Casuscelli, A. M. Alvarez, J. F. Bengoa, N. G. Gallegos, N. M. Samaniego, M. E. Crivello, G. E. Ghione, C. F. Pérez, E. R. Herrero and S. G. Marchetti, Appl. Catal., A, 2005, 287, 227–235 CrossRef CAS.
- M. J. da Silva, P. Robles-Dutenhefner, L. Menini and E. V. Gusevskaya, J. Mol. Catal. A: Chem., 2003, 201, 71–77 CrossRef CAS.
- N. K. Kala Raj, V. G. Puranik, C. Gopinathan and A. V. Ramaswamy, Appl. Catal., A, 2003, 256, 265–273 CrossRef.
- G. Rothenberg and J. H. Clark, Org. Process Res. Dev., 2000, 4, 270–274 CrossRef CAS.
- M. A. Aramendía, V. Borau, C. Jiménez, J. M. Luque, J. M. Marinas, J. R. Ruiz and F. J. Urbano, Appl. Catal., A, 2001, 216, 257–265 CrossRef.
- P. Oliveira, M. L. Rojas-Cervantes, A. M. Ramos, I. M. Fonseca, A. M. B. do Rego and J. Vital, Catal. Today, 2006, 118, 307–314 CrossRef CAS.
- I. W. C. E. Arends and R. A. Sheldon, Appl. Catal., A, 2001, 212, 175–187 CrossRef CAS.
Footnote |
| † Electronic supplementary information (ESI) available. See DOI: 10.1039/c3dt32954b |
| This journal is © The Royal Society of Chemistry 2013 |