 Open Access Article
New insight into the role of a base in the mechanism of imine transfer hydrogenation on a Ru(II) half-sandwich complex†
Marek Kuzma*a, Jiří Václavíkb, Petr Nováka, Jan Přechb, Jakub Januščákb, Jaroslav Červenýa, Jan Pecháčekb, Petr Šotb, Beáta Vilhanováb, Václav Matoušekb, Iryna I. Goncharovac, Marie Urbanovád and Petr Kačerb
aLaboratory of Molecular Structure Characterization, Institute of Microbiology, v.v.i., Academy of Sciences of the Czech Republic, Vídeňská 1083, 142 20, Prague 4, Czech Republic. E-mail: kuzma@biomed.cas.cz
bDepartment of Organic Technology, Institute of Chemical Technology, Technická 5, 166 28, Prague 6, Czech Republic
cDepartment of Analytical Chemistry, ICT Prague, Czech Republic
dDepartment of Physics and Measurements, ICT Prague, Czech Republic
First published on 24th January 2013
Abstract
Asymmetric transfer hydrogenation (ATH) of cyclic imines using [RuCl(η6-p-cymene)TsDPEN] (TsDPEN = N-tosyl-1,2-diphenylethylenediamine) was tested with various aliphatic (secondary, tertiary) and aromatic amines employed in the HCOOH–base hydrogen donor mixture. Significant differences in reaction rates and stereoselectivity were observed, which pointed to the fact that the role of the base in the overall mechanism could be more significant than generally accepted. The hydrogenation mixture was studied by nuclear magnetic resonance (NMR), Fourier transform ion cyclotron resonance mass spectrometry (FT-ICR MS) and vibrational circular dichroism (VCD) with infrared spectroscopy. The results suggested that the protonated base formed an associate with the active ruthenium-hydride species, most probably via a hydrogen bond with the sulfonyl group of the complex. It is assumed that the steric and electronic differences among the bases were responsible for the results of the initial ATH experiments.
Introduction
Enantiomerically pure compounds are of vital importance for a broad range of life sciences and fine chemical products, particularly for pharmaceuticals and agrochemicals. For the manufacture of chiral compounds starting from achiral precursors, enantioselective catalysis has become a valuable and versatile synthetic route.Catalytic enantioselective synthesis is according to Rouhi1 one of the most important synthetic methods for the production of chiral compounds. One of those methods, catalytic asymmetric hydrogenation, plays an outstanding role both on a laboratory and an industrial scale.2 Enantioselective hydrogenation of the C![[double bond, length as m-dash]](https://www.rsc.org/images/entities/char_e001.gif) C double bond has historically attracted the most interest.
C double bond has historically attracted the most interest.
Nowadays, the asymmetric hydrogenation of ketones and imines plays comparably an important role from the practical point of view. The reduction can be conducted either by gaseous hydrogen (asymmetric hydrogenation, AH), or by hydrogen obtained in situ from an organic molecule, such as propan-2-ol or formic acid, which is present in the reaction mixture (asymmetric transfer hydrogenation, ATH). The AH of functionalized ketones is typically carried out with the organometallic complexes of rhodium and ruthenium bearing diphosphine ligands.3 Unfunctionalized ketones are efficiently reduced over ruthenium-diphosphine/β-diamine complexes.4 For ATH, several active ruthenium-arene, iridium-Cp and rhodium-Cp (Cp = cyclopentadienyl) complexes based on β-diamines and β-amino alcohols have been described.5
There are a variety of mechanisms through which catalytic hydrogenation employing transition metals can operate.6 ATH using [RuCl(η6-p-cymene)TsDPEN] (TsDPEN = N-tosyl-1,2-diphenylethylenediamine) (1 in Scheme 1) with HCOOH requires the presence of a base such as t-BuOK or triethylamine (TEA), which serves as an acceptor of HCl from 1.7 A 16 e− unsaturated complex (3)8 is formed, which can be in situ protonated and form a solvate (4).9 In the presence of HCOOH, ruthenium hydride 2 is formed.8,10 This species is capable of reducing prochiral ketones or imines (such as dihydroisoquinolines, DHIQs) to optically enriched alcohols or amines (tetrahydroisoquinolines, THIQs). The outcome is complex 4 (in an equilibrium with 3), which is converted back to species 2 by reacting with the formate anion.
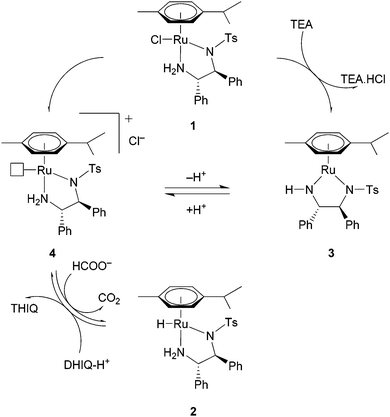 | ||
| Scheme 1 Suggested catalytic cycle for the ATH of a protonated dihydroisoquinoline (DHIQ-H+) using catalyst 1. | ||
In the ATH of ketones it has been shown that selection of the base can affect the reaction's enantioselectivity.11 However, no mechanistic rationale was proposed and research in this direction has been rather limited. The presented work is focused on the influence of a base on the ATH of cyclic imines and is complemented with a mechanistic study.
Results and discussion
Kinetic experiments
We started our investigation by the ATH of (R)-1,4-dimethyl-3,4-dihydroisoquinoline ((R)-5) followed in situ by NMR. Diastereomeric products formed during the reaction were readily distinguishable by 1H NMR. Several bases were tested in combination with HCOOH as a hydrogen source and the results are summarized in Table 1.
| |||||||
|---|---|---|---|---|---|---|---|
| Amine type | Amine | pKa1 | Substrate (R)-5 | Substrate 6 | |||
| ka | deb [%] | ka | eec [%] | ||||
| a Zero order rate constants relative to TEA. From the time-conversion plot, the linear region was used for the least squares linear regression analysis to determine the k values.b Diastereomeric excess, determined by NMR.c Enantiomeric excess, determined by GC after pre-column derivatization.d Triethylamine.e N,N-Diisopropyl(ethyl)amine.f 1,4-Diazabicyclo[2.2.2]octane.g The amount of the product was too low to determine ee. | |||||||
| Tertiary | TEAd |  | 10.8 | 1.0000 | 55.5 | 1.0000 | 83.9 |
| DIPEAe |  | 11.4 | 0.2442 | 46.1 | 1.1650 | 84.0 | |
| DABCOf |  | 8.7 | 0.2335 | 63.8 | 0.4932 | 82.7 | |
| Secondary | Morpholine |  | 8.3 | 0.2144 | 65.6 | 0.1156 | 78.9 |
| Piperidine |  | 11.0 | 0.2059 | 65.1 | 0.2383 | 82.1 | |
| Pyrrolidine |  | 11.2 | 0.0594 | 71.5 | 0.2726 | 79.2 | |
| Aromatic | Pyrrole |  | 0 | 0.1423 | 65.5 | 0 | — |
| Imidazole |  | 7.0 | 0.0042 | 0 | 0 | — | |
| Pyridine |  | 5.2 | 0.0064 | 69.3 | 0.0006 | n.d.g | |
Substantially different reaction rates were observed with various bases. The highest was for tertiary amines, i.e. TEA, N,N-diisopropyl(ethyl)amine (DIPEA) and 1,4-diazabicyclo[2.2.2]octane (DABCO). In the case of TEA, the rate was over four times higher than in the trial with DIPEA. Secondary amines (morpholine, piperidine and pyrrolidine) performed with even lower rates. The rate was surprisingly high for pyrrole (an aromatic heterocycle) when compared to pyrrolidine because the rates obtained with other aromatic bases (imidazole and pyridine) were very low.
Selection of a base also distinctively affected the asymmetric bias of the reaction. The lowest diastereomeric excess (de) was observed for DIPEA, followed by TEA and DABCO. Secondary amines (piperidine, morpholine and pyrrole) performed with around 65% de and the highest value was obtained for pyrrolidine, which is one of the smallest molecules in the set. The diastereoselectivity was also within the range of 65–70% de for aromatic bases (pyrrole, pyridine), but the use of imidazole showed zero selectivity. Based on these results, we assumed that the differences in diastereoselectivity were related to the steric requirements of the bases applied.
A similar experiment was conducted with 1-methyl-3,4-dihydroisoquinoline (6). The differences in reaction rates were very significant and also followed the groups of tertiary, secondary and aromatic bases. However, in this case the rate with DIPEA was slightly higher than with TEA. Interestingly, enantioselectivity was not changed appreciably when various bases were used. This is in contrast with the observations made with substrate (R)-5.
It was clear that the base dramatically influenced the reaction performance for no apparent reason. We therefore set out to investigate the observed phenomena closely by utilizing spectroscopic methods.
Spectroscopic studies
To get further information concerning the structure of species present in the solution, a mixture of complex 1, HCOOH and TEA was studied by NMR spectroscopy. Different ratios of TEA and HCOOH ranging from pure HCOOH to 1![[thin space (1/6-em)]](https://www.rsc.org/images/entities/char_2009.gif) :
:![[thin space (1/6-em)]](https://www.rsc.org/images/entities/char_2009.gif) 10 were examined (Fig. 1).
10 were examined (Fig. 1).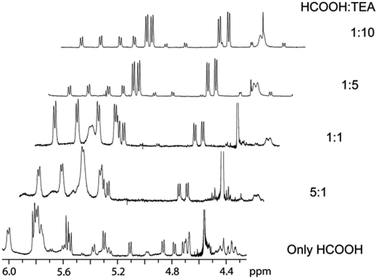 | ||
| Fig. 1 Spectra of 1 upon adding pure HCOOH or a mixture of HCOOH and TEA in various ratios. | ||
When only HCOOH (1 eq.) was added to 1, the Ru hydride species (2) could be detected but it underwent rapid decomposition. Adding excess HCOOH led to catalyst breakdown, although after a certain period of time complex 1 reappeared, meaning that HCOOH did not destroy the catalyst irreversibly. Addition of TEA had a positive effect on the formation of hydride 2 (Fig. 1) but increasing the TEA![[thin space (1/6-em)]](https://www.rsc.org/images/entities/char_2009.gif) :
:![[thin space (1/6-em)]](https://www.rsc.org/images/entities/char_2009.gif) HCOOH ratio above 5
HCOOH ratio above 5![[thin space (1/6-em)]](https://www.rsc.org/images/entities/char_2009.gif) :
:![[thin space (1/6-em)]](https://www.rsc.org/images/entities/char_2009.gif) 1 did not lead to any appreciable increase of the concentration of 2. Under such conditions, the aromatic region of 1H NMR spectra consisted of three sets of four individual signals belonging to three different p-cymene moieties, which can be attributed to (a) hydride 2, (b) a compound identified as ruthenium formate [Ru(HCOO−)(η6-p-cymene)TsDPEN],10a and (c) a species that was assumed to be a second diastereomer of the ruthenium hydride. The latter has also been observed in the case of ruthenium tethered complexes12 and the hypothesis is further supported by the fact that no second hydridic species was observed with an achiral p-toluenesulfonylethylenediamine ligand as shown by Ikariya et al.10a In contrast, in the 1H NMR spectrum of precatalyst 1, all protons of the p-cymene moiety resonated in a narrow region (Fig. S1†13). One interpretation of such significant changes might be that the coordination mode of p-cymene was changed. However, the 1JC–H direct interaction constants of p-cymene in complexes 1 and 2 were very similar (Table S1†13) and the slight differences were therefore ascribed to different electron-donating abilities of the chloride and hydride ligands. This measurement thus disproved our initial assumption of p-cymene decoordination since more profound changes of 1JC–H constants would be expected. An explanation based on subsequent experiments is proposed at the end of this study (vide infra).
1 did not lead to any appreciable increase of the concentration of 2. Under such conditions, the aromatic region of 1H NMR spectra consisted of three sets of four individual signals belonging to three different p-cymene moieties, which can be attributed to (a) hydride 2, (b) a compound identified as ruthenium formate [Ru(HCOO−)(η6-p-cymene)TsDPEN],10a and (c) a species that was assumed to be a second diastereomer of the ruthenium hydride. The latter has also been observed in the case of ruthenium tethered complexes12 and the hypothesis is further supported by the fact that no second hydridic species was observed with an achiral p-toluenesulfonylethylenediamine ligand as shown by Ikariya et al.10a In contrast, in the 1H NMR spectrum of precatalyst 1, all protons of the p-cymene moiety resonated in a narrow region (Fig. S1†13). One interpretation of such significant changes might be that the coordination mode of p-cymene was changed. However, the 1JC–H direct interaction constants of p-cymene in complexes 1 and 2 were very similar (Table S1†13) and the slight differences were therefore ascribed to different electron-donating abilities of the chloride and hydride ligands. This measurement thus disproved our initial assumption of p-cymene decoordination since more profound changes of 1JC–H constants would be expected. An explanation based on subsequent experiments is proposed at the end of this study (vide infra).
In the next stage, we utilized Fourier transform ion cyclotron resonance mass spectrometry with electrospray ionization in positive mode (ESI+-FT-ICR MS) to observe active hydride species 2. Since the NMR experiments showed that it was formed in the prevalence of TEA, similar conditions were applied (TEA![[thin space (1/6-em)]](https://www.rsc.org/images/entities/char_2009.gif) :
:![[thin space (1/6-em)]](https://www.rsc.org/images/entities/char_2009.gif) HCOOH = 5
HCOOH = 5![[thin space (1/6-em)]](https://www.rsc.org/images/entities/char_2009.gif) :
:![[thin space (1/6-em)]](https://www.rsc.org/images/entities/char_2009.gif) 2).
2).
The mass spectrum contained three isolated ion clusters (Fig. 2 and Table 2). The most intense ion cluster in the spectrum contained a monoisotopic ion with m/z 595.1500. Analyzing the ion cluster and the isotope relative ratio allowed us to reveal the molecular formula C31H35N2O2RuS, which well agreed with the measured data (Table 2). The species was identified as a [M − H]+ ion of the 16 e− Ru complex (3) that is formed from 1 by elimination of HCl.14 The second most intense ion cluster in the spectrum contained a monoisotopic ion with m/z 698.2855 reflecting the elemental composition C37H52N3O2RuS.
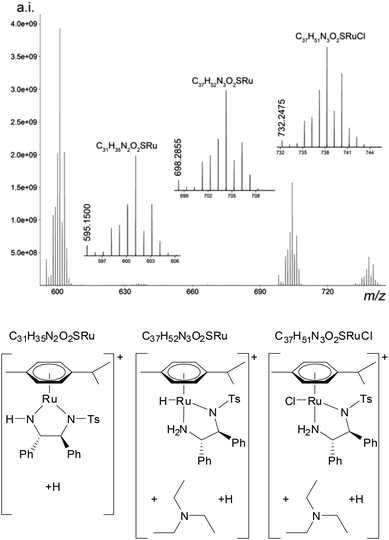 | ||
| Fig. 2 ESI+-FT-ICR MS spectrum of species formed from 1 in the presence of HCOOH and TEA. | ||
| Monoisotopic mass (m/z) | Error [ppm] | Formula | Identified species | |
|---|---|---|---|---|
| Measured | Theoretical | |||
| TEA | ||||
| 595.1500 | 595.1490 | 1.7 | C31H35N2O2RuS | 3 |
| 698.2855 | 698.2851 | 0.6 | C37H52N3O2RuS | 2 + base |
| 732.2475 | 732.2466 | 1.2 | C37H51N3O2RuSCl | 1 + base |
| DIPEA | ||||
| 595.1499 | 595.1490 | 1.5 | C31H35N2O2RuS | 3 |
| 726.3150 | 726.3164 | 1.9 | C39H56N3O2RuS | 2 + base |
| 760.2756 | 760.2779 | 3.0 | C39H55N3O2RuSCl | 1 + base |
| DABCO | ||||
| 595.1499 | 595.1490 | 1.5 | C31H35N2O2RuS | 3 |
| 709.2662 | 709.2647 | 2.1 | C37H49N4O2RuS | 2 + base |
| 743.2256 | 743.2262 | 0.8 | C37H48N4O2RuSCl | 1 + base |
The molecular formula of 2 is C31H36N2O2SRu, which differs from the ion cluster by C6H16N. Because the reaction mixture contained TEA (C6H15N), this cluster could be explained as 2 associated with TEA. Similarly, the third cluster (m/z 732.2475) was assigned to precatalyst 1 associated with TEA.
Application of ESI as an ion source can be accompanied by formation of artificial in-source ions as a consequence of ion–ion or ion–solvent reactions. However, they can be eliminated by dilution and no substantial changes in the MS spectrum after a 1000-fold dilution of the measured solution with pure acetonitrile were detected (Fig. S2†13). Therefore, we believe that the detected ions reflected the true solution composition.
To support our hypothesis based on the association of the base with the complex, we repeated the ESI+-FT-ICR MS measurements with DIPEA and DABCO. In both cases, three clusters were observed (Table 2, Fig. S3 and S4†13). The one corresponding to 3 was present in both spectra. The second and third clusters showed the presence of “2-base” and “1-base” associates, respectively. Thus, it was further confirmed that also other bases could bind to the Ru complex.
Although the experiments pointed to catalyst–base associates, it was not clear how the amines could be bound to 1 and 2. Three hypothetical situations were initially considered (see Fig. 3):
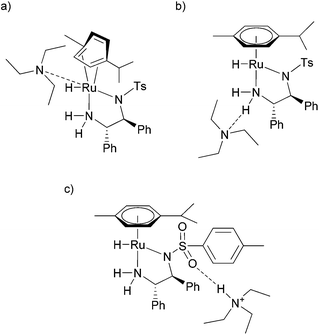 | ||
| Fig. 3 Three hypothetical associates of TEA with 1. The amine (a) coordinates to the Ru atom of 1, (b) forms a hydrogen bond with the NH2 group of the ligand, or (c) forms a hydrogen bond with the sulfonyl group. | ||
(a) The base coordinates to the ruthenium central atom.
(b) The base forms an N⋯H–N hydrogen bond with the NH2 group of the TsDPEN ligand.
(c) The base is protonated and forms an N+–H⋯O![[double bond, length as m-dash]](https://www.rsc.org/images/entities/char_e001.gif) S hydrogen bond with the sulfonyl group of the TsDPEN ligand.
S hydrogen bond with the sulfonyl group of the TsDPEN ligand.
Hydride 2 is a coordinatively saturated complex and thus one of its ligands would have to decoordinate in order to accept the base as a ligand. Since both hydride and TsDPEN ligands are required to maintain the catalytic activity of the complex, the only remaining situation would be a ring slippage, e.g. η6 to η4 (ref. 10a and 15) as depicted in Fig. 3a. However, this scenario was ruled out by NMR measurements as the 1JC–H interaction constants of p-cymene would necessarily change upon its decoordination (vide supra).
Options (b) and (c) required further investigation and therefore we directed our experiments towards vibrational circular dichroism (VCD). VCD spectra were measured together with IR absorption as the method enables simultaneous acquisition of both (Fig. 4). The rather low signal-to-noise ratio in VCD was inevitably caused by an intensive stream of gaseous CO2 that was formed when 1 was mixed with the HCOOH–base mixtures. Due to a high level of spectral noise within 1700–1550 cm−1, the VCD spectra were not interpreted in this region.
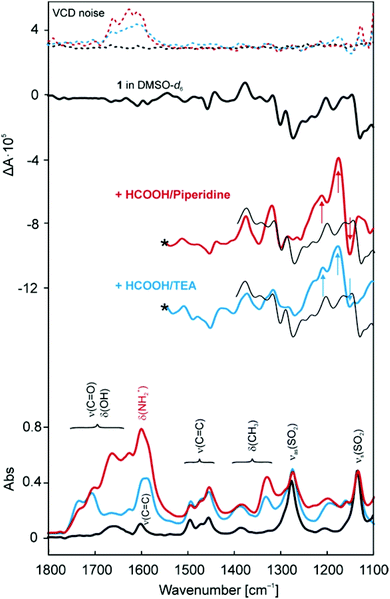 | ||
| Fig. 4 VCD and IR absorbance spectra of 1 in DMSO-d6 and upon addition of HCOOH/piperidine (5/2) and HCOOH/TEA (5/2) mixtures. VCD noise is depicted in dashed lines. | ||
Strong bands in the IR absorption spectrum of 1 at 1275 and 1133 cm−1 were assigned to asymmetric and symmetric vibrations of the SO2 group of TsDPEN. In the VCD spectrum, these vibrations were identified as negative patterns at 1272 and 1129 cm−1. When the HCOOH–base mixtures were added, two pronounced changes were observed. Firstly, a new band appeared in VCD at 1211 and 1213 cm−1 for TEA and piperidine, respectively, which was assigned to asymmetric stretching of the SO2 group combined with another vibration of a group nearby. Secondly, an exciton couplet appeared in VCD with a positive signal at 1178 and 1176 cm−1 for TEA and piperidine, respectively, and a negative signal at 1153 cm−1, which was identified as C–N stretching vibration of the protonated base. However, the C–N vibrations are typically located at lower wavenumbers. The observed shift may be explained by the fact that the base was bound to the Ru complex. Moreover, as the protonated base is not chiral itself and cannot be observed in a VCD spectrum, the VCD signal supported the hypothesis of a complex–base associate. In combination with the distinct change of the vibrations of the SO2 group observed in VCD, this observation suggested a hydrogen bond of the N+–H⋯O![[double bond, length as m-dash]](https://www.rsc.org/images/entities/char_e001.gif) S type connecting the SO2 group of TsDPEN and the protonated base. For the sake of completeness, additional assignment of the measured VCD signal is given in ESI.†
S type connecting the SO2 group of TsDPEN and the protonated base. For the sake of completeness, additional assignment of the measured VCD signal is given in ESI.†
Hypothesis (c) was conditional on the presence of a protonated base that could form a hydrogen bond. In the case of piperidine, deformation vibrations of the NH2+ group were observed in the IR spectrum at 1600 cm−1 (Fig. 4). Since the N–H bond of protonated TEA can only undergo stretching vibrations at shorter wavelengths, the deformation vibrations could not be expected in VCD spectra. Therefore, additional FT-IR spectra were measured for 1 and 1 + HCOOH/TEA in the range of 4000–2000 cm−1 (Fig. S5†13). Unfortunately, we refrained from drawing conclusions based on these data due to their unsatisfactory quality. Protonation of TEA was therefore assumed from its similarity with piperidine regarding structure and acidic properties.
The stark difference between the 1H NMR spectra of 1 (Fig. S1†13) and 1 + HCOOH/TEA (Fig. 1) was also interpreted based on the knowledge obtained. TEA, presumably bound to the complex, changed the proton shielding and symmetry of the system, which resulted in the p-cymene ligand being manifested as four individual doublets instead of a narrow multiplet.
Diffusion ordered spectroscopy (DOSY) and NOE-based NMR measurements were carried out to examine the base–catalyst interaction. Unfortunately, no conclusive results could be obtained due to several complications arising from the composition of the mixture. The HCOOH–triethylamine mixture is in excess to the catalyst and therefore we were usually confronted with very strong ridges in the spectra coming from intense signals of TEA. Further, the lifetime of 2 is relatively short (about 8–10 hours), which prevented us from running experiments that are long enough to get a reasonable signal-to-noise ratio for the catalyst present as a minority. Finally, the complex-bonded TEA does not exhibit separate resonances different from the HCOOH–TEA complex, which prevented us from performing some selective experiments and/or selective suppression of the intense signals.
Therefore, the higher amount of the HCOOH–triethylamine mixture over the catalyst was detrimental to the DOSY experiments. The processing of a DOSY experiment consists of the analysis of the NMR signal attenuation of particular mixture components. The loss of signal intensity depends on the power of magnetic gradients and the slope is proportional to the diffusion coefficient. We expect the presence of bonded and non-bonded TEA species, which both possess NMR signals of the same chemical shifts. Therefore, the analysis of the DOSY spectrum would require a detection of minor changes in the attenuation curve of the signals of TEA caused by bonded TEA, which is unrealistic in the case of predominating non-bonded TEA. The DOSY spectra, which were measured, demonstrated mainly TEA signals with no unequivocal demonstration of TEA being bonded to the complex. When the complex and HCOOH–triethylamine were in an equimolar ratio, the conversion of 1 to 2 was not complete and the mixture composition no longer corresponded to the reaction conditions.
The NOE measurements were likewise complicated by the excess of triethylamine. Since only a small part of the total amount of triethylamine forms the described associate with the Ru complex, it could not be observed under such conditions.
Eventually, the findings allowed us to offer an explanation for the differences in reactivity and/or selectivity observed in the ATH of (R)-5 and 6. Similarly to the base, the substrate is also protonated and enters the transition states from an energetic minimum in which it is bonded to the oxygen atom of the sulfonyl group (Fig. 5a).16 The base can compete with the substrate for this site, which might explain its influence on the reaction rate.17
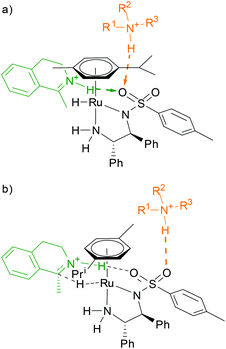 | ||
| Fig. 5 (a) The base hinders the substrate by competing for the sulfonyl site; (b) the base is involved in the supramolecular structure of the diastereomeric transition state, thus affecting its free energy. | ||
Enantioselectivity is a result of a fine interplay between the substrate and the η6-aromate of the catalyst, which is based on CH–π interactions. The presence of a base in the vicinity of the aromatic ligand and the substrate molecule (Fig. 5b) may affect the free energy of Si (G‡S) and/or Re (G‡R) transition states (sterically, electronically, or by a combination of both), thereby changing the enantioselectivity since the ee value is factually dependent on the difference ΔG‡R/S. Regarding different trends of de and ee in the case of (R)-5 and 6, respectively, it is speculated that the molecules of the catalytic complex and (R)-5 are structurally more prone to interfere with the base, resulting in more apparent influence of the base on the reaction performance.
Conclusions
Together with the aforementioned results we can draw a conclusion that it is likely that the base binds to the catalytic complex by forming an N+–H⋯O![[double bond, length as m-dash]](https://www.rsc.org/images/entities/char_e001.gif) S hydrogen bond with the SO2 group of the ligand. As a consequence, the selection of the base can have an influence on the reaction rate and enantioselectivity of the ATH of cyclic imines. The influence of the base on the enantioselectivity of the ATH of ketones, as observed earlier,11 can be explained in the same fashion.
S hydrogen bond with the SO2 group of the ligand. As a consequence, the selection of the base can have an influence on the reaction rate and enantioselectivity of the ATH of cyclic imines. The influence of the base on the enantioselectivity of the ATH of ketones, as observed earlier,11 can be explained in the same fashion.In the mechanistic pathways described so far, the base solely serves as an acceptor of the chloride ligand from the RuII precatalyst. The implications of this work thus supplement those parts of the reaction mechanism that have already been clarified, and allow for a rational optimization of the ATH reaction conditions that would suit concrete substrates.
Experimental
Chemicals
[RuCl(η6-p-cymene)TsDPEN], (2R)-2-phenylpropan-1-amine (99%), phosphorus oxychloride (99%), acetanhydride (≥98%), formic acid (≥96%), triethylamine (≥99%), N,N-diisopropyl(ethyl)amine (99.5%), 1,4-diazabicyclo[2.2.2]octane (≥99%), pyridine (≥99.0%), pyrrole (98%), imidazole (≥99%), pyrrolidine (≥99%), morpholine (≥99%), piperidine (99%) were purchased from Sigma-Aldrich (Steinheim, Germany). DMSO-d6 (99.8 atom%D), CD3CN (99.5 atom%D), and CDCl3 (99.8 atom%D) were purchased from ARMAR Chemicals. Toluene (p.a.), chloroform (p.a.), acetonitrile (p.a.), xylene (p.a.) and diethyl ether (p.a.) were obtained from Penta (Czech Republic).Instrumentation
Spectroscopic studies
Procedure for the ATH of 6: A stock solution of 1 (5.2 mg mL−1) was prepared. HCOOH (62 μL, 2.2 mmol) and a base (2.5 eq.) were premixed in CD3CN, the mixture was transferred into an NMR tube and a solution of 1 (97 μL) was added thereto. Then substrate 6 (12 mg, 83 μmol) dissolved in CD3CN was added to reach a total volume of 800 μL. 1H spectra were acquired at regular intervals. Conversion was determined by integration. After the reaction, a saturated solution of sodium carbonate (1 mL) was added to the reaction mixture, which was subsequently extracted with diethyl ether, dried over magnesium sulfate and evaporated to dryness. The residue was reconstituted to acetonitrile (1 mL), (1R)-(−)-menthyl chloroformate (10.0 μL, 0.13 mmol) and triethylamine (20.0 μL, 0.14 mmol) were added and the sample was analyzed on GC for the determination of enantiomeric excess (ee).
Preparative procedures
Acknowledgements
This work has been financially supported by the Grant Agency of the Czech Republic (Grant GACR 104/09/1497 and P106/12/1276), and by a grant for long-term conceptual development of Institute of Microbiology RVO: 61388971. We would like to thank Miroslava Novotná from Laboratory of Molecular Spectroscopy, ICT Prague, for providing the equipment and assistance with measuring the FT-IR experiments.Notes and references
- A. M. Rouhi, Chem. Eng. News, 2004, 82, 47–62 Search PubMed.
- (a) T. Ohkuma and R. Noyori, in Comprehensive Asymmetric Catalysis, ed. E. N. Jacobsen, A. Pfaltz and H. Yamamoto, Springer, Berlin, 1999, vol. 1, ch. 6.1, pp. 199–246 Search PubMed; (b) H.-U. Blaser and F. Springer, in Comprehensive Asymmetric Catalysis, ed. E. N. Jacobsen, A. Pfaltz and H. Yamamoto, Springer, Berlin, 1999, vol. 1, ch. 6.2, pp. 247–265 Search PubMed; (c) R. Noyori, Asymmetric Catalysis in Organic Synthesis, Wiley, New York, 1994, pp. 16–94 Search PubMed; (d) R. Noyori and T. Ohkuma, Angew. Chem., Int. Ed., 2001, 40, 40–73 CrossRef CAS; (e) H.-U. Blaser, C. Malan, B. Pugin, F. Spindler, H. Steiner and M. Studer, Adv. Synth. Catal., 2003, 345, 103–151 CrossRef CAS.
- R. Noyori, M. Kitamura and T. Ohkuma, Proc. Natl. Acad. Sci. U. S. A., 2004, 101, 5356–5362 CrossRef CAS.
- (a) G. Zassinovich, G. Mestroni and S. Gladiali, Chem. Rev., 1992, 92, 1051–1069 CrossRef CAS; (b) R. Noyori and S. Hashiguchi, Acc. Chem. Res., 1997, 30, 97–102 CrossRef CAS; (c) K. Everaere, A. Mortreux and J.-F. Carpentier, Adv. Synth. Catal., 2003, 345, 67–77 CrossRef CAS; (d) M. J. Palmer and M. Wills, Tetrahedron: Asymmetry, 1999, 10, 2045–2061 CrossRef CAS; (e) S. F. M. Nordin, P. Roth, T. Tarnai, D. A. Alonso, P. Brandt and P. G. Andersson, Chem.–Eur. J., 2001, 7, 1431–1436 CrossRef CAS.
- (a) T. Ohkuma, H. Ooka, S. Hashiguchi, T. Ikariya and R. Noyori, J. Am. Chem. Soc., 1995, 117, 2675–2676 CrossRef CAS; (b) T. Ohkuma, H. Ooka, T. Ikariya and R. Noyori, J. Am. Chem. Soc., 1995, 117, 10417–10418 CrossRef CAS; (c) H. Doucet, T. Ohkuma, K. Murata, T. Yokozawa, M. Kozawa, E. Katayama, A. F. England, T. Ikariya and R. Noyori, Angew. Chem., Int. Ed., 1998, 37, 1703–1707 (Angew. Chem., 1998, 110, 1792–1796) CrossRef CAS; (d) T. Ohkuma, D. Ishii, H. Takeno and R. Noyori, J. Am. Chem. Soc., 2000, 122, 6510–6511 CrossRef CAS; (e) T. Ohkuma, M. Koizumo, K. Muniz, G. Hilt, C. Kabuto and R. Noyori, J. Am. Chem. Soc., 2002, 124, 6508–6509 CrossRef CAS.
- (a) J.-E. Bäckvall, J. Organomet. Chem., 2002, 652, 105–111 CrossRef; (b) S. E. Clapham, A. Hadzovic and R. H. Morris, Coord. Chem. Rev., 2004, 248, 2201–2237 CrossRef CAS; (c) J. S. M. Samec, J.-E. Bäckvall, P. G. Andersson and P. Brandt, Chem. Soc. Rev., 2006, 35, 237–248 RSC; (d) A. Fabrello, A. Bachelier, M. Urrutigoïty and P. Kalck, Coord. Chem. Rev., 2010, 254, 273–287 CrossRef CAS.
- (a) M. Yamakawa, H. Ito and R. Noyori, J. Am. Chem. Soc., 2000, 122, 1466–1478 CrossRef CAS; (b) R. Noyori, M. Yamakawa and S. Hashiguchi, J. Org. Chem., 2001, 66, 7931–7944 CrossRef CAS.
- K.-J. Haack, S. Hashiguchi, A. Fujii, T. Ikariya and R. Noyori, Angew. Chem., Int. Ed. Engl., 1997, 36, 285–288 (Angew. Chem., 1997, 109, 297–300) CrossRef CAS.
- (a) C. A. Sandoval, T. Ohkuma, N. Utsumi, K. Tsutsumi, K. Murata and R. Noyori, Chem.–Asian J., 2006, 1, 102–110 CrossRef CAS; (b) C. A. Sandoval, F. Bie, A. Matsuoka, Y. Yamaguchi, H. Naka, Y. Li, K. Kato, N. Utsumi, K. Tsutsumi, T. Ohkuma and R. Noyori, Chem.–Asian J., 2010, 5, 806–816 CrossRef CAS.
- (a) T. Koike and T. Ikariya, Adv. Synth. Catal., 2004, 346, 37–41 CrossRef CAS; (b) J. J. Soldevila-Barreda, P. C. A. Bruijnincx, A. Habtemariam, G. J. Clarkson, R. J. Deeth and P. J. Sadler, Organometallics, 2012, 31, 5958–5967 CrossRef CAS.
- J. Zhang, P. G. Blazecka, M. M. Bruendl and A. Arbor, J. Org. Chem., 2009, 74, 1411–1414 CrossRef CAS.
- (a) A. M. Hayes, D. J. Morris, G. J. Clarkson and M. Wills, J. Am. Chem. Soc., 2005, 127, 7318–7319 CrossRef CAS; (b) F. K. K. Cheung, A. J. Clarke, G. J. Clarkson, D. J. Fox, M. A. Graham, C. Lin, A. L. Crivillé and M. Wills, Dalton Trans., 2010, 39, 1395–1402 RSC.
- See ESI.†.
- M. Yamakawa, H. Ito and R. Noyori, J. Am. Chem. Soc., 2000, 122, 1466–1478 CrossRef CAS.
- J. Canivet, G. Labat, H. Stoeckli-Evans and G. Süss-Fink, Eur. J. Inorg. Chem., 2005, 4493–4500 CrossRef CAS.
- J. Václavík, M. Kuzma, J. Přech and P. Kačer, Organometallics, 2011, 30, 4822–4829 CrossRef.
- We are aware of the fact that a significant contribution can also be made by the base during the formation of hydride 2. However, the hydride formation was beyond the focal point of this study and investigations in this direction are currently underway.
- (a) M. Strohalm, D. Kavan, P. Novák, M. Volný and V. Havlíček, Anal. Chem., 2010, 82, 4648–4651 CrossRef CAS; (b) M. Strohalm, M. Hassman, B. Košata and M. Kodíček, Rapid Commun. Mass Spectrom., 2008, 22, 905–908 CrossRef.
- M. Urbanová, V. Setnička and K. Volka, Chirality, 2000, 12, 199–203 CrossRef.
Footnote |
| † Electronic supplementary information (ESI) available: Additional spectroscopic data. See DOI: 10.1039/c3dt32733g |
| This journal is © The Royal Society of Chemistry 2013 |

