Open Access Article
DOI:
10.1039/C2DT32650G
(Paper)
Dalton Trans., 2013,
42, 2580-2587
Thermochromic organometallic complexes: experimental and theoretical studies of 16- to 18-electron interconversions of adducts of arene Ru(II) carboranes with aromatic amine ligands†
Received
6th November 2012
, Accepted 23rd November 2012
First published on 6th December 2012
Abstract
A series of 18-electron complexes of general formula [Ru(p-cym)(1,2-dicarba-closo-dodecaborane-1,2-dithiolato)(L)] (p-cym = para-cymene; L = 4-dimethylaminopyridine (2), nicotinamide (3), 3-ethynylpyridine (4), N-methylimidazole (5), 4-cyanopyridine (6), and pyridine (7)) were synthesised by reactions between the 16-electron precursor [Ru(p-cym)(1,2-dicarba-closo-dodecaborane-1,2-dithiolato)] (1) and corresponding heterocyclic bases. X-ray crystal structures of complexes 2 and 5 were determined. In dichloromethane and chloroform solutions at ambient temperature, the 18-electron complexes 2–7 are in equilibrium with the 16-electron precursor 1. Each equilibrium is displaced towards the formation of the blue 16-electron or yellow 18-electron complex by increasing or decreasing the temperature of the solution, respectively, which results in controlled and reversible thermochromism. Binding constants (K) and Gibbs free energies (ΔG°) of the six equilibria have been determined by a combination of experiments (Job plots, UV-visible titrations, NMR studies) and also by computation (time-dependent density functional theory, TD-DFT). A linear free energy relationship for log K versus pKa for the pyridine and imidazole ligands was established. The predicted strong interactions of 1 with other aromatic amine ligands, such as amphetamine derivatives, were verified experimentally. This appears to be the first report of reversible 16/18-electron interconversions with associated thermochromic properties for a well-known family of complexes.
Introduction
Half-sandwich complexes are ubiquitous in organometallic chemistry, and usually adhere to the 18-electron rule. Nevertheless, several stable 16-electron complexes have been isolated and have found applications in many stoichiometric and catalytic reactions.1 A striking example is the development by Noyori and co-workers of a series of pre-catalyst 18-electron arene ruthenium complexes that generate 16-electron catalysts for the homogeneous catalytic oxidation of secondary alcohols in the presence or absence of a base.2 Stable and isolated 16-electron ruthenium complexes have also demonstrated potential as catalysts for azide-alkyne cycloaddition reactions,3 racemisation of aromatic and aliphatic secondary alcohols,4 and for transfer hydrogenation.5 These examples have stimulated interest in the elucidation of the factors which control the stability, reactivity and structures of complexes having 16-electron configurations.
The isolation in 2000 of the 16-electron, half-sandwich, air-stable complex [Ru(p-cym)(1,2-dicarba-closo-dodecaborane-1,2-dithiolato)] (1) by Herberhold and co-workers,6 paved the way for exploration of the chemistry of carborane-containing half-sandwich ruthenium complexes. Complex 1 has been widely used as a precursor for the synthesis of 18-electron complexes since then.7 Addition reactions on the metal centre,6,8 direct formation of metal–metal bonds,9 B–H activation10 and transmetalation11 are examples of reactions which allow functionalisation of the 16-electron precursor. However, despite the efforts of various research groups to synthesise a library of such compounds, these complexes have found only a few applications so far. They have been used as building blocks for designing metalla-assemblies12 and some examples of their utilisation as antiproliferative agents13 have been reported.
Here, we describe the functionalisation of complex 1 by addition of a series of pyridine and imidazole derivatives acting as Lewis bases. The complexes of general formula [Ru(p-cym)(1,2-dicarba-closo-dodecaborane-1,2-dithiolato)(L)] (L = 4-dimethylaminopyridine (2), nicotinamide (3), 3-ethynylpyridine (4), N-methylimidazole (5), 4-cyanopyridine (6), and pyridine (7)) have been prepared and characterised by IR, UV and NMR spectroscopy as well as by elemental analysis. Interestingly, we have discovered that all the 18-electron complexes are in equilibrium in dichloromethane and chloroform solutions with the 16-electron precursor (see Fig. 1). Solutions of the 16/18-electron complexes exhibit thermochromic properties. Despite numerous reported studies of addition reactions on the metal centre of 1 using pyridine derivatives,7 such thermochromism has not been reported previously. We have elucidated this thermochromism by studies of the equilibrium between 16- and 18-electron complexes in solution using electronic absorption and NMR spectroscopy, and TD-DFT calculations.
 |
| | Fig. 1 The 16/18-electron equilibrium for complex 1 and the heterocyclic bases (L) studied in this work. | |
Results
Synthesis of complexes 2–7
The 18-electron pyridine complex 7 was prepared according to the procedure described in the literature,6 and complexes 2–6 were synthesised following the same one-step strategy using the 16-electron complex [Ru(p-cym)(1,2-dicarba-closo-dodecaborane-1,2-dithiolato)] (1) as precursor. Addition of 1 mol equiv. of Lewis base (pyridine and imidazole derivatives) at ambient temperature to the deep blue solution of 1 in dichloromethane produced an immediate change of colour from blue to yellow, green or light blue, depending on the derivative. After 24 h of reaction, complexes 2–7 were purified by precipitation (dichloromethane/hexane) and isolated in good yields (ca. 70%) as air-stable, yellow powders. Further details are in the ESI.†
The compounds are soluble in most organic solvents, including dichloromethane, THF, and acetone, but only slightly soluble in diethyl ether, and insoluble in hexane and water. Complexes 2–6 were characterised by IR (as solids), UV-visible spectroscopy in dichloromethane solutions (10−4 M), and by NMR spectroscopy (1H, 11B and 13C NMR) in deuterated chloroform at ambient temperature. Elemental analyses confirmed the high purity of the isolated compounds. The data and their assignments are reported in the ESI† (as well as the materials, methods and instrumentation used).
Infrared spectroscopy
The IR spectra are dominated by the band associated with B–H vibrations at ca. 2575 cm−1 (listed in the ESI†) and by C–H stretching vibrations of the para-cymene aromatic ligand at ca. 3000 cm−1. Depending on the nature of the heterocyclic bases, bands associated with C–Naromatic (p-NMe2py), C![[double bond, length as m-dash]](https://www.rsc.org/images/entities/char_e001.gif) O (nicotin), C–Halkyne (m-acetpy), C–Nnitrile vibrations are observed at 1385, 1694, 3295, and 2241 cm−1, respectively.
O (nicotin), C–Halkyne (m-acetpy), C–Nnitrile vibrations are observed at 1385, 1694, 3295, and 2241 cm−1, respectively.
NMR spectroscopy
The aromatic region of the 1H NMR spectra of isolated complexes 2–6 in CDCl3 at ambient temperature is shown in Fig. 2.
 |
| | Fig. 2 Aromatic region of the 1H NMR spectra of 5 mM solutions of complexes 2–6 in CDCl3, 298 K. The 2D 1H–1H COSY spectrum of complex 4 (Fig. S1 in the ESI†) reveals the overlap of the peak for Hd with solvent CHCl3. | |
The shifts and broadenings of the peaks suggest the presence of equilibria between 16- and 18-electron species at ambient temperature in CDCl3. To evaluate the ratio between 16- and 18-electron complexes in CDCl3 at 298 K, a large excess of the respective amine ligand was added to the NMR tube for each solution of complexes 2–7 (5 mM concentration) and the mol fractions of each were determined. Since only one set of amine signals is observed, the exchange rate is relatively fast on the NMR timescale, and the shifts can be described by the following equation:14
| | | δobs = χbδb + χfδf = χbδb + (1 − χb)δf | (1) |
where
χb and
χf are mol fractions of bound and free
amine, respectively;
δb and
δf are chemical shifts of bound and free
amine, respectively;
δobs is the observed chemical shift. As an example, in the case of the equilibrium between
1 and
5, the ratio between 16- and 18-electron complexes was determined from the doublet of the
para-cymene
protons at 5.59 ppm for 16-electron complex
1. To determine
δb, a large excess of
p-NMe
2py was added so as to displace the equilibrium towards the 18-electron complex
5, giving
δb as 5.01 ppm.
δobs is 5.11 ppm (see ESI
†).
Eqn (1) gives:
χb = (
δobs −
δf)/(
δb −
δf) = 0.83. Thus, at 298 K, the mol fraction of 18-electron complex
5 is 83% and the mol fraction of 16-electron complex
1 is 17%. The same procedure was followed for complexes
2–7 and the data are summarised in
Table 1.
Table 1
1H, 11B and 13C NMR data for 5 mM solutions of 1–7 in CDCl3 at 298 K. For complexes 2–7, the shifts are the weighted averages of 16- and 18-electron complexes as indicated
| |
% 18e |
% 16e |
δ
13Ca |
δ
1Hb |
δ
11B (B3,6) |
δ
11B (B4,5,7,11) |
δ
11B (B8,10) |
δ
11B (B9,12) |
|
Carborane resonances.
Amine protons.
Data from ref. 6. 11B peaks for all solutions studied here are relatively broad and assignments are tentative.
|
|
1
|
0 |
100 |
93.7c |
|
−6.40c |
−7.50c |
−9.20c |
−9.20c |
|
2
|
98 |
2 |
93.9 |
8.24 6.42 3.07 |
−8.02 |
−8.55 |
−8.55 |
−11.22 |
|
3
|
42 |
58 |
93.5 |
9.08 8.83 8.18 7.40 |
−7.97 |
−7.97 |
−7.97 |
−10.59 |
|
4
|
31 |
69 |
93.2 |
8.82 8.69 7.82 7.28 3.28 |
−7.85 |
−8.21 |
−7.85 |
−10.57 |
|
5
|
83 |
17 |
94.1 |
7.83 7.13 6.85 3.74 |
−8.13 |
−8.13 |
−8.13 |
−11.25 |
|
6
|
44 |
56 |
93.7 |
8.87 7.51 |
−7.62 |
−8.52 |
−7.62 |
−10.45 |
|
7
|
48 |
52 |
93.8 |
8.82 7.73 7.28c |
−6.70c |
−8.70c |
−11.6c |
−11.6c |
The BH proton signals of the carborane cluster in the region 0.0 to 3.0 ppm are broad and unresolved due to the quadrupolar nature of 10B and 11B, and due to chemical exchange between 16- and 18-electron species. The 13C NMR spectra in CDCl3 of complexes 1–7 show a signal at ca. 93 ppm, which is characteristic of the resonance of the carbon atoms of the 1,2-dicarba-closo-dodecaborane-1,2-dithiolato ligand in this type of complex.611B{1H} NMR spectra of all complexes in CDCl3 at 298 K display three broad resonances, with relative integrals of 2![[thin space (1/6-em)]](https://www.rsc.org/images/entities/char_2009.gif) :4:4 for complex 2, 8 (overlap of peaks at −7.97 and −8.13 ppm): 2 for complexes 3 and 5, and 4:4:2 for complexes 4 and 6 (see Fig. 1 for the labeling of the boron atoms and Section S1.2 in the ESI† for the assignment of the signals). Table 1 summarises these NMR data.
:4:4 for complex 2, 8 (overlap of peaks at −7.97 and −8.13 ppm): 2 for complexes 3 and 5, and 4:4:2 for complexes 4 and 6 (see Fig. 1 for the labeling of the boron atoms and Section S1.2 in the ESI† for the assignment of the signals). Table 1 summarises these NMR data.
X-ray crystal structures
Recrystallization of [Ru(p-cym)(1,2-dicarba-closo-dodecaborane-1,2-dithiolato)(4-dimethylaminopyridine)] (2) and [Ru(p-cym)(1,2-dicarba-closo-dodecaborane-1,2-dithiolato)(N-methylimidazole)] (5) from dichloromethane/hexane afforded yellow single crystals corresponding to 2 and 5·1.5CHCl3 suitable for X-ray diffraction. Crystallographic data are listed in Table S1† and selected bond lengths and angles in Tables S2 and S3,† respectively. The structures of 5 and 2 are depicted in Fig. 3 and S2,† respectively.
![ORTEP drawing of [Ru(p-cym)(1,2-dicarba-closo-dodecaborane-1,2-dithiolato)(Me-imi)] (5) in the X-ray crystal structure of 5·1.5CHCl3 at the 50% probability level. Hydrogen atoms and solvent chloroform are omitted for clarity.](/image/article/2013/DT/c2dt32650g/c2dt32650g-f3.gif) |
| | Fig. 3 ORTEP drawing of [Ru(p-cym)(1,2-dicarba-closo-dodecaborane-1,2-dithiolato)(Me-imi)] (5) in the X-ray crystal structure of 5·1.5CHCl3 at the 50% probability level. Hydrogen atoms and solvent chloroform are omitted for clarity. | |
The structure determinations of 2 and 5 show that they possess the typical half-sandwich pseudo-octahedral structure with chelated thiolate sulfur atoms from the 1,2-dicarba-closo-dodecaborane-1,2-dithiolato ligand and nitrogen binding to the ruthenium centre from p-NMe2py or Me-imi monodentate ligand. The RuS2C2 metalla-cycle has been reported as planar in 1.6 For complexes 2 and 5, the out-of-(S2C2)plane distance of the ruthenium atom is 0.143 and 0.153 Å, respectively, suggesting a slight bending of the RuS2C2 metalla-cycle. The Ru–N bond lengths (2.1311(12) Å in 2 and 2.1130(2) Å in 5) are close to those (ca. 2.1 Å) of related ruthenium compounds published previously.15 The C–C bond length (1.6640(20) Å in 2 and 1.6550(40) Å in 5) of the carborane is in the range typical of known carborane derivatives (1.62–1.70 Å).16
The UV-visible spectra of complexes 2–7 in dichloromethane show an intense high-energy band at around 250 nm, and spectra of complexes 1 and 3–7 also contain a band centred at 352 nm (see Fig. 4). The blue colour exhibited by the 16-electron precursor 1, due to the band centred at around 632 nm (ε = 2100 L mol−1 cm−1), is also observed in the spectra of 18-electron complexes 2–7 dissolved in dichloromethane, but with less intensity suggesting that there is partial dissociation under these conditions (ε632 = 600 (2), 1900 (3), 2000 (4), 1100 (5), 1800 (6) and 1900 (7) L mol−1 cm−1). These bands are consistent with the colours of the different solutions: solutions of 2 and 5 are yellow at ambient temperature and have the lowest molar extinction coefficients at 635 nm. The wavelengths and extinction coefficients of local maxima of complexes 1–7 are given in Table S4 in ESI.†
Electronic spectroscopic data for DFT-optimised complexes 1–7 in a dichloromethane conductor-like screening model solvation field were calculated by computing the lowest 80 singlet states via time-dependent DFT calculations using the restricted Kohn–Sham density functional theory approach (details in Section S1.3 in the ESI†). An excellent agreement between experimental and calculated spectra is observed when weighted averages of the spectrum of 1 with each of the other complexes 2–7 are applied (see Table 2). For instance, the calculated spectrum of complex 2 is in accordance with the experimental spectrum of 2 when a composition of 45% of 2 + 55% of 1 is applied in the calculations. Fig. 5 illustrates the calculated UV-visible spectra of complexes 1–7 with these weighted average percentages and the very good simulation of the experimental spectra. These simulations confirm the existence of an equilibrium between the 16-electron precursor 1 and corresponding 18-electron complexes 2–7 in dichloromethane solution at ambient temperature.
 |
| | Fig. 5 Computed UV-visible spectra of complexes 1–7, in a dichloromethane field, using the weights of complex 1 in Table 2 and the respective complex 2–7 to represent the equilibrium. | |
Table 2 Weights used to simulate the absorption spectra of 10−4 M solutions of complexes 1–7 in dichloromethane
| Complex |
% 18e |
% 16e |
|
1
|
0 |
100 |
|
2
|
45 |
55 |
|
3
|
8 |
82 |
|
4
|
2 |
98 |
|
5
|
32 |
68 |
|
6
|
13 |
87 |
|
7
|
20 |
80 |
Molecular orbitals and electronic transitions
Time-dependent DFT calculations were also used to determine the most significant molecular orbital transitions involved in the UV-visible bands observed at 352 nm and 632 nm for complex 1. Fig. 6 shows the experimental UV-visible spectrum of 1 in dichloromethane solution at 298 K and the main calculated singlet electronic transitions (1–5) as black vertical bars with heights equal to their oscillator strengths (f).
 |
| | Fig. 6 Experimental UV-visible spectrum of 1 in dichloromethane solution at 298 K and the main calculated singlet electronic transitions (1–5) as bars with lengths proportional to their oscillator strengths. | |
Analysis of transitions 1–5 shows that the band centred at 352 nm (28409 cm−1) is mainly due to d–d transitions with some sulfur π character, while the band at 632 nm (15822 cm−1) is due to a mixture of ligand-to-metal charge-transfer (LMCT) from sulfur σ and π orbitals to ruthenium, plus d–d transitions, plus metal-to-ligand charge-transfer (MLCT) from Ru–S π orbitals to Ru-p-cymene δ* molecular orbitals. These transitions as well as their relative weights are summarised in Table S5 in the ESI.† The molecular orbitals involved in these five transitions 1–5 are depicted in Fig. 7, numbered according to their energy levels.
 |
| | Fig. 7 Molecular orbitals involved in the five main calculated singlet electronic transitions (1–5 see Fig. 6). Colour code: boron purple, sulfur yellow, carbon grey, ruthenium blue. | |
Ligand binding studies
To gain more insight into the 16/18-electron equilibrium, the stoichiometry of the binding of the heterocyclic base ligands to complex 1 was first established by the method of continuous variations,17 which confirmed that 1:1 adducts are formed. The Job plot obtained at 298 K in dichloromethane (10−4 M) for the binding of p-NMe2py to complex 1 monitored at 303 nm is shown in Fig. S3 in the ESI.†
UV-visible spectroscopic titrations of complex 1 with pyridine and imidazole derivatives were carried out to determine the binding constants (see Fig. 8A for the titration of 1 with Me-imi). Upon gradual addition of ligand (0.1–11.0 mol equiv.) to a dichloromethane solution of complex 1 (10−4 M) at 298 K, the bands centred at 352 nm and 632 nm decreased in intensity, while the intensity of the band at ca. 450 nm increased. These experimental data were also compared and found to be very similar to the computed solution spectra in a dichloromethane field at 298 K as a function of composition (see Fig. 8B).
 |
| | Fig. 8 (A) Experimental UV-visible titration of complex 1 by Me-imi, in dichloromethane (10−4 M) at 298 K. (B) Computed solution spectra in a dichloromethane field at 298 K for the titration of complex 1 with 0–1 mol equiv. of Me-imi. | |
Thermodynamic parameters of the 16/18-electron interconversion
From the plots obtained for the UV-visible titrations, thermodynamic binding constants (Table 3) were determined by using the non-linear ThordarsonFittingProgram with MatLab (see Section S1.3 in the ESI†).18 The experimental Gibbs free energies (ΔG°exp) were determined from the corresponding binding constants using the Gibbs equation.19 DFT calculations were used to determine the theoretical Gibbs free energies (ΔG°calc, see Table 3).
Table 3 Binding constants K (103 M−1), experimental (ΔG°exp) and calculated (ΔG°cal) Gibbs free energies (kcal mol−1, dichloromethane, 10−4 M, 298 K) for interactions of complex 1 with the pyridine and imidazole derivatives, and aromatic amines
| Complex |
K
|
ΔG°exp |
ΔG°cal |
pKaa |
|
pKa values from ref. 20 (293 K).
Nd = not determined.
|
|
2
|
15.0 ± 1.1 |
−5.7 |
−8.4 |
9.20 |
|
3
|
2.8 ± 0.4 |
−4.7 |
−5.1 |
3.33 |
|
4
|
1.1 ± 0.8 |
−4.1 |
−5.0 |
4.22 |
|
5
|
5.9 ± 1.3 |
−5.1 |
−5.7 |
6.95 |
|
6
|
1.6 ± 0.6 |
−4.4 |
−3.9 |
1.90 |
|
7
|
4.2 ± 0.4 |
−4.9 |
−6.2 |
5.23 |
|
1 + benzylamine |
13.6 ± 0.6 |
−5.6 |
−5.8 |
9.34 |
|
1 + amphetamine |
Ndb |
Ndb |
−5.6 |
9.80 |
|
1 + mescaline |
Ndb |
Ndb |
−6.7 |
9.56 |
Thermochromism
A direct consequence of the equilibrium in solution between 16- and 18-electron complexes is the thermochromic properties of complexes 2–7. This thermochromism was firstly observed during attempts to crystallise complexes 2–7 by cooling down their chloroform/hexane solutions. Thermochromic properties were observed for each solution between ambient (298 K) and low temperature (ca. 258 K). Pictures of the different solutions of 2–7 in dichloromethane (10−4 M) at 258 K and 293 K are shown in Fig. S4.†Fig. 9 illustrates the strong thermochromism exhibited by complex 4 in dichloromethane (10−4 M) at 293 K, 258 K, and 193 K. The colour changes exhibited by complexes 2 and 5 are less dramatic than for the other complexes (see Fig. S4 in ESI†).
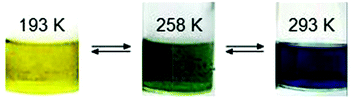 |
| | Fig. 9 Reversible thermochromism exhibited by a dichloromethane solution of 4 (10−3 M) at 193 K, 258 K and 293 K. | |
Discussion
General context
A variety of stable half-sandwich 16-electron metal coordination complexes has been isolated and fully characterised previously (see Table 4).
Table 4 Some examples of stable half-sandwich 16-electron complexes
| Metal |
Complex |
Crystal structure |
Ref. |
|
CCDC deposit number.
X-N = 2-amido-1-ethoxide, 1-N-p-tosyl-1,2-diamido-ethane, 1-N-p-tosyl-1,2-diamido-benzene, 1-N-(p-tosyl)-1,2-diamido-1,1,2,2-tetramethyl-ethane, 1-N-(p-tosyl)-1,2-diamido-meso-1,2-diphenyl-ethane. Other abbreviations: see Abbreviation section.
|
| Mo |
{[Mo(η7-C7H7)(BLR)]}+X− (X = BF4 or PF6) |
Yes |
21
|
| Fe |
[FeCp*(NHC)Cl] |
Yes |
22
|
| Ru |
[RuCp*(L)X] (L = phosphine, NHC; X = Cl, OCH2CF3) |
820903a |
23
|
| Ru |
[RuCp*(NHC)OH] (NHC = IPr, IMes) |
833140a |
24
|
| Ru |
[Ru(p-cym)(X-N)]b |
Yes |
25
|
| Ru |
[Ru(p-cym)((S,S)-TsDPEN)] |
686925a |
26
|
| Ru |
[RuCp*(PP)][BAr′4] (PP = (PEt3)2, dippe; Ar′ = 3,5-((CF3)2C6H3)) |
Yes |
27
|
| Ru |
[RuCp*{N(Ph2PS)2}] |
263956a |
28
|
| Os |
[OsCp*(iPr3P)Br] |
158416a |
29
|
| Co |
[CoCp(1,2-C2S2B10H10)] |
Yes |
30
|
| Rh |
[RhCp*(E2C2(B10H10))] (E = S, Se) |
No |
31
|
| Ir |
[IrCp*(CabN-DIC)]; [IrCp*(CabN-DCC)] |
827469a; 827470a |
32
|
| Ir |
{IrCp*[C6H4N(C6H3Me)(CHNC6H3Me2)]}+Cl− |
674230a |
33
|
Despite this reasonable number of known compounds, there appear to be no reports of thermodynamic studies of equilibria involving the interconversion between 16- and 18-electron complexes. Here, we have studied the equilibria between the 16-electron complex 1 and a series of 18-electron complexes 2–7 in dichloromethane and chloroform solutions, to establish relations between the thermodynamic parameters of these equilibria and the pKa of the ligands involved in forming the 18-electron adducts. Our studies involve the use of a chelated dithiolato carborane ligand. Organocarborane complexes in general offer potential for designing biologically active complexes.7 Despite previous reports of complexes in the present class (complex 7 was first reported in 2000), their behaviour in solution and in particular their thermochromism has not been previously observed. The thermochromism was dramatically manifested in our work during attempts to crystallise the complexes.
Linear free energy relationship
We sought to rationalise the stability of the various 18-electron amine adducts by correlation with their basicity (pKa values). As can be seen from Table 3, the three most basic ligands (4-dimethylaminopyridine (2), N-methylimidazole (5), and pyridine (7)), form the most stable adducts with the 16-electron centre. The plots of experimental and calculated free energies versus pKa values of the heterocyclic bases are reasonably linear, Fig. 11 (regression coefficients: R2 = 0.74 for experimental and R2 = 0.86 for calculated Gibbs free energies). This suggests that the electron donor strength of the nitrogen plays a major role in determining the stability of the 18-electron adduct. Some of the pyridine derivatives used contain functional groups, and the binding constants obtained from UV-visible titrations might be influenced by all the interactions between these ligands and complex 1, even though the main contribution is probably σ donation from the electron pair on the nitrogen atom. A deviation between calculated and experimental Gibbs free energies is observed, which might be attributable to estimated errors of ca. 1 kcal mol−1 in the computations, along with those inherent in the experimental determinations (see Table 3). The absence of explicit temperature effects in the calculations might be considered as well.
 |
| | Fig. 11 Linear free energy relationships for ΔG°exp and ΔG°calcversus pKa of the heterocyclic bases (see Table 3 for values). | |
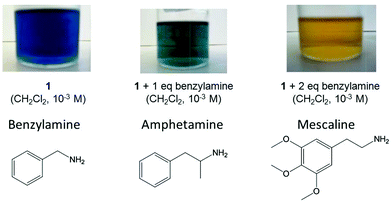
The heterocyclic bases which deviate the most from the experimental or calculated linear correlations are the nicotinamide and imidazole derivatives, respectively. The deviations may be related to the effect of the solvents. The Gibbs free energies for 18-electron formation were determined in dichloromethane while the pKa values were determined in water. The analogy between Ru2+ and H+ also does not consider the potential back π-bonding from filled d orbitals on the metal to π* antibonding p orbitals of the ligand. Nonetheless, this relationship offers a rationalisation of the binding strength of the amine ligands based on σ donation from the electron pair on the nitrogen atom, and can be used to predict the strength of binding of other amine ligands to ruthenium in complex 1. For example, we extrapolated the relationship to predict the stability of adducts with benzylamine and the important structurally-related drugs, amphetamine derivatives. According to the linear regression from Fig. 11, the basicity of benzylamine, amphetamine and mescaline would correlate with Gibbs free energies of −5.6, −5.7 and −5.6 kcal mol−1, respectively. The experimental (benzylamine) and calculated (amphetamine and mescaline) Gibbs free energies were determined by UV-visible titration and TD-DFT calculations as −5.6, −5.6 and −6.7 kcal mol−1, respectively (see Table 3), all within the range of the predicted values. The deviation of mescaline may be related to its ability to adopt different methoxy group conformations which was not fully taken in consideration during the calculations, since we confined them to the lowest-energy conformers of the isolated ligand and did not undertake a comprehensive conformational search for the full complex. These findings suggest a possible application for detection of aromatic amines which will be explored in subsequent work.
Conclusion
We synthesised a range of 18-electron complexes by addition of N-methylimidazole and pyridine derivatives to ruthenium in the 16-electron precursor [Ru(p-cym)(1,2-dicarba-closo-dodecaborane-1,2-dithiolato)] (1). In dichloromethane and chloroform solutions at ambient temperature, the corresponding yellow 18-electron complexes [Ru(p-cym)(1,2-dicarba-closo-dodecaborane-1,2-dithiolato)(L)] (L = 4-dimethylaminopyridine (2), nicotinamide (3), 3-ethynylpyridine (4), N-methylimidazole (5), 4-cyanopyridine (6), and pyridine (7)) are in equilibrium with the blue 16-electron precursor 1, and the thermal displacement of this equilibrium results in marked thermochromic properties. The thermochromism of each 16/18-electron system is correlated with the strength of binding of the heterocyclic base. A linear correlation between log K and pKa values of the ligands studied in this work was found by a combination of experiments and computation. This relationship offers a rationalisation of the binding strength of the amine ligands based on σ donation from the electron pair on the nitrogen atom. This study provides a basis for future applications of this 16/18-electron system as a bio-sensor, as demonstrated by the interaction between 1 and amphetamine derivatives.
Abbreviations
| Cp* | pentamethylcyclopentadienyl; |
| Cp | cyclopentadienyl; |
|
p-cym |
para-cymene; |
| NHC |
N-heterocyclic carbene; |
| IPr | 1,3-bis(2,6-diisopropylphenyl)imidazol-2-ylidene; |
| IMes | 1,3-bis(2,4,6-trimethylphenyl)imidazol-2-ylidene; |
| TsDPEN | (1S,2S)-N-p-toluenesulfonyl-1,2-diphenylethylenediamine; |
| CabN-DIC | [iPrNC(1,2-C2B10H10)(NiPr); |
| CabN-DCC | CyNC(1,2-C2B10H10)-(NCy)]; |
| Cy | cyclohexyl; |
| dippe |
iPr2PCH2CH2PiPr2; |
| BLR | bis(1,3-diisopropyl-4,5-dimethylimidazolin-2-imino)ethane or 1,2-bis(1,3,4,5-tetramethylimidazolin-2-imino)ethane. |
Acknowledgements
We thank the ERC (Grant no 247450), Science City (AWM/ERDF), the Swiss National Science Foundation (Grant No PBNEP2-134393) for NPEB support and the EPSRC (Grant EP/F042159) for the provision of computing hardware.
Notes and references
- M. J. Tenorio, K. Mereiter, M. C. Puerta and P. Valerga, J. Am. Chem. Soc., 2000, 122, 11230–11231 CrossRef CAS; C. Gemel, K. Mereiter, R. Schmid and K. Kirchner, Organometallics, 1997, 16, 5601–5603 CrossRef; J. W. Faller and J. Parr, Organometallics, 2001, 20, 697–699 CrossRef; B. K. Campion, R. H. Heyn and T. D. Tilley, J. Chem. Soc., Chem. Commun., 1988, 278–280 RSC; P. B. Glaser and T. D. Tilley, Eur. J. Inorg. Chem., 2001, 2747–2750 CrossRef; J. S. Figueroa and C. C. Cummins, J. Am. Chem. Soc., 2003, 125, 4020–4021 CrossRef; R. Poli, Chem. Rev., 1996, 96, 2135–2204 CrossRef.
- K.-J. Haack, S. Hashiguchi, A. Fujii, T. Ikariya and R. Noyori, Angew. Chem., Int. Ed. Engl., 1997, 36, 285–288 CrossRef CAS; M. Yamakawa, H. Ito and R. Noyori, J. Am. Chem. Soc., 2000, 122, 1466–1478 CrossRef; R. Noyori, M. Yamakawa and S. Hashiguchi, J. Org. Chem., 2001, 66, 7931–7944 CrossRef; R. Noyori, Angew. Chem., Int. Ed., 2002, 41, 2008–2022 CrossRef.
- M. Lamberti, G. C. Fortman, A. Poater, J. Broggi, A. M. Z. Slawin, L. Cavallo and S. P. Nolan, Organometallics, 2012, 31, 756–767 CrossRef CAS.
- P. Nun, G. C. Fortman, A. M. Z. Slawin and S. P. Nolan, Organometallics, 2011, 30, 6347–6350 CrossRef CAS; Y. Shvo, D. Czarkie, Y. Rahamim and D. F. Chodosh, J. Am. Chem. Soc., 1986, 108, 7400–7402 CrossRef; R. Karvembu, R. Prabhakaran and K. Natarajan, Coord. Chem. Rev., 2005, 249, 911–918 CrossRef.
- R. Noyori and S. Hashigushi, Acc. Chem. Res., 1997, 30, 97–102 CrossRef CAS.
- M. Herberhold, H. Yan and W. Milius, J. Organomet. Chem., 2000, 598, 142–149 CrossRef CAS.
- N. P. E. Barry and P. J. Sadler, Chem. Soc. Rev., 2012, 41, 3264–3279 RSC.
- S. Liu, G.-L. Wang and G.-X. Jin, Dalton Trans., 2008, 425–432 RSC; S. Liu, S. J. S. Zhang, X. Wang and G.-X. Jin, Dalton Trans., 2006, 5225–5230 RSC; J.-Q. Wang, C.-X. Ren and G.-X. Jin, Eur. J. Inorg. Chem., 2006, 3274–3282 CrossRef CAS; J.-Q. Wang, C.-X. Ren and G.-X. Jin, Chem. Commun., 2005, 4738–4740 RSC; Y.-F. Han, J. Zhang, Y.-J. Lin, J. Dai and G.-X. Jin, J. Organomet. Chem., 2007, 692, 4545–4550 CrossRef.
- S. Lu, G.-X. Jin, S. Eibl, M. Herberhold and Y. Xin, Organometallics, 2002, 21, 2533–2535 CrossRef CAS; X. Meng, F.-S. Wang and G.-X. Jin, Coord. Chem. Rev., 2010, 254, 1260–1272 CrossRef.
- M. Herberhold, H. Yan, W. Milius and B. Wrackmeyer, Chem.–Eur. J., 2000, 6, 3026–3032 CrossRef CAS.
- X. Wang, S. Liu, L.-H. Weng and G.-X. Jin, Chem.–Eur. J., 2007, 13, 188–195 CrossRef CAS.
- S. Liu, Y.-F. Han and G.-X. Jin, Chem. Soc. Rev., 2007, 36, 1543–1560 RSC.
- D.-H. Wu, C.-H. Wu, Y.-Z. Li, D.-D. Guo, X.-M. Wang and H. Yan, Dalton Trans., 2009, 285–290 RSC; C.-H. Wu, D.-H. Wu, X. Liu, G. Guoyiqibayi, D.-D. Guo, G. Lv, X.-M. Wang, H. Yan, H. Jiang and Z.-H. Lu, Inorg. Chem., 2009, 48, 2352–2354 CrossRef CAS.
- J. Hu, T. Xu and Y. Cheng, Chem. Rev., 2012, 112, 3856–3389 CrossRef CAS; M. A. C. Broeren, B. F. M. de Waal, M. H. P. van Genderen, H. M. H. F. Sanders, G. Fytas and E. W. Meijer, J. Am. Chem. Soc., 2005, 127, 10334–10343 CrossRef;
C. P. Slichter, Principles of Magnetic Resonance, Springer, New York, 2010 CrossRef; X. D. Xu, H. B. Yang, Y. R. Zheng, K. Ghosh, M. M. Lyndon, D. C. Muddiman and P. J. Stang, J. Org. Chem., 2010, 75, 7373–7380 CrossRef.
- Z.-W. Xu, L. Han, C. Ji, R. Zhang, X.-J. Shen and H. Yan, Dalton Trans., 2011, 40, 6992–6997 RSC.
- V. I. Bregadze, Chem. Rev., 1992, 92, 209–223 CrossRef CAS.
-
Y. Tsukube, H. Furuta, A. Odani, Y. Takeda, Y. Kudo, Y. Inoue, Y. Liu, H. Sakamoto and K. Kimura, in Comprehensive Supramolecular Chemistry, ed. J. L. Atwood, J. E. D. Davies, D. D. Macnicol and F. Vögtle, Pergamon Press, Oxford, 1996, pp. 425–482 Search PubMed.
- P. Thordarson, Chem. Soc. Rev., 2011, 40, 1305–1323 RSC.
-
P. Thordarson, in Supramolecular Chemistry: From Molecules to Nanomaterials, ed. J. W. Steed and P. A. Gale, John Wiley & Sons, Online, 2012, pp. 239–274 Search PubMed.
-
S. Kotrly and L. Šůcha, in Handbook of Chemical Equilibria in Analytical Chemistry, ed. R. A. Chalmers and M. Masson, John Wiley & Sons, Chichester, 1985, pp. 87–108 Search PubMed.
- D. Petrovic, C. G. Hrib, S. Randoll, P. G. Jones and M. Tamm, Organometallics, 2008, 27, 778–783 CrossRef CAS.
- V. V. K. M. Kandepi, J. M. S. Cardoso, E. Peris and B. Royo, Organometallics, 2010, 29, 2777–2782 CrossRef CAS.
- M. Lamberti, G. C. Fortman, A. Poater, J. Broggi, A. M. Z. Slawin, L. Cavallo and S. P. Nolan, Organometallics, 2012, 31, 756–767 CrossRef CAS.
- P. Nun, G. C. Fortman, A. M. Z. Slawin and S. P. Nolan, Organometallics, 2011, 30, 6347–6350 CrossRef CAS.
- M. Bierenstiel, M. Dymarska, E. de Jong and M. Schlaf, J. Mol. Catal. A: Chem., 2008, 290, 1–14 CrossRef CAS.
- K.-J. Haack, S. Hashiguchi, A. Fujii, T. Ikariya and R. Noyori, Angew. Chem., Int. Ed. Engl., 1997, 36, 285–288 CrossRef CAS.
- H. Aneetha, M. Jiménez-Tenorio, M. C. Puerta, P. Valerga, V. N. Sapunov, R. Schmid, K. Kirchner and K. Mereiter, Organometallics, 2002, 21, 5334–5346 CrossRef CAS.
- W.-M. Cheung, Q.-F. Zhang, I. D. Wiliams and W.-H. Leung, Inorg. Chim. Acta, 2006, 359, 782–788 CrossRef CAS.
- P. B. Glaser and T. D. Tilley, Eur. J. Inorg. Chem., 2001, 2747–2750 CrossRef CAS.
- D.-H. Kim, J. Ko, K. Park, S. Cho and S. O. Kang, Organometallics, 1999, 18, 2738–2740 CrossRef CAS.
- M. Herberhold, G.-X. Jin, H. Yan, W. Milius and B. Wrackmeyer, J. Organomet. Chem., 1999, 587, 252–257 CrossRef CAS.
- Z.-J. Yao, G. Su and G.-X. Jin, Chem.–Eur. J., 2011, 17, 13298–13307 CrossRef CAS.
- X. Meng, Y.-J. Lin and G.-X. Jin, J. Organomet. Chem., 2008, 693, 2597–2602 CrossRef CAS.
Footnote |
| † Electronic supplementary information (ESI) available: Experimental section (materials, instrumentation, synthesis of complexes 2–6, methods), Tables S1–S5, and Fig. S1–S4. CCDC 907840 and 907841. For ESI and crystallographic data in CIF or other electronic format see DOI: 10.1039/c2dt32650g |
|
| This journal is © The Royal Society of Chemistry 2013 |
Click here to see how this site uses Cookies. View our privacy policy here.