Barium, calcium and magnesium doped mesoporous ceria supported gold nanoparticle for benzyl alcohol oxidation using molecular O2†
Chiranjit
Santra
a,
Sumbul
Rahman
a,
Sreedhar
Bojja
*b,
Olusola O.
James
c,
Debasis
Sen
d,
Sudip
Maity
c,
Ashok Kumar
Mohanty
e,
S.
Mazumder
d and
Biswajit
Chowdhury
*a
aDepartment of Applied Chemistry, Indian School of Mines, Dhanbad, India. E-mail: biswajit_chem2003@yahoo.com; Fax: +91-326-2296563; Tel: +91-326-2235663
bInorganic and Physical Chemistry Division, Indian Institute of Chemical Technology, Hyderabad, India
cCentral Institute of Mining and Fuel Research, Dhanbad, India
dSolid State Physics Division, Bhabha Atomic Research Center, Mumbai, India
eNational Metallurgical Laboratory, Jamshedpur, India
First published on 4th September 2012
Abstract
In the era of sustainable energy, catalysis using gold nanoparticles has drawn considerable attention from world researchers. Oxidation of benzyl alcohol by molecular O2 is an atom efficient path to synthesize benzaldehyde. Nanocrystalline ceria has been proven as a useful support to disperse gold nanoparticles since last few years, however there are a few reports on mesoporous ceria supported gold nanoparticles. In this work a systematic investigation was carried out to improve the activity of Au/CeO2 catalyst by incorporating Ba2+, Ca2+ and Mg2+ cations into the ceria lattice through a sol–gel procedure. Both the doped ceria and ceria supported gold nanoparticles are characterized by BET S.A, XRD, TEM, SAXS, XPS, TPR, CO2-TPD techniques. BET S.A measurements show the mesoporous oxides where H3 hysteresis loops are found. The decrease in the crystallite size of ceria after doping by metal cations is observed in the XRD measurement. The TEM and HRTEM characterization shows the nanocrystalline particle size around 30–50 nm and gold nanoparticles around 10–15 nm in size. Distribution in the particle size for doped ceria have been obtained using SAXS measurements where narrow distributions of ceria particles are found in the 10–20 nm range. The existence of oxide vacancies and the mixture of Ce3+/Ce4+ oxidation states are observed for doped ceria materials in the XPS investigation. The strong gold-support interaction was also evidenced by XPS characterization where oxidic gold was found on the doped ceria surface. Lowering of the reduction peak in ceria after gold nanoparticle deposition was observed from TPR investigation whereas the change in basic site distribution is observed from CO2 TPD experiment, instigating new insights into the surface properties of the catalysts. The catalytic activities of the catalysts were determined for benzyl alcohol oxidation reactions using molecular O2. The catalytic activity was in the order of Au/Ba–CeO2 > Au/Ca–CeO2 > Au/Mg–CeO2 > Au/CeO2. The synergistic effect of gold nanoparticles and dopant cations to the ceria was explained in this work.
Introduction
Research on the unusual properties of gold nanoparticles compared to bulk gold has been well nurtured in the past few decades. Pioneering reports on hydrochlorination of acetylene by Prof. Hutchings1 and the catalytic action of gold nanoparticles for CO oxidation by Prof. Haruta2 had continued to nurture several other explorations and exploitations of gold nanoparticles for green chemistry practices.3–6 For different reactions in which gold nanoparticles display catalytic activity, selective oxidation of alcohols to carbonyl compounds has attracted special attention because of its importance in organic synthesis at both laboratory and industrial level.7–10 In particular, selective liquid phase aerobic oxidation of alcohols to corresponding carbonyl compounds using solid catalysts under mild conditions is a shared desire from an economic and environmental perspectives.11,12Synthesis and development of CeO2 nanomaterials13,14 with enhanced thermal, redox and acid–base properties is of paramount interest in designing catalysts for specific catalytic reactions. For example, in three-way catalysis (TWC) for the treatment of automotive internal combustion of engine exhaust gases, one of the most important properties of ceria is oxygen storage capacity, due to the Ce4+/Ce3+ redox cycles between its lattice ions.15 Doping of lower valent cations to the ceria is also a common strategy for tuning reducibility and OSC of ceria for lower temperature applications.16–19 Oxygen storage capacity (OSC) of ceria is related to its reducibility which in turn depends on the morphology of its crystallites.
There is an attraction to use doped ceria as a support for gold nanoparticles in the oxidation reactions because of the anticipated synergistic effect between gold nanoparticles and ceria via its lattice oxygen vacancy.20,21 Though there are a number of reports for using doped ceria as a support for gold nanoparticles in the case of CO oxidation reactions there are however few reports to show the role of dopant cation on the activity of oxidation of benzyl alcohol. In fact work on non siliceous mesoporous oxides have instigated the material researcher to develop synthetic strategies for different porous oxides.22,23 A recent report by Chowdhury et al., revealed that doping can influence surface acid–base properties of mesoporous ceria and its catalytic behaviour.24 This aspect of doped ceria materials has received less attention. Thus in this contribution, we attempt to investigate the influence of alkaline (Ba2+, Ca2+, Mg2+) doping on morphology, redox and acid–base properties of the mesoporous ceria which can tune the activity of gold nanoparticles. We introduced Ba2+, Ca2+, Mg2+ (dopant to cerium molar ratio 4/100) to the ceria lattice by sol–gel procedure using triethanolamine–water mixture as a solvent. It is anticipated that incorporation of the cations into a ceria lattice structure will influence redox and acid–base properties of ceria in favour of synergistic interactions with gold nanoparticles towards enhanced activity for aerobic oxidation benzyl alcohol to benzaldehyde.
Experimental
Catalyst preparation
![[thin space (1/6-em)]](https://www.rsc.org/images/entities/char_2009.gif) :Ce:H2O:Ba/Mg/Ca:TEAOH 0.2:0.1:1.1:0.004:0.1. The gel was aged for 24 h under stirring conditions then dried at 110 °C for 24 h and calcined at 700 °C for 10 h with temperature ramp 1 °C min−1.
:Ce:H2O:Ba/Mg/Ca:TEAOH 0.2:0.1:1.1:0.004:0.1. The gel was aged for 24 h under stirring conditions then dried at 110 °C for 24 h and calcined at 700 °C for 10 h with temperature ramp 1 °C min−1.
Catalyst characterization
θ; λ: wave-length of X-ray, LVol: Volume weighted crystallite size, θ: angle of diffraction angle) of domain-size broadening which is independent of the crystallite shape. This conception directly leads to a formula identical with the Scherrer equation except that the constant assumes a value of unity.
Results and discussions
BET S.A and porosity measurement
The representative results obtained from BET S.A and porosity analysis for Ca–CeO2 are depicted in Fig. 1 and Table 1. A close look at the isotherm reveals that there is much less adsorption in the low pressure region and the hysteresis loop is almost like an H3 isotherm. This may be attributed to the so called pore blocking or percolation effect.28 The effect is expected to occur when the pore has access to the external surface only through a narrower neck as in an ink bottle pore.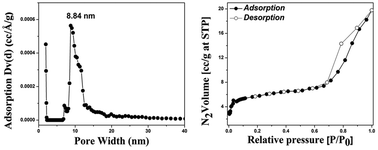 | ||
| Fig. 1 BET S.A and pore size distribution of Ca–CeO2 (Ca/Ce = 4/100). | ||
| Catalyst | Surface area (m2 g−1) | Pore size (nm) | Pore volume (cc g−1) |
|---|---|---|---|
| CeO2 | 4 | — | — |
| CaCeO2 | 20 | 8.84 | 0.03 |
| BaCeO2 | 10 | 3.06 | 0.01 |
| MgCeO2 | 7 | 2.98 | 0.01 |
The wide body of an ink bottle pore is filled at the vapour pressure which corresponds to the delayed condensation and remains filled during desorption until the narrow neck empties first at a lower vapour pressure. Thus in a network of ink bottle pores evaporation of the capillary condensate is obstructed by the pore necks. As observed in the case of Ba–CeO2, Mg–CeO2 (ESI†) and Ca–CeO2 the porous network is different in each case because of surface heterogeneity, particle size varies in one to another. For both the Ba–CeO2 and Mg–CeO2 surface area is less however for Ca–CeO2 the surface area is 20 m2 g−1.
The presence of mesoporosity is confirmed from the pore size distribution where the NLDFT (Non linear density functional theory) model29 is adopted to calculate the pore size assuming the cylindrical pores. The surface area of CeO2 is very low whereas higher surface area, different porosity and pore volume in three different samples indicate the role of dopant alkaline cation during sol–gel synthesis as the gelation step is highly dependent on the basicity of the medium.
X-ray diffraction (XRD)
The XRD pattern of CeO2 and Ba, Ca and Mg doped CeO2 oxides are depicted in Fig. 2. The peaks of all the samples could be indexed as (111), (200), (220), (311), (222), (400) planes of cubic fluorite structure (Space Group: Fm3m, JCPDS 34-0394) of CeO2. As depicted in Table 2 the particle sizes of doped CeO2 are found to be lower for all the doped CeO2. The crystallite size was lowest for Ca–CeO2 compared to Mg–CeO2 and Ba–CeO2 as calculated from XRD analysis. The higher surface area and mesoporosity were observed for Ca–CeO2 as described in the earlier section. The small angle X-ray scattering (SAXS), which is described in the later section, was done to verify the size distribution of the doped ceria. The lattice parameter of the BaCeO2 was increased compared to MgCeO2 which strongly emphasizes the incorporation of Ba to the CeO2 as the size of Ba2+ is higher (1.49 Å) than Mg2+ (0.86 Å).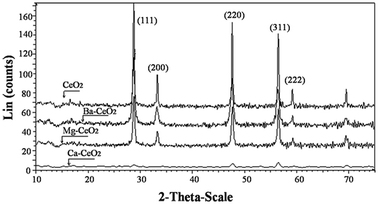 | ||
| Fig. 2 XRD pattern of the (a) CeO2, (b) Ba–CeO2 (Ba/Ce = 4/100), (c) Mg–CeO2 (Mg/Ce = 4/100), (d) Ca–CeO2 (Ca/Ce = 4/100). | ||
| Catalyst | Phase | d(111) (Å) | Crystallite size (Å) |
|---|---|---|---|
| MgCeO2 | Cerianite-(Ce) | 3.1086 | 286 |
| BaCeO2 | Cerianite-(Ce) | 3.1153 | 205 |
| CaCeO2 | Cerianite-(Ce) | 3.0983 | 112 |
| CeO2 | Cerianite-(Ce) | 3.1106 | 547 |
The non existence of any peak corresponding to the individual oxide or hydroxides of Ba, Ca and Mg reveal the formation of nanocrystalline solid solution of the metal cations into the ceria lattice. Tsunekawa30et al. investigated the lattice expansion of the CeO2 nanoparticles, and they found that “the reduction of the valence induces an increase in the lattice constant due to the decrease in electrostatic forces”. However, Rietveld refinement of the XRD pattern will not be an ideal to investigate whether the dopant (Ba2+, Ca2+ and Mg2+) is dispersed on the ceria surface and its local chemical environment. Therefore XPS characterization was undertaken which is described in the later section.
TEM (transmission electron microscopy) and HRTEM (high resolution transmission electron microscopy)
The TEM images obtained from CeO2, Ba–CeO2, Mg–CeO2 and Ca–CeO2 materials are displayed in Fig. 3. The nanocrystalline particles are observed in 20–30 nm size range similarly to the results obtained from earlier XRD studies. In the present case the preparation procedure is a sol–gel process using triethanolamine–H2O mixture which we have adopted instead of a precipitation method. In the precipitation method because of the strong basicity and higher charge, Ce4+ ions usually undergo strong hydration resulting in the formation of [Ce(H2O)x(OH)y](4−y)+ complex, where (x + y) is the coordination number of Ce4+. Now in the preparation procedure adopted here there was no pinkish purple colour noticed, it is expected that Ce 4+ did not form any complex with H2O and OH− despite the fact that both H2O and OH− ions were present in the solution. As reported in the literature31 there might be a possibility of [Ce(H2O)n(OH)y](4−y)+ and [Ce(TEA)2(NO3)](NO3)2 complex in the solution. Rapid deprotonation of [Ce(H2O)n(OH)y(4−y)+ has a significant effect on the morphology of the nanocrystalline CeO2 powder due to the polymeric nature of [Ce(H2O)n(OH)y](4−y)+ which might act as a nucleation centre.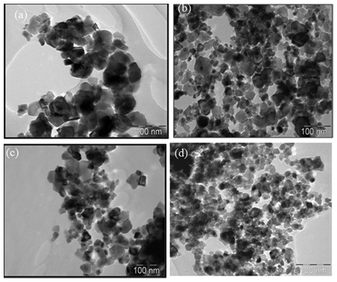 | ||
| Fig. 3 TEM image of (a) CeO2, (b) Ca–CeO2(Ca/Ce = 4/100), (c) Mg–CeO2(Mg/Ce = 4/100), (d) Ba–CeO2(Ba/Ce = 4/100). | ||
Therefore the presence of highly basic cations might influence the complex formation of TEA and Ce4+ resulting in different morphologies as revealed in the TEM study. In fact during nanoparticle formation, nucleation and growth are the main cause towards its size distribution. As reported by Jiang et al.32 for the synthesis of ZnO nanoparticles, TEA hinders the anisotropic growth by adsorbing on its crystal plane and forming microspheres.
The TEM images and particle size distribution of gold nanoparticles for Au/CeO2, Au/Ba–CeO2, Au/Ca–CeO2 and Au/Mg–CeO2 are presented in Fig. 4. The Au/Ba–CeO2 had smaller particles in the size range 3–4 nm compared to other gold deposited supports.
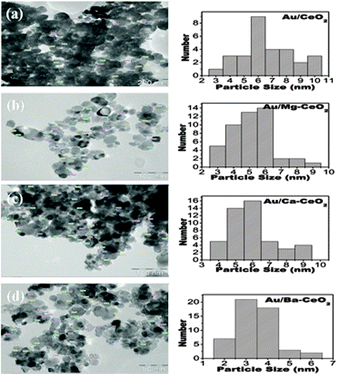 | ||
| Fig. 4 TEM image and particle size distribution of (a) Au/CeO2, (b) Au/Mg–CeO2(Mg/Ce = 4/100), (c) Au/Ca–CeO2(Ca/Ce = 4/100), (d) Au/Ba–CeO2(Ba/Ce = 4/100). | ||
The HRTEM image of Au/Ba–CeO2 was shown in Fig. 5 where smaller gold nanoparticles in the 3–4 nm range are distinctly visible.
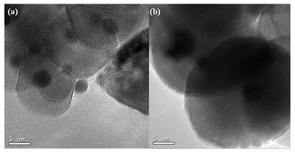 | ||
| Fig. 5 HRTEM image of (a) and (b) Au/Ba–CeO2 (Ba/Ce = 4/100). | ||
Small angle X-ray scattering (SAXS) studies
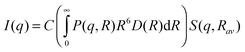
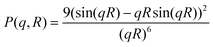
The scattered intensities I(q) were recorded as a function of scattering vector q(= 4π sin(θ)/λ, where 2θ is the scattering angle, and λ is the X-ray wavelength). Fig. 6 shows the SAXS profiles of all the samples. To obtain the particle size distribution, SAXS data were analyzed in the light of a polydisperse spherical particle model. For such a case, I(q) may be approximated aswhere, P(q,R) represents the form factor of a spherical particle of radius R, i.e.,
D(R) represents the particle size distribution, i.e., D(R)dR indicates the probability of having size R to R + dR.
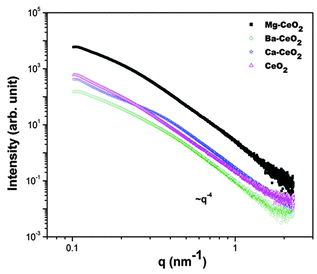 | ||
| Fig. 6 SAXS data from the Ceria samples. | ||
In the present case, a standard log normal distribution was assumed. S(q,Rav) represents the inter-particle structure factor with Rav representing average R value. In the present case, a fractal like33 interparticle structure factor was assumed for Ca–CeO2. For other CeO2, Ba–CeO2, Mg–CeO2, consideration of structure factor was not required during fitting of the model to the experimental data. The fitting of the above model to the experimental data are shown in the Fig. 7.
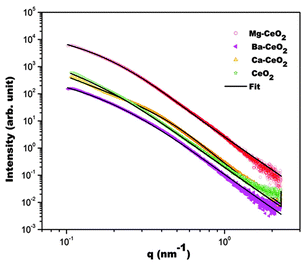 | ||
| Fig. 7 Fitting of the model to the experimental SAXS data is compared (solid line represents the fit in each case). | ||
The estimated size distributions are plotted in Fig. 8. It is found that except Mg–CeO2 all the other samples have a narrow size distribution indicating the surface homogeneity in those cases.
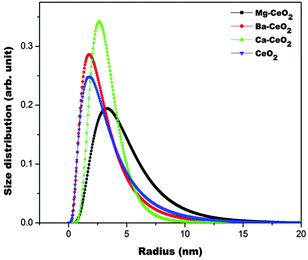 | ||
| Fig. 8 Particle size distribution as obtained from the fitting of the model curve to the experimental SAXS data. | ||
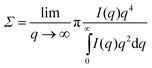
From SAXS, the data specific surface area (Σ = S/V) was calculated using the formula results as shown in Table 3. The higher surface area of Ca–CeO2 supports the results obtained from BET measurement studies.
| Catalyst | Specific surface area |
|---|---|
| CeO2 | 5.8 × 10⁸ m−1 |
| CaCeO2 | 8.2 × 10⁸ m−1 |
| BaCeO2 | 7.0 × 10⁸ m−1 |
| MgCeO2 | 5.6 × 10⁸ m−1 |
X-ray photoelectron spectroscopy (XPS)
XPS has remained as a pivotal technique to identify the oxidation state, chemical environment of the element present in the surface.34,35 No peak due to residual Na and Cl are observed in the XPS survey (ESI†). The presence of Ba, Ca and Mg over the ceria surface is confirmed using XPS spectroscopy and the results are shown in Fig. 9.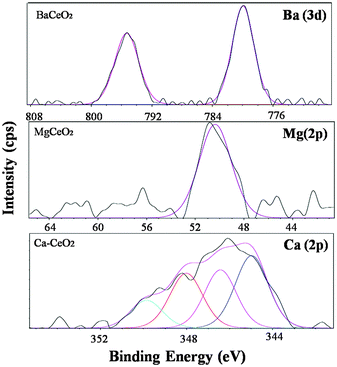 | ||
| Fig. 9 XPS spectra for Ba (3d), Ca (2p), Mg (2p) core level electrons. | ||
The two peaks due to Ba 3d5/2 and 3d3/2 are observed at 779.9 eV and 795.3 eV respectively in the Ba–CeO2 catalyst. The peak around 779.0 eV can be assigned to the Ba2+ species.36 The Mg 2p core electron binding energy was around 50.397 eV in the case of Mg–CeO2 which indicates the existence of all the Mg species in the Mg2+ state.37 In the Ca–CeO2 catalyst, the Ca 2p core electron shows binding energy around 344.9 eV and another one around 348.0 eV which is typical of the Ca2+ oxidation state.38 To investigate the nature of the interaction between the metal center (Ba2+, Ca2+ and Mg2+) in the doped ceria before and after gold deposition, we need to analyze the Ce (3d), O (1s) and Au (4f) core electron binding energies as described in the following section.
The core level binding energy for Ce 3d5/2 and Ce 3d3/2 of the samples as well as quantitative analysis show some interesting features (ESI†). Cerium compounds are known to exhibit rather complex features due to hybridization with ligand orbitals and fractional occupancy of the valence 4f orbitals.24 The peaks around 882.4 eV, 887 eV, 890 eV and 897.9 eV are denoted as V, V′, V′′, V′′′ where as peaks at 900.4 eV, 904.1 eV, 908.1 eV and 916.1 eV are denoted by U, U′,U′′ and U′′′. The peaks labelled U are due to 3d3/2 spin-orbit states, and those labelled V are due to the corresponding 3d5/2 states. The U′′′/V′′′ doublet is due to the primary photoemission from Ce(IV)O2i.e. Ce 3d9 4f0 O 2p6 Ce(IV). The U/V and U′′/V′′ doublets are shakedown features resulting from the transfer of one or two electrons from a filled O 2 p orbital to an empty Ce 4f orbital, i.e. Ce 3d9 4f2 O 2p4 and Ce 3d9 4f1 O 2p5 Ce(IV) in the final states. The U′/V′ doublet is due to photoemission from Ce cations, i.e. Ce 3d9 4f1 O 2p6 of Ce (III). The spin-orbit splitting of V′′/U′′ is 18.0 eV is in the same order reported in literature.39 The presence of U′′/V′′ doublet peaks in the spectrum indicates that the sample contains some oxygen vacancies and is in a partially reduced state. The Ce 3d spectrum basically denotes a mixture of Ce3+/Ce4+ oxidation states giving rise to a myriad of peaks indicating that the surface of the sample is not fully oxidized.40 It is also proposed that the concentration of oxygen vacancies in ceria is related to the particle sizes, and smaller nanoparticles possess a higher concentration of oxygen vacancies. As the hierarchically structured ceria fabricated in this work consist of nanosized crystals of ceria as building units which is evidenced from XRD, TEM and SAXS investigations in the earlier section, a high concentration of the oxygen vacancy would be expected. Indeed, recent theoretical calculations of unsupported CenO2n−x(n) clusters by Loschen et al.41 showed the formation of Ce3+ ions on the corner and edge sites, the relative amount of which increases with decreasing particle size. Interestingly we found that Ca–CeO2 had the smallest particle size from the XRD measurement which has a maximum Ce3+/Ce4+ ratio as observed from XPS quantitative analysis. Apart from that partial photoreduction of CeO2 during XPS measurements is a well-known fact in the literature. The reduction is mainly due to the progressive elimination of surface hydroxyls and oxygen ions from the CeO2 surface upon vacuum treatment.40 The Ce 3d spectrum after gold deposition shows a shift in the binding energy of the peak due to Ce3+ for Ba–CeO2, Ca–CeO2, Mg–CeO2 towards higher value compare to Au/CeO2. This clearly indicates the strong gold-support interaction and also highlights synergistic behaviour of both gold and dopant cation. Therefore we need a look to the XPS pattern of Au species in the later section.
The representative O (1s) spectrum of CeO2 and metal (Ca, Mg, Ba) doped CeO2 have been investigated (ESI†). Though there is a possibility of several types of oxygen species in the doped ceria however the O 1s spectra consisted mainly of three peaks; a dominant one at energy 529.2 eV, another at 531.4 eV along with a peak at 533.5 eV. The one at 529.2 eV is the oxygen present in the CeO2 lattice. The peak at 531.0 eV is due to Ce2O3 which is more covalent in nature. The weak third peak at a higher binding energy may be due to adsorbed oxygen species (from adsorbed water).42 There is a shift of O1s peak (529.0 eV) towards the lower energy side after Ca2+ and Mg2+ insertion however for Ba2+ the position remained almost unchanged. As doping of lower valent cations either to the CeO2 lattice or Ce2O3 lattice generate excess negative charge shifting the O (1s) binding energy to the lower binding energy side. Interestingly for the BaCeO2 sample the position of the 531.0 eV peak shifted to higher value which may due to a change in the covalent nature of the ceria–oxygen bond.
The O (1s) spectra obtained for Au deposited undoped and doped ceria (ESI†) show a large shift of O (1s) binding energy (both for Ce2O3 and CeO2) towards higher values for Ca2+ and Mg2+ doped samples. Though for the Ba2+ doped sample there is a shift to the higher side but it is to a lesser extent compared to other counterparts. From the results it can be speculated that lattice oxygen is tightly bound for Au/Ca–CeO2 and Au/Mg–CeO2 but for Au/Ba–CeO2 it is weakly bound. Also it is interesting to note that interactions between gold and doped ceria are synergistic in nature where the dopant cation is having a decisive role towards the binding energy shift. May be the gold nanoparticles reside on the oxide vacancies in the doped ceria resulting strong interaction between gold and ceria. It is well known that in the oxidation reaction, nucleophilic lattice oxygen can be inserted into the activated organic molecule leading to oxygenated product.
The XPS spectrum obtained for Au (4f) core electrons is depicted in Fig. 10. The major peaks are in 83.0–84.0 eV, 86.7–88.0 eV. The binding energies of the gold metal were reported as 4f level at 83.9 eV (Au 4f7/2) and 87.7 eV (Au 4f5/2). It is well documented in the literature that Au species present as metallic Au0, Au+ and Au3+ species depending on the size of gold nanoparticles and the nature of supports. As reported by Visco et al.43 both Au0 and Au3+ species was found in Au/Fe2O3 catalyst whereas Soares et al.44 reported that for Au/TiO2 catalysts prepared by the deposition–precipitation method, there was only metallic gold present.
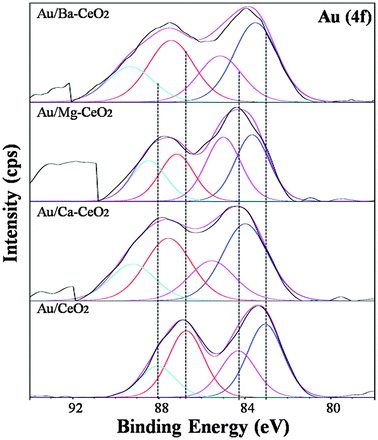 | ||
| Fig. 10 Au 4f core level XPS spectra of (a) Au/ Ba–CeO2 (Ba/Ce = 4/100), (b) Au/Mg–CeO2 (Mg/Ce = 4/100), (c) Au/Ca–CeO2 (Ca/Ce = 4/100), (d) Au/CeO2. | ||
When gold nanoparticles are deposited on Ba–CeO2, Ca–CeO2 and Mg–CeO2 the Au 4f binding energy is shifted towards higher values indicating formation of more oxidic gold on the catalyst surface. The absence of a chlorine peak in the photoelectron spectra indicates the elimination of chlorine during washing. The presence of peakes due to oxidic gold must be attributed to Au–oxygen-containing species of the Au+ and Au3+ types. Oxidic gold species pull the electron from oxygen thereby increasing the core electron binding energy as evidenced from Fig. 10.
The unresolved issue is the oxidation state of the Au active site during the oxidation reaction. Some researchers claim the ionic Au as the active species.45,46 One model proposed is an ensemble consisting of metallic Au and Au–OH species.47,48 In contrast, other researcher proposals that the active site is metallic Au, which is based on the fact that the only detectable species is metallic Au on an active catalyst.
TPR (temperature programmed reduction)
Fig. 11 shows the TPR profiles of doped and undoped ceria supports. The profiles depict typical reduction peaks at about 550 °C and 800 °C. Peaks between the range at 0 ≤ x ≤ 600 °C are relevant to redox properties of ceria, peak temperatures and hydrogen consumptions of these peaks provides a measure of reducibility and OSC of supports,49 hence our focus is on the peaks in this temperature for the discussion of the catalytic properties of the supports. We found that alkaline cation doping enhanced the OSC of ceria in order of increasing ionic radius (Fig. 12).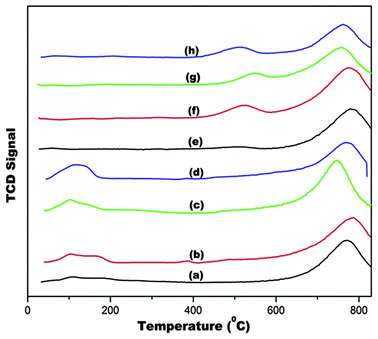 | ||
| Fig. 11 H2-TPR of (a) Au/CeO2, (b) Au/Mg–CeO2 (Mg/Ce = 4/100), (c) Au/Ca–CeO2 (Ca/Ce = 4/100), (d) Au/Ba–CeO2 (Ba/Ce = 4/100), (e) CeO2, (f) Mg–CeO2 (Mg/Ce = 4/100), (g) Ca–CeO2 (Ca/Ce = 4/100), (h) Ba–CeO2 (Ba/Ce = 4/100). | ||
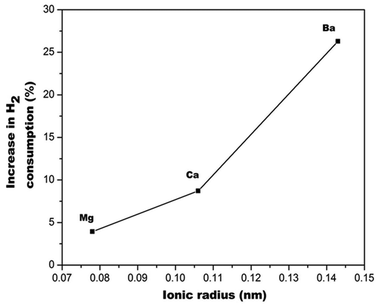 | ||
| Fig. 12 Percentage in H2 consumption of doped relative to undoped ceria. | ||
Theoretical calculations by Kehoe et al., indicated the same order for reduction energies for alkaline cations doped ceria.50Fig. 13 showed that ceria reducibility is virtually unaffected for Mg–CeO2, Ca–CeO2 but enhanced by barium doping. The reduction peaks are lowered by 400 °C (Fig. 11) when gold nanoparticles are deposited on the supports. It appears that the gold nanoparticles are located in the oxygen vacancies in the supports. This close proximity and hydrogen spill-over effect by gold nanoparticles account for lowering of the reduction temperature.
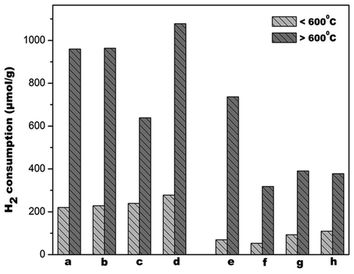 | ||
| Fig. 13 H2 consumption from TPR profiles of the catalysts (a) CeO2, (b) Mg–CeO2 (Mg/Ce = 4/100), (c) Ca–CeO2 (Ca/Ce = 4/100), (d) Ba–CeO2 (Ba/Ce = 4/100), (e) Au/CeO2, (f) Au/Mg–CeO2 (Mg/Ce = 4/100), (g) Au/Ca–CeO2 (Ca/Ce = 4/100), (h) Au/Ba–CeO2 (Ba/Ce = 4/100). | ||
Fig. 14 shows CO2 desorption profiles of the ceria supports and corresponding gold deposited catalysts. Desorption temperature and amount of CO2 desorbed are measures of basic strength and site density, respectively. For comparative analysis, the profiles are demarcated into temperature ranges: 50–250 °C, 250–500 °C and 500–800 °C and are designated as weak, medium and strong basic sites, respectively. Although the basicity of alkaline cations increases with increasing order of ionic radius, basic site distribution of the supports and the catalysts did not depict the same trend (Fig. 15). Basicity of doped material depends on the nature of defects created and coordination behaviour of dopants. It is observed from XPS studies described in an earlier section, that there are different types of electronic interaction between dopant cation, cerium, oxygen and gold atoms.
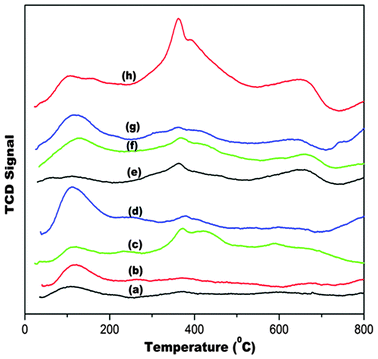 | ||
| Fig. 14 CO2-TPD of (a) Au/CeO2, (b) Au/Mg–CeO2 (Mg/Ce = 4/100), (c) Au/Ca–CeO2 (Ca/Ce = 4/100), (d) Au/Ba–CeO2 (Ba/Ce = 4/100), (e) CeO2, (f) Ca–CeO2 (Ca/Ce = 4/100), (g) Ba–CeO2 (Ba/Ce = 4/100), (h) Mg–CeO2 (Mg/Ce = 4/100). | ||
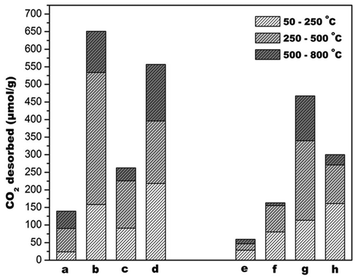 | ||
| Fig. 15 CO2 desorbed from TPD profiles of the catalysts (a) CeO2, (b) Mg–CeO2 (Mg/Ce = 4/100), (c) Ca–CeO2 (Ca/Ce = 4/100), (d) Ba–CeO2 (Ba/Ce = 4/100), (e) Au/CeO2, (f) Au/Mg–CeO2 (Mg/Ce = 4/100), (g) Au/Ca–CeO2 (Ca/Ce = 4/100), (h) Au/Ba–CeO2 (Ba/Ce = 4/100). | ||
It had been shown that dopants in ceria prefer to assume coordination of their own oxides rather than that of cubic coordination of Ce4+.50 In addition, the nature of defect also depends on the relative size of dopant and doped ions. Because of its smaller size, Mg2+ may be located in the lattice interstitials rather than substituting the lattice site of Ce4+.51 This may account for why Mg-doped supports fall out of expected trends based on ionic radius. It also interesting that the site distributions change dramatically after gold deposition on the supports. Densities of medium and strong sites in undoped, Mg and Ba doped ceria decrease after gold deposition. They represent preferential location of the deposited gold nanoparticles. However, gold deposition increases the basicity of Ca-doped ceria. Surface basicity of a metal oxide is related to the ionic character of it surface oxygen species. As observed from the quantitative XPS analysis (ESI†) of O (1s) core electron binding energy there is a change in the percentage of ionic contribution of Au/Ca–CeO2 correlating to a higher basicity of the Au/Ca–CeO2 catalyst.
Catalytic activity results
The catalyst activity for benzyl alcohol oxidation using molecular O2 was measured for all of the samples. All the catalysts have high selectivity towards benzaldehyde as shown Table 4. The CeO2 had very low activity which was more for Ca–CeO2, Ba–CeO2, Mg–CeO2. However, it is very difficult to compare the activity of the above three catalysts. No leaching of dopants was observed for doped CeO2 as evidenced from EDS measurement (ESI†). There is a remarkable increase in the activity of doped ceria after gold deposition. The activity of Au/M–CeO2 (M = Ca, Ba, Mg) was higher compared to Au/CeO2 instigating a close look for the synergistic effect of gold nanoparticles and dopant cation.| Reactant | Catalyst | Actual gold loading (% Au)a | Conversion (%) | TOF# (h−1) | Selectivity (%) |
|---|---|---|---|---|---|
a Determined from ICP-OES measurement. Reaction condition: Toluene solvent, 4 ml; benzyl alcohol, 4 mmol; catalyst, 100 mg; O2, 50 ml min−1; reaction time, 3 h; dodecane used as an internal standard. |
|||||
| PhCH2OH | Mg–CeO2 (4 mol% doped) | — | 7.73 | — | >99 |
| PhCH2OH | Ba–CeO2 (4 mol% doped) | — | 9.62 | — | >99 |
| PhCH2OH | Ca–CeO2 (4 mol% doped) | — | 7.62 | — | >99 |
| PhCH2OH | CeO2 | — | 2.99 | — | >99 |
| PhCH2OH | 2.33 wt% of Au–CeO2 | 0.02 | 7.99 | 1049.58 | >99 |
| PhCH2OH | 2.33 wt% of Au–MgCeO2 | 0.10 | 13.07 | 343.25 | >99 |
| PhCH2OH | 2.33 wt% of Au–BaCeO2 | 0.03 | 36.80 | 3221.70 | >99 |
| PhCH2OH | 2.33 wt% of Au–CaCeO2 | 0.32 | 25.00 | 205.13 | >99 |
It is important to note that the charge transfer from supports to deposited gold clusters is crucial for enhanced catalytic activities. The activity of gold catalysts in the oxidation reactions is somewhat surprising, because dissociatively adsorbed oxygen is generally thought to be the active oxidant in related reactions on other noble metals.52 The origin of the catalytic activity in supported gold nanoparticles is still not well understood, with many questions remaining about the site of the reaction and the nature of the interaction between gold nanoparticles and the support on supported gold catalysts. It has been reported that there is a correlation between the stabilization of superoxide species and gold cationic sites for CO oxidation reaction.53
The Au/Ba–CeO2 catalyst is having the highest activity. The gold nanoparticles distributed over Ba–CeO2 supports have smaller sizes compare to other supports as evident from TEM and HRTEM studies described earlier. From the XPS characterization it is found that oxygen species is more labile in the Au/Ba–CeO2 catalyst. Also the TPR results infer that deposition of gold nanoparticles make Au/Ba–CeO2 more reducible as lowering of the reduction temperature is observed. As reported in the literature the adsorption of molecular O2 plays a dominant role for CO oxidation reaction54 and propylene epoxidation reaction.55 Therefore the gold nanoparticles acts as a centre for oxygen adsorption which spill over to the Ba–CeO2 surface making it highly active for alcohol oxidation. The basic site distribution on the Ba–CeO2 catalyst decreases after gold nanoparticle deposition, however similar observations were prominent for the Au/Mg–CeO2 catalyst. The Au/Mg–CeO2 catalyst has the lowest activity levels so the change of distribution of basic sites is responsible for the lower activity of the Au/Mg–CeO2 catalyst and redox sites are responsible for the Au/Ba–CeO2 catalyst. It has been shown that dehydrogenation of alcohols to aldehydes can take on metal oxides catalysts.56 The conversion involved the initial alkoxy intermediate formation on weak Lewis acid–strong Brønsted base site pairs. But the reaction is limited by removal of hydrogen. Thus, catalytic performance CeO2 for aerobic oxidation of benzyl alcohol can be attributed to dehydrogenation on acid–base site pairs followed by hydrogen removal as H2O by weakly coordinated surface oxygen ions. The used surface oxygen ions are replenished by dissociative adsorption of molecular oxygen to complete the catalytic cycle.
Though gold nanoparticles promote the catalytic activity of Mg–CeO2 compared to undoped Mg–CeO2, however more decreases in the basic sites cause the lowering of activity compared to Au/BaCeO2. The higher activities of Au/Ca–CeO2 compared to Au/Mg–CeO2 could not be explained from TPR and TPD results. A quantitative estimation of % of Ce3+/ Ce4+ shows that the population of Ce 3+ is more in the Au/Ca–CeO2 samples compare to Au/Ba–CeO2 and Au/Mg–CeO2 samples. As observed from textural properties, the Ca–CeO2 has a higher surface area and pore size compared to Ba–CeO2 and Mg–CeO2 and having a smaller crystallite size compared to other counterparts as evidenced from XRD and TEM studies. The different type of gelation during the growth of Ca doped ceria might induce different electronic properties as found in the XPS results. The larger population of Ce3+ ions (ESI†) indicates more oxide vacancies in the Au/Ca–CeO2 catalyst compare to Au/Mg–CeO2 might result easily in the diffusion of molecular oxygen during the reaction demonstrating higher catalytic activity. Since the presence of Au increases the activity of the doped CeO2, Au nanoparticles most probably constitute the dominant active sites here (involved in the complete catalytic cycle) while the acid–base and redox sites on the CeO2 play complementary roles.
Conclusions
In summary, undoped and alkaline metal (Ba, Ca, Mg) doped mesoporous ceria were prepared by modified sol–gel methods using a triethanolamine–water mixture as a solvent. The Ca–CeO2 has a higher surface area, pore size as observed from BET S.A and porosity measurements studies. Non existence of any peak due to Ba, Ca and Mg containing compounds in the XRD pattern emphasize the formation of nanocrystalline ceria containing solid solutions. The TEM characterizations reveal the highly crystalline nanoparticles in the range of 20–30 nm. The gold particles are smaller in size when deposited over Ba–CeO2 surfaces compared to CeO2, Ca–CeO2 and Mg–CeO2 supports. The role of dopant cations to the chemical environment of the ceria lattice are highlighted from the XPS investigation. A large number of oxide vacancies along with a mixed valence Ce3+/Ce4+ species are observed in the XPS studies. The strong gold-support interaction resulting in the shift of Ce 3d core electron peaks are observed when both the gold nanoparticles and dopant cations are present. The TPR studies show that Ba–CeO2 is more reducible compared to Mg–CeO2 and Ca–CeO2. In all cases the reduction temperature of doped ceria is lowered by gold deposition showing higher catalytic activity towards benzyl alcohol oxidation. The reducibility of the Au/Ba–CeO2 catalyst was more compared to the Au/Ca–CeO2 and Au/Mg–CeO2 catalyst. Simultaneously, the lattice oxygen atoms are more labile in the case of Au/Ba–CeO2 which is more active in the benzyl alcohol oxidation reaction. The alteration of basic sites due to gold deposition is observed from the CO2 TPD studies. Though the basic site density is decreased for Au/Ba–CeO2 and Au/Mg–CeO2 catalysts but for Au/Ca–CeO2 it is increased. The higher activity of the Au/Ca–CeO2 catalyst compare to Au/Mg–CeO2 is due to the large number of oxygen vacancies leading to the highest Ce3+/Ce4+ ratio as evidenced from XPS measurements.Acknowledgements
BC would like to acknowledge the financial grant from DST, Govt of India under the Fast Track Young Scientist Scheme (project no SR/FTP/ETA-16/2007-08). CS would like to acknowledge UGC, Govt of India for providing research fellowship. Authors acknowledge Prof. Asim Bhaumik (IACS, Calcutta) for helping them to carry out BET S.A porosity measurement experiments.References
- G. J. Hutchings, J. Catal., 1985, 96, 292 CrossRef CAS.
- M. Haruta, T. Kobayashi, H. Sano and N. Yamada, Chem. Lett., 1987, 405 CrossRef CAS.
- D. T. Thompson, Gold Bulletin. (Berlin, Ger.), 1998, 31, 111 CAS.
- C. B. Geoffrey and D. T. Thompson, Catal. Rev. Sci. Eng., 1999, 41, 319 Search PubMed.
- C. B. Geoffrey, Gold Bulletin. (Berlin, Ger.), 2001, 34, 117 Search PubMed.
- G. J. Hutchings, Gold Bulletin. (Berlin, Ger.), 2004, 37, 3 CAS.
- T. Mallat and A. Baiker, Chem. Rev., 2004, 104, 3037 CrossRef CAS.
- T. Punniyamurthy, S. Velusamy and J. Iqbal, Chem. Rev., 2005, 105, 2329 CrossRef CAS.
- A. V. Sánchez, J. G. Á. Zárraga and J. Mex, Chem. Soc., 2007, 51, 213 Search PubMed.
- C. P. Vinod, K. Wilson and A. F. Lee, J. Chem. Technol. Biotechnol., 2011, 86, 161 CrossRef CAS.
- R. J. J. Jachuck, D. K. Selvaraj and R. S. Varma, Green Chem., 2006, 8, 29 RSC.
- P. Maity, D. Mukesh, S. Bhaduri and G. K. Lahiri, J. Chem. Sci., 2009, 121, 377 CrossRef CAS.
- M. Epifani, E. Pellicer, J. Arbiol and J. R. Morante, Chem. Mater., 2009, 21, 862 CrossRef CAS.
- X. Liu, K. Zhou, L. Wang, B. Wang and Y. Li, J. Am. Chem. Soc., 2009, 131, 3140 CrossRef CAS.
- A. Trovarelli, Catal. Rev. Sci. Eng., 1996, 38, 439 CAS.
- Z. Hu and H. Metiu, J. Phys. Chem. C, 2011, 115, 17898 CAS.
- A. B. Kehoe, D. O. Scanlon and G. W. Watson, Chem. Mater., 2011, 23, 4464 CrossRef CAS.
- Z. Hu, B. Li, X. Y. Sun and H. Metiu, J. Phys. Chem. C, 2011, 115, 3065 CAS.
- N. Qiu, J. Zhang, Z. Wu, T. Hu and P. Liu, Cryst. Growth Des., 2012, 12, 629 CAS.
- A. Abad, P. Concepcióń, A. Corma and H. Garcia, Angew. Chem., Int. Ed., 2005, 44, 4066 CrossRef CAS.
- J. Guzman, S. Carrettin and A. Corma, J. Am. Chem. Soc., 2005, 127, 3286 CrossRef CAS.
- A. K. Patra, S. K. Das and A. Bhaumik, J. Mater. Chem., 2011, 21, 3925 RSC.
- S. K. Das, M. K. Bhunia and A. Bhaumik, Dalton Trans., 2010, 39, 4382 RSC.
- G. Postole, B. Chowdhury, B. Karmakar, K. Pinki, J. Banerji and A. Auroux, J. Catal., 2010, 269, 110 CrossRef CAS.
- B. Chowdhury, K. K. Bando, J. J. Bravo-Suárez, S. Tsubota and M. Haruta, J. Mol. Catal. A: Chem., 2012, 359, 21 CrossRef CAS.
- D. Balzar, N. Audebrand, M. R. Daymond, A. Fitch, A. Hewat, J. I. Langford, A. Le. Bail, D. Louër, O. Masson, C. N. McCowan, N. C. Popa, P. W. Stephens and B. H. Toby, J. Appl. Crystallogr., 2004, 37, 911 CAS.
- S. Liang, F. G. Teng, Bulgan, R. Zong and Y. Zhu, J. Phys. Chem. C, 2008, 112, 5307 CAS.
- G. Ertl, H. Knozinger, F. Schuth and J. Weitkmp, Hand book of heterogeneous catalyst, WILEY-VCH, Weinheim, 2nd edn, 2008, vol. 2, p. 728 Search PubMed.
- P. I. Ravikovitcha, G. L. Haller and A. V. Neimarka, Adv. Colloid Interface Sci., 1998, 203, 76 Search PubMed.
- S. Tsunekawa, K. Ishikawa, Z. Q. Li, Y. Kawazoe and A. Kasuya, Phys. Rev. Lett., 2000, 85, 3440 CrossRef CAS.
- R. K. Pati, I. C. Lee, K. J. Gaskell and S. H. Ehrman, Langmuir, 2009, 25, 67 CrossRef CAS.
- H. Jiang, J. Hu, F. Gu and C. Li, J. Phys. Chem. C, 2008, 112, 12138 CAS.
- J. Texeira, J. Appl. Crystallogr., 1988, 21, 781 CrossRef.
- B. M. Reddy, B. Chowdhury, I. Ganesh, E. P. Reddy, T. C. Rojas and A. Fernandez, J. Phys. Chem. B, 1998, 102, 10176 CrossRef CAS.
- B. M. Reddy, B. Chowdhury and P. G. Smirniotis, Appl. Catal., A, 2001, 219, 53 CrossRef CAS.
- U. A. Joshi, S. Yoon, S. Baik and J. S. Lee, J. Phys. Chem. B, 2006, 110, 12249 CrossRef CAS.
- J. S. Valente, E. Lima, J. A. Toledo-Antonio, M. A. Cortes-Jacome, L. Lartundo-Rojas, R. Montiel and J. Prince, J. Phys. Chem. C, 2010, 114, 2089 CAS.
- M. Vallet-Regi, J. Pérez-Pariente, I. Izquierdo-Barba and J. A. Salinas, Chem. Mater., 2000, 12, 3770 CrossRef CAS.
- V. Shapovalov and H. Metiu, J. Catal., 2007, 245, 205 CrossRef CAS.
- A. K. Sinha and K. Suzuki, J. Phys. Chem. B, 2005, 109, 1708 CrossRef CAS.
- C. Loschen, S. T. Bromley, K. M. Neyman and F. Illas, J. Phys. Chem. C, 2007, 111, 10142 CAS.
- B. M. Reddy, G. Thrimurthulu, L. Katta, Y. Yamada and S. E. Park, J. Phys. Chem. C, 2009, 113(36), 15882 CAS.
- A. M. Visco, F. Neri, G. Neri, A. Donato, C. Milone and S. Galvagno, Phys. Chem. Chem. Phys., 1999, 1, 2869 RSC.
- J. M. C. Soares, P. Morrall, A. Crossley, P. Harris and M. Bowker, J. Catal., 2003, 219, 17 CrossRef CAS.
- E. D. Park and J. S. Lee, J. Catal., 1999, 186, 1 CrossRef CAS.
- R. M. Finch, N. A. Hodge, G. J. Hutchings, A. Meagher, Q. A. Pankhurst, M. R. H. Siddiqui, F. E. Wagner and R. Whyman, Phys. Chem. Chem. Phys., 1999, 1, 485 RSC.
- G. C. Bond and D. T. Thompson, Gold Bull. (Berlin, Ger.), 2000, 41, 33 Search PubMed.
- C. K. Costello, M. C. Kung, H. S. Oh, Y. Wang and H. H. Kung, Appl. Catal., A, 2002, 232, 159 CrossRef CAS.
- G. R. Rao and B. G. Mishra, Bulletin of the Catalysis Society of India, 2003, 2, 122 Search PubMed.
- A. B. Kehoe, D. O. Scanlon and G. W. Watson, Chem. Mater., 2011, 23, 4464 CrossRef CAS.
- F. Y. Wang, S. Chen, Q. Wang, S. Yu and S. Cheng, Catal. Today, 2004, 97, 189 CrossRef CAS.
- V. A. Bondzie, S. C. Parker and C. T. Campbell, J. Vac. Sci. Technol., A, 1999, 17, 1717 CAS.
- J. Guzman, S. Carrettin and A. Corma, J. Am. Chem. Soc., 2005, 127, 3286 CrossRef CAS.
- M. Date, M. Okumura, S. Tsubota and M. Haruta, Angew. Chem., Int. Ed., 2004, 43, 2129 CrossRef CAS.
- B. Chowdhury, J. J. Bravo-Suárez, N. Mimura, S. Tsubota and M. Haruta, J. Phys. Chem. B, 2006, 110, 22995 CrossRef CAS.
- J. I. D. Cosimo, C. R. Apesteguia, M. J. L. Gines and E. Iglesia, J. Catal., 2000, 190, 261 CrossRef.
Footnote |
| † Electronic supplementary information (ESI) available. See DOI: 10.1039/c2cy20523h |
| This journal is © The Royal Society of Chemistry 2013 |