Microwave-assisted synthesis of PtRu/CNT and PtSn/CNT catalysts and their applications in the aerobic oxidation of benzyl alcohol in base-free aqueous solutions
Hong
Chen
a,
Qinghu
Tang
ab,
Yuanting
Chen
a,
Yibo
Yan
a,
Chunmei
Zhou
a,
Zhen
Guo
a,
Xinli
Jia
a and
Yanhui
Yang
*a
aSchool of Chemical and Biomedical Engineering, Nanyang Technological University, Singapore 637459, Singapore. E-mail: YHYang@ntu.edu.sg; Fax: +65 67947553; Tel: +65 63168940
bSchool of Chemistry and Environmental Science, Key Laboratory of Green Chemical Media and Reactions, Ministry of Education, Henan Normal University, Xinxiang 453007, China
First published on 9th July 2012
Abstract
Ru promoted the reaction by reacting with surface Pt-hydride species to liberate free Pt active sites while adding Sn enhances the electronic interactions. Moreover, acid functionalized CNT was identified as the superior support due to its hydrophilic surfaces, conical stacking structures, and tubular structure with mesoporous open-ended morphology.
1. Introduction
The selective oxidation of alcohols is of great importance because the corresponding carboxyl compounds have served as the versatile intermediates in organic synthesis industries.1 From the viewpoints of atom economy and the sustainable development of human society, tremendous effort has been devoted to design a more environmentally benign “green” technology to replace the traditional stoichiometric process, which requires expensive additives and generates aqueous waste containing a large amount of inorganic salts.2 The aerobic oxidation of alcohols in water using molecular oxygen as an oxidant has attracted significant attention.3–6 However, the aerobic oxidation of alcohols in an aqueous phase relies on the use of a strong basic additive, such as KOH or K2CO3,7,8 which causes problems of corrosion and basic waste disposal. Moreover, the strong basic additive in the reaction mixture may enhance the cleavage of the C–C bond.9 Benzyl alcohol oxidation is frequently employed as a probe reaction in the laboratory study due to its relatively high reactivity. Additionally, the main product, benzaldehyde, is a non-enolizable aldehyde, which reduces the number of possible by-products and thus permits the study of the reaction mechanism. Nevertheless, concerning the benzyl alcohol oxidation in the aqueous phase in the absence of alkali, early studies rarely achieved high benzyl alcohol conversion and benzaldehyde selectivity greater than 90%.10,11a Recently reported studies revealed high benzyl alcohol conversion and selectivity for aldehydes of greater than 90% with several catalytic systems (supported nanoparticles), e.g., the selective oxidation carried out in a fixed-bed reactor over Au–Cu/SiO2 catalysts at a high reaction temperature.11bPlatinum (Pt) is considered to be the most promising and effective catalyst for electrocatalysis, such as the electrooxidation of syngas or reformate and the direct methanol fuel cells (DMFCs).12,13 At present, various Pt-based bimetallic catalysts have been developed due to their superior activity, selectivity, and deactivation resistance, but there has not been enough emphasis on the catalytic behavior of promoted Pt-catalysts for the liquid-phase reactions. In a previous study, a Pt–Fe alloy with FeOx nanoclusters on its surface was prepared by a micro-wave assisted polyol reduction (MAPR) method, providing a close contact between Pt and FeOx, thus enhancing the activity for cinnamaldehyde hydrogenation.14 Recently, it was demonstrated that decorating iron oxide on carbon nanotubes (CNT) supported Pt nanoparticles Pt/CNT can remarkably improve the catalytic activity for benzyl alcohol aerobic oxidation.15 In both cases, the iron oxides on Pt benefit the adsorption of reactants and the synergistic interaction between FeOx (Lewis sites) and Pt–Fe alloy, which contribute to C![[double bond, length as m-dash]](https://www.rsc.org/images/entities/char_e001.gif) O bond activation and efficient electron transfer. Besides FeOx, the catalytic activity of supported Pt nanoparticles can also be promoted by alloying with ruthenium (Ru) and tin (Sn). Davis et al. demonstrated that a Pt–Ru bimetallic catalyst was more active than a monometallic platinum catalyst in glycerol hydrogenolysis.16 More recently, the activity enhancement contributed by the bi-functional performance of the Pt–Ru alloy has been observed by Liu et al. in the liquid-phase selective hydrogenation of 3,4-epoxy-1-butuer.17
O bond activation and efficient electron transfer. Besides FeOx, the catalytic activity of supported Pt nanoparticles can also be promoted by alloying with ruthenium (Ru) and tin (Sn). Davis et al. demonstrated that a Pt–Ru bimetallic catalyst was more active than a monometallic platinum catalyst in glycerol hydrogenolysis.16 More recently, the activity enhancement contributed by the bi-functional performance of the Pt–Ru alloy has been observed by Liu et al. in the liquid-phase selective hydrogenation of 3,4-epoxy-1-butuer.17
Herein, CNT supported Pt-based bimetallic nanoparticles were synthesized by finely alloying Pt with Ru or Sn by MAPR method, and their catalytic performance was examined over the benzyl alcohol oxidation in a base-free aqueous solution under mild conditions. Various characterizations were employed to investigate the effect of promoter on the catalytic performance.
2. Experimental
2.1 Materials
H2PtCl6 (>37.5% Pt basis, Sigma-Aldrich), RuCl3 (Ru content 45–55%, Aldrich), SnCl2 (98%, Sigma-Aldrich), carbon nanotube (CNT, Shenzhen Nano, China), H2SO4 (99.5%, Fluka), HNO3 (65%, Fluka), and ethylene glycol (EG, 99.5%, Fluka), benzyl alcohol (>99.0%, Sigma-Aldrich), toluene (>99.9%, Sigma), tetradecane (>99.5%, Fluka), deionized water (Resistivity > 18.0 MΩ cm). All chemicals and regents were used as received without further purification.2.2 Synthesis
The pristine CNT was functionalized by a conventional acid treatment. 200 mg of CNT was dispersed in 200 mL of a mixed acid solution (H2SO4![[thin space (1/6-em)]](https://www.rsc.org/images/entities/char_2009.gif) :
:![[thin space (1/6-em)]](https://www.rsc.org/images/entities/char_2009.gif) HNO3 in 1
HNO3 in 1![[thin space (1/6-em)]](https://www.rsc.org/images/entities/char_2009.gif) :
:![[thin space (1/6-em)]](https://www.rsc.org/images/entities/char_2009.gif) 1 v/v ratio), followed by refluxing at 140 °C for 6 h. The mixture was then diluted with 2 L of deionized water and followed by filtration. The solid was washed with deionized water thoroughly and dried in a vacuum oven at 80 °C for 24 h.
1 v/v ratio), followed by refluxing at 140 °C for 6 h. The mixture was then diluted with 2 L of deionized water and followed by filtration. The solid was washed with deionized water thoroughly and dried in a vacuum oven at 80 °C for 24 h.
The promoted Pt catalysts supported on CNT (Pt-M/CNT, M = Ru or Sn) were synthesized by an MAPR method reported by Guo et al.14 Typically, 50 mg of acid-functionalized CNT were immersed in an appropriate amount of H2PtCl6 and RuCl3 or SnCl2 mixed aqueous solution and dried at 100 °C in a vacuum. The obtained solid was added to 40 mL of EG and sonicated for 30 min to produce a homogenous suspension. The said suspension was then transferred into a three-necked flask with a condenser and placed in a microwave reactor (Sineo, MAS-II). The suspension was heated to 160 °C in 0.5 min and kept at the same temperature for another 1.5 min. The temperature was monitored by an infrared sensor while the slurry was under constant stirring. After cooling to room temperature, the solid was filtrated, washed with deionized water and dried at 80 °C in vacuum. The noble metal content was regulated at 5 wt%. In what follows, the synthesized Pt–Ru catalyst is denoted as PtxRuy/CNT, where x/y denotes various mass percentage of Pt/Ru (e.g. 90/10, 60/40, 20/80) with the total loading of Pt and Ru kept at 5 wt%. The synthesized Pt–Sn catalyst is denoted as PtaSnb/CNT, where a/b denote various molar ratios of Pt/Sn (e.g. 2/1, 1/1, 1/2) with the Pt loading kept at 5 wt%. Pure Pt/CNT, Ru/CNT and Sn/CNT were also synthesized. Pt–Ru and Pt–Sn nanoparticles supported on other supports (pristine CNT, activated carbon (AC), graphite) were prepared following the same procedures. For comparison, Pt/CNT catalysts promoted by Ru or Sn were also prepared by a conventional impregnation method (IMP)18 or a deposition–precipitation method (DP).19 The synthesized samples were pre-reduced in a H2 flow of 20 mL min−1 at 300 °C for 2 h and denoted as PtRu/CNT-IMP and PtRu/CNT-DP (PtSn/CNT-IMP and PtSn/CNT-DP), respectively.
2.3 Characterization
The contents of Pt and Sn were analyzed on a Dualview Optima 5300 DV ICP-OES system after the sample was completely dissolved in an acid solution (HNO3![[thin space (1/6-em)]](https://www.rsc.org/images/entities/char_2009.gif) :
:![[thin space (1/6-em)]](https://www.rsc.org/images/entities/char_2009.gif) HCl in 1
HCl in 1![[thin space (1/6-em)]](https://www.rsc.org/images/entities/char_2009.gif) :
:![[thin space (1/6-em)]](https://www.rsc.org/images/entities/char_2009.gif) 1 v/v ratio). Nitrogen adsorption–desorption isotherms were measured at 77 K using a Quantachrome Autosorb-6b static volumetric instrument. Prior to each measurement, the sample was degassed at 473 K for 4 h to a residual pressure below 10−4 Torr. Powder XRD patterns were recorded on a Bruker Advance 8 X-ray diffractometer equipped with a rotating anode using Cu Kα radiation (λ = 0.154 nm), operating at 40 kV and 40 mA. TEM imaging was performed on a JEOL 2010, operated at 120 kV. The samples for TEM measurements were suspended in ethanol and dried on a copper grid coated with carbon. The X-ray photoelectron spectroscopy (XPS) was measured with a PHI Quantum 2000 Scanning ESCA Microprobe equipment (Physical Electronics) using monochromatic Al Kα radiation (hν = 1846.6 eV, 25 W). The background pressure in the analysis chamber was lower than 1 × 10⁻⁷ Pa. The X-ray beam diameter was 100 μm, and the pass energy was calibrated using a C 1s photoelectron peak at 284.6 eV as a reference. The CO stripping voltammetry was recorded in a 1.0 M KOH solution at 50 mV s−1. The working electrode for CO stripping was prepared by dropping 10 μL of the ink onto the surface of the glassy carbon electrode. The ink was prepared by ultrasonically mixing 3 mg of sample in 750 μL of ethanol for 30 min, followed by adding 750 μL of 0.5% Nafion solution in ethanol and further ultrasonicating for 30 min. A Pt foil and an Hg/HgO electrode were employed as counter and reference electrodes, respectively. After purging the electrodes with He, gaseous CO was bubbled for 15 min to form the CO adlayer on the tested catalyst while maintaining the potential at −0.8 eV. Excess CO in the solution was purged with He. All the potentials in present study were given versus Hg/HgO electrode.
1 v/v ratio). Nitrogen adsorption–desorption isotherms were measured at 77 K using a Quantachrome Autosorb-6b static volumetric instrument. Prior to each measurement, the sample was degassed at 473 K for 4 h to a residual pressure below 10−4 Torr. Powder XRD patterns were recorded on a Bruker Advance 8 X-ray diffractometer equipped with a rotating anode using Cu Kα radiation (λ = 0.154 nm), operating at 40 kV and 40 mA. TEM imaging was performed on a JEOL 2010, operated at 120 kV. The samples for TEM measurements were suspended in ethanol and dried on a copper grid coated with carbon. The X-ray photoelectron spectroscopy (XPS) was measured with a PHI Quantum 2000 Scanning ESCA Microprobe equipment (Physical Electronics) using monochromatic Al Kα radiation (hν = 1846.6 eV, 25 W). The background pressure in the analysis chamber was lower than 1 × 10⁻⁷ Pa. The X-ray beam diameter was 100 μm, and the pass energy was calibrated using a C 1s photoelectron peak at 284.6 eV as a reference. The CO stripping voltammetry was recorded in a 1.0 M KOH solution at 50 mV s−1. The working electrode for CO stripping was prepared by dropping 10 μL of the ink onto the surface of the glassy carbon electrode. The ink was prepared by ultrasonically mixing 3 mg of sample in 750 μL of ethanol for 30 min, followed by adding 750 μL of 0.5% Nafion solution in ethanol and further ultrasonicating for 30 min. A Pt foil and an Hg/HgO electrode were employed as counter and reference electrodes, respectively. After purging the electrodes with He, gaseous CO was bubbled for 15 min to form the CO adlayer on the tested catalyst while maintaining the potential at −0.8 eV. Excess CO in the solution was purged with He. All the potentials in present study were given versus Hg/HgO electrode.
2.4 Catalytic reaction
The catalytic oxidation of benzyl alcohol using molecular O2 was carried out in a bath-type reactor operated under atmospheric condition. In a typical reaction run, certain amounts of catalyst, 3 mmol of benzyl alcohol, and 15 mL of distilled water were added into a 50 mL three-necked glass flask. The ratio of substrate/noble metal was regulated at 569 mol/mol. The mixture was vigorously stirred using a magnetic stirrer (800 rpm) and heated in a silicon oil bath. The system was equipped with a thermocouple to control the reaction temperature (80 °C) and a reflux condenser. Oxygen flow was bubbled into the mixture at a rate of 25 mL min−1 to initiate the reaction. After the reaction, the solid catalyst was filtered off and the liquid organic products were extracted by toluene (20 mL × 3, 100% efficiency) and analyzed by an Agilent gas chromatograph 6890, equipped with a HP-5 capillary column (30 m long and 0.32 mm in diameter, packed with silica based supelcosil) and flame ionization detector (FID). Tetradecane (C14) was used as the inert standard to calculate benzyl alcohol conversion and benzaldehyde selectivity.3. Results and discussion
3.1 Effect of synthesis methods
Different synthesis methods may result in different synergistic interactions between Pt and promoter. Herein, Pt90Ru10 (Pt/Ru = 90/10 wt/wt) and Pt1Sn1 (Pt/Sn = 1/1 mol/mol) catalysts were selected as representative samples prepared via three different methods: microwave-assisted polyol reduction (MAPR), deposition–precipitation (DP) and impregnation (IMP); the effect of synthesis methods were examined.Deposition of metal via different methods gives similar BET surface areas, about 250 m2/g (entry 1–2, 5, Table 1 and entry 1–2, 5, Table 2), implying that surface area is consistent regardless of synthesis methods and the effect of surface area on the catalytic activity can be neglected. Metal contents determined by ICP were also given in Tables 1 and 2. The actual noble metal loadings are around 5 wt% ((Pt + Ru) or Pt for Pt–Ru/CNT and Pt–Sn/CNT, respectively), confirming the effective deposition of metal for all three synthesis methods, although the impregnation method shows slightly higher metal content than either DP or MAPR method which may be due to the trace filtration loss for the latter two methods.
| Entry | Catalyst | Content,b wt% | Pt/Ruc | BET, m2/g | Conv., % | Select.,% | qTOF,d h−1 | ||
|---|---|---|---|---|---|---|---|---|---|
| Pt | Ru | ICP | XPS | ||||||
| a Conditions: substrate = 3 mmol; deionized water = 15 mL, substrate/metal = 500 mol/mol, T = 80 °C, t = 3 h, O2 = 25 mL min−1. b Metal contents were tested by ICP. c Pt/Ru molar ratio calculated from ICP and XPS results, respectively. d qTOF is calculated using the (Pt + Ru) metal content obtained from ICP. | |||||||||
| 1 | Pt90Ru10/CNT-DP | 4.5 | 0.5 | 4.8 | — | 252 | 49.8 | 96.8 | 90 |
| 2 | Pt90Ru10/CNT-IMP | 4.5 | 0.5 | 5.2 | 1.9 | 251 | 24.2 | 95.3 | 46 |
| 3 | CNT | — | — | — | — | 288 | <1.0 | 99.7 | — |
| 4 | Pt/CNT | 5.0 | 0 | — | — | 246 | 35.6 | 96.8 | 68 |
| 5 | Pt90Ru10/CNT | 4.4 | 0.4 | 5.5 | 2.6 | 251 | 52.5 | 96.5 | 100 |
| 6 | Pt60Ru40/CNT | 2.8 | 1.6 | 0.9 | — | 259 | 37.2 | 95.6 | 71 |
| 7 | Pt20Ru80/CNT | 0.9 | 3.0 | 0.2 | — | 261 | 11.8 | 96.9 | 22 |
| 8 | Ru/CNT | 0 | 3.8 | — | — | 267 | 1.3 | 99.5 | 3 |
| Entry | Catalyst | Content,b wt% | Pt/Snc | BET, m2/g | Conv.,% | Select.,% | qTOF,d h−1 | ||
|---|---|---|---|---|---|---|---|---|---|
| Pt | Sn | ICP | XPS | ||||||
| a Condition: substrate = 3 mmol; deionized water = 15 mL, catalyst = 20 mg, T = 80 °C, t = 1 h, O2 = 25 mL min−1. b Metal contents were tested by ICP. c Pt/Sn molar ratio calculated from ICP and XPS results, respectively. d qTOF is calculated using the Pt content obtained from ICP. | |||||||||
| 1 | Pt1Sn1/CNT-DP | 4.6 | 2.4 | 1.2 | 0.4 | 252 | 38.3 | 95.5 | 243 |
| 2 | Pt1Sn1/CNT-IMP | 5.0 | 2.6 | 1.2 | 0.4 | 253 | 26.7 | 98.6 | 156 |
| 3 | Pt/CNT | 5.0 | 0 | 100 | — | 246 | 15.6 | 99.7 | 92 |
| 4 | Pt2Sn1/CNT | 4.6 | 1.1 | 2.4 | 1.2 | 258 | 51.2 | 92.8 | 329 |
| 5 | Pt1Sn1/CNT | 4.5 | 2.3 | 1.2 | 0.6 | 252 | 67.2 | 91.9 | 435 |
| 6 | Pt1Sn2/CNT | 4.6 | 4.0 | 0.7 | 0.3 | 266 | 39.8 | 94.3 | 249 |
| 7 | Sn/CNT | 0 | 2.2 | — | — | 293 | 0.4 | 100 | — |
Fig 1 shows the XRD patterns of PtRu/CNT (panel a) and PtSn/CNT (panel b) catalysts by three different methods. All the samples display a strong (002) diffraction of graphitic carbon at 2θ = 26°, which suggests that the graphite structure of CNT is retained after the acid pre-treatment and metal deposition.14 For Ru promoted Pt-catalysts, the impregnated sample Pt90Ru10/CNT-IMP shows strong and sharp diffraction peaks at 39, 46, and 67° indexed to (111), (200), and (220) facets of reflection for the face-centered cubic (FCC) lattice structure of Pt (PDF #04-0802), implying a large mean particle size of Pt. On the contrary, Pt90Ru10/CNT and Pt90Ru10/CNT-DP possess identical XRD patterns but only exhibit a weak diffraction peak at 39° assigned to the Pt (111) facet, which indicates a smaller particle size with homogeneous dispersion. Noteworthily, no features of Ru and its oxides can be detected in all samples, suggesting that substituting Pt with Ru atoms occurs and a homogeneous Pt–Ru alloy forms.20
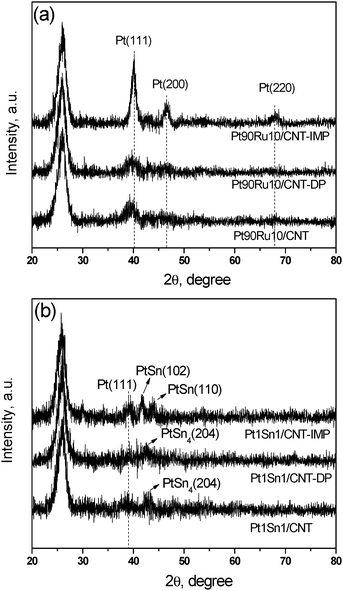 | ||
| Fig. 1 X-Ray diffraction patterns of (a) PtRu/CNT and (b) PtSn/CNT catalysts by different methods. | ||
When Sn was doped as a promoter, Pt1Sn1/CNT-IMP present a subtle diffraction feature at 39° assigned to the Pt (111) plane, which is hardly visible in Pt1Sn1/CNT and Pt1Sn1/CNT-DP due to a small particle size effect. Furthermore, several diffraction peaks at 40–45° indicate a Pt–Sn alloy phase is detected for all three samples. The peaks at 41.8 and 44.2o are observed in Pt1Sn1/CNT-IMP, which are associated with the PtSn (102) and (110) planes (PDF #25-0614), respectively. However, in Pt1Sn1/CNT and Pt1Sn1/CNT-DP, the peak located at 42.5° corresponds to the (204) plane of the PtSn4 alloy phase (PDF #65-1403). In conclusion, MAPR and DP methods are superior to IMP methods in producing small and well dispersed alloyed nanoparticles.
The particle dispersion and size distribution of all Pt–Ru/CNT and Pt–Sn/CNT bimetallic catalysts were further investigated by TEM measurement, as illustrated in Fig. 2. For Pt90Ru10/CNT and Pt90Ru10/CNT-DP, spherical nanoparticles with a narrow size distribution are homogeneously dispersed on CNT supports. Both mean particle sizes are quite close, giving 4.6 ± 1.0 and 4.3 ± 1.2 nm, respectively. However, the nanoparticles for Pt90Ru10/CNT-IMP possess an irregularly shaped morphology (nanoparticles and nanorods). The mean particle size is determined as 10.3 ± 4.2 nm, which is remarkably larger than the other two samples. Similarly, when Sn is added into Pt as a promoter, smaller nanoparticles with uniform dispersion and narrower size distributions are obtained via MAPR and DP methods (3.4 ± 0.8 and 3.4 ± 0.5 nm for Pt1Sn1/CNT and Pt1Sn1/CNT-DP, respectively), whereas IMP method gives a much boarder size distribution, with a noticeable fraction of particles larger than 10 nm. Therefore, TEM results are consistent with the XRD observations, and further confirm the superiority of MAPR and DP methods to IMP in catalyst preparation.
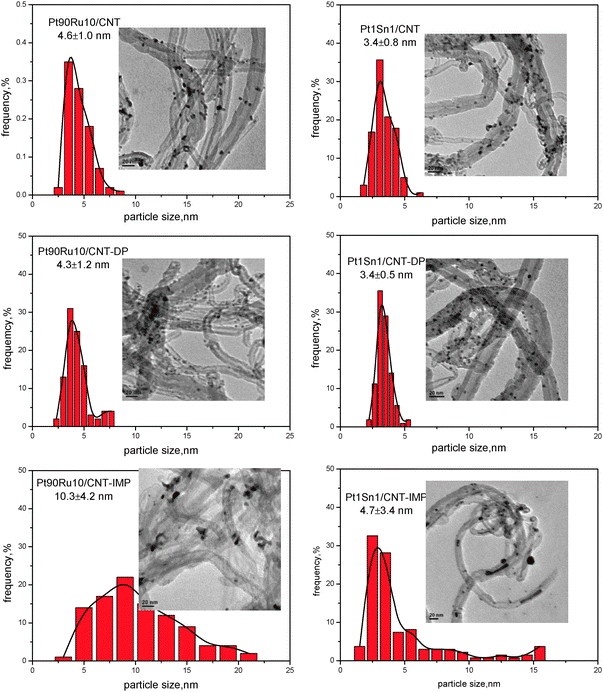 | ||
| Fig. 2 TEM results for PtRu/CNT and PtSn/CNT by different methods. | ||
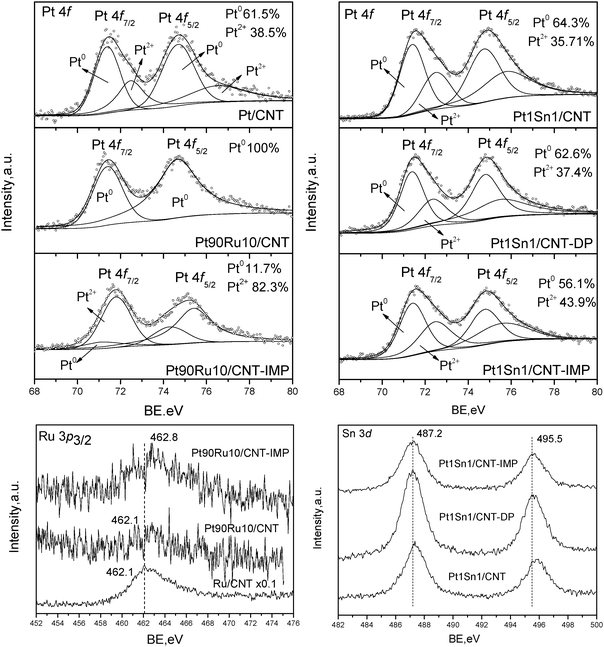 | ||
| Fig. 3 XPS results for PtRu/CNT and PtSn/CNT by different methods. | ||
The XPS spectra of Pt 4f and Ru 3p3/2 core levels for representative Pt–Ru catalysts are shown in Fig. 3 (left column). The spectra of monometallic Pt/CNT catalyst can be deconvoluted into two doublets. The weaker set (72.4 and 75.7 eV) assigned to the Pt2+ state in the form of PtO and Pt(OH)2, which might be generated on the surface layer with Pt–O bonds.21 The more intense doublet (71.1 and 74.4 eV) is attributed to metallic Pt0 which is the predominant surface Pt species (Pt0 61.5%, Pt2+ 38.5%). However, the Pt–Ru nanoparticles in Pt90Ru10/CNT consist exclusively of metallic Pt0 species, suggesting the incorporation of Ru can facilitate the reduction of Pt into a metallic state. Compared to MAPR-prepared catalyst, Pt90Ru10/CNT-IMP shows a surface-enrichment of Pt2+ species (Pt0 11.7%, Pt2+ 82.3%), indicating the inferiority of IMP methods in producing metallic nanoparticles even followed by a pre-reduction in H2 flow. The Ru 3p3/2 peak instead of Ru 3d was analyzed to avoid overlapping between Ru 3d and C 1s peaks. Both Pt90Ru10/CNT and Ru/CNT possess a characteristic peak at 462.1 eV assigned to metallic Ru, further confirming that metallic nanoparticles can be obtained via a MAPR method. However, the peak intensity of Pt90Ru10/CNT is quite weak, suggesting a lower abundance of Ru on the particle surface and the possibility of the formation of Pt–Ru alloy as suggested by XRD patterns. The surface Pt/Ru atomic ratio derived from XPS peak intensity is 2.6, less than half of the bulk ratio calculated from ICP result (5.5) (Table 1). This suggests that the bimetallic nanoparticles in Pt90Ru10/CNT probably consist of a Pt–Ru alloy core covered by the outer layer of Ru metallic clusters. Comparing Pt–Ru catalysts synthesized via different methods, the binding energy of the Ru 3p3/2 peak (462.8 eV) of Pt90Ru10/CNT-IMP is a little higher than that of Pt90Ru10/CNT, which may be due to the formation of ruthenium oxyhydroxide or pseudo oxyhydroxide.22 Moreover, the bulk and surface Pt/Ru ratios are determined as 5.2 and 1.9, respectively (Table 1), which is lower than that of Pt90Ru10/CNT. Therefore, the conventional IMP method might lead to the nanoparticles with Pt covered by the outer layer of Ru oxides.
The XPS spectra of Pt 4f and Sn 3d core levels for Pt–Sn catalysts prepared via different methods are also depicted in Fig 3 (right column). The Pt 4f spectra of Pt1Sn1/CNT, Pt1Sn1/CNT-DP and Pt1Sn1/CNT-IMP show two doublets characteristic of metallic Pt0 and Pt2+ species, which are similar to that of Pt/CNT. This indicates the difference from Ru, the incorporation of Sn into Pt cannot enhance the reduction of Pt even through MAPR preparation, leaving a certain abundance of surface Pt oxides. Both Pt1Sn1/CNT and Pt1Sn1/CNT-DP are surface-enriched metallic Pt species, giving Pt0 surface abundances of 64.3% and 62.6%, respectively, which are similar to monometallic Pt/CNT catalyst. However, the IMP method gives abundant surface Pt2+ species and the surface percentage of Pt0 drops to 56.1%. Therefore, both MAPR and DP are superior to the IMP method for enhancing metal reduction. Moreover, it is noticed that the Pt0/Pt2+ surface abundance results in smaller changes in Pt–Sn than Pt–Ru catalysts, indicating that in comparison to Ru, the addition of Sn would affect the oxidation state of Pt less significantly. In Sn 3d core levels of three samples, only characteristic peaks of high Sn oxidation state are observed (487.2 and 495.5 eV), which may be attributed to Sn2+ and Sn4+ from SnO and SnO2 respectively. However, discrimination between Sn2+ and Sn4+ species from the XPS spectra was not possible due to the almost identical BEs of both species.23 Choi et al. also suggested that the oxidic chemical state is related to the strong affinity of tin toward oxygen species (oxophilicity), thereby being easily oxidized by oxygen and/or H2O from the atmosphere.24 The bulk Pt/Sn atomic ratios derived from ICP results of three samples are all around 1.2, which is close to the designed value and indicates the effective loading and deposition of metal on CNT supports. The calculated surface Pt/Sn atomic ratios are 0.6, 0.4, 0.4 for Pt1Sn1/CNT, Pt1Sn1/CNT-DP and Pt1Sn1/CNT-IMP, respectively. This suggests a surface coverage of Sn oxides for Pt–Sn nanoparticles of all the samples, when compared to DP and IMP methods, MAPR preparation prefers more surface exposure of Pt active sites.
The catalytic properties of Pt–Ru/CNT synthesized by different methods are summarized in Table 1 (entry 1–2, 5). All three catalysts can catalyze the aerobic oxidation of benzyl alcohol at 80 °C in a neutral aqueous solution with high benzaldehyde selectivities (>95%). Among them, the Pt90Ru10/CNT catalyst gives the highest conversion of 52.5%, which is more than twice that of Pt90Ru10/CNT-IMP (24.2%). The corresponding qTOFs vary with the same trend of conversions. The catalytic performance of Pt–Sn catalysts obtained via different methods give a similar result, as listed in Table 2 (entry 1–2, 5). The MAPR-synthesized Pt1Sn1/CNT catalyst outperforms the other two catalysts, showing the highest benzyl alcohol conversion (67.2%) and qTOF (435 h−1).
It was suggested that particle size and dispersion plays a vital role in controlling the catalytic activity.25 As suggested in XRD and TEM analysis, the bimetallic catalysts obtained by the IMP method possess larger particles with irregular shapes, which accounts for the poor catalytic activity. This is consistent with previous studies that the catalytic performance significantly depends not only on the bulk particle size and morphology but also on the surface composition.18,26 Although the DP method also gives a uniform particle dispersion and size distribution, the MAPR method offers improved surface exposure of Pt sites, which is dominantly responsible for the substrate activation and surface reaction.15 Previous studies had reported that MAPR synthesis allows the simultaneous reduction and deposition of metal precursors onto a suitable support, resulting in a close contact between Pt and promoter atoms.14 Therefore, the MAPR method is superior in preparing bimetallic catalysts with homogeneous dispersion and size distribution as well as superior surface Pt exposure, thus leading to enhanced catalytic activity.
3.2 Effect of Pt/promoter ratios
The XRD patterns of Pt–Ru/CNT and Pt–Sn/CNT catalysts prepared by the MAPR method are examined, as shown in Fig 4. The intense peak at 26° implies the well-preserved graphitic structure of CNT for all samples. Pt/CNT monometallic catalysts exhibit diffraction peaks at 2θ of 40 and 47°, assigned to (111) and (200) reflections for the Pt FCC structure. The Ru/CNT monometallic sample presents a broad peak at 43°, assigned to a (111) facet for the hexagonal close-packing (HCP) lattice structure of metallic Ru. For the Pt–Ru series, the diffraction patterns of Pt–Ru/CNT with a Ru content less than 40 wt% show exclusive reflection characteristics of Pt FCC structures, implying the formation of homogeneous Pt–Ru alloys by substituting Pt lattice sites with Ru atoms.20 It was reported that the Pt–Ru alloy containing up to 52 wt% of Ru only shows the diffraction peaks contributed by the Pt FCC lattice.27 Adding Ru broadens and slightly shifts the Pt (111) peak to higher 2θ as compared to Pt/CNT, suggesting that the lattice substitution of Pt atoms by smaller Ru atoms causes an observable decrease in the dimension of the Pt unit cell.17,28 Further increasing the Ru amount, a typical pattern of Ru is discerned for Pt20Ru80/CNT, indicating the presence of a Ru-rich alloy phase.27 The mean particle diameters calculated by using Scherrer’s formula are 5.0, 4.6, 4.4 and 3.4 nm for Pt/CNT, Pt90Ru10/CNT, Pt60Ru40/CNT and Pt20Ru80/CNT, respectively, showing a slight decrease with increasing Ru content, which further confirms the cooperation of Ru into Pt.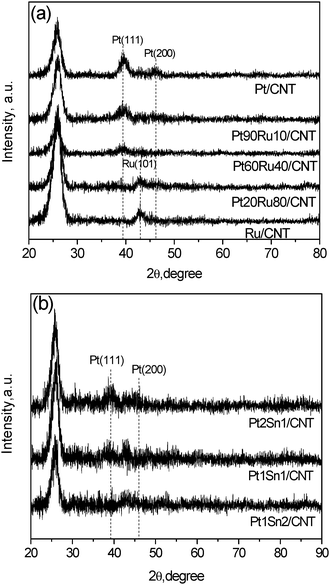 | ||
| Fig. 4 XRD results for Pt–Ru/CNT and Pt–Sn/CNT with different Pt/promoter ratios. | ||
For the Sn promoted Pt catalysts, the characteristic peak of the Pt (111) plane can be observed when the molar ratio of Pt/Ru is larger than 1 and vanishes with further addition of Sn. The diffraction peaks at 40–45° are denoted to Pt–Sn alloy phases. Besides, the diffraction peaks indicative of Sn and SnO2 phases were not detected, suggesting a good degree of alloying between Pt and Sn.
Fig 5 depicts representative TEM images with corresponding size distribution of Pt–Ru/CNT and Pt–Sn/CNT catalysts with different Pt/promoter ratios. When Ru is doped at a small amount, Pt90Ru10/CNT gives uniform particle dispersion with a narrow size distribution centered at 4.6 nm. After further addition of Ru, both Pt60Ru40/CNT and Pt20Ru80/CNT possess a slightly smaller mean particle size, giving 4.0 and 4.4 nm, respectively, which are consistent with the sizes derived from XRD results. However, the size distributions are much boarder due to the formation of large amounts of small clusters as well as large aggregates, indicating an irregular metal dispersion. Similarly, the Sn alloyed Pt catalysts with different Pt/Sn molar ratios exhibit different particle sizes and size distributions. Pt1Sn1/CNT has the best dispersion, giving uniformly dispersed particles centered at 3.4 nm. Either larger or smaller amounts of Sn would result in both larger particle sizes and boarder size distributions. Therefore, the content of promoter would affect the metal particle size; Pt90Ru10/CNT and Pt1Sn1/CNT exhibit the best particle distribution among the different samples.
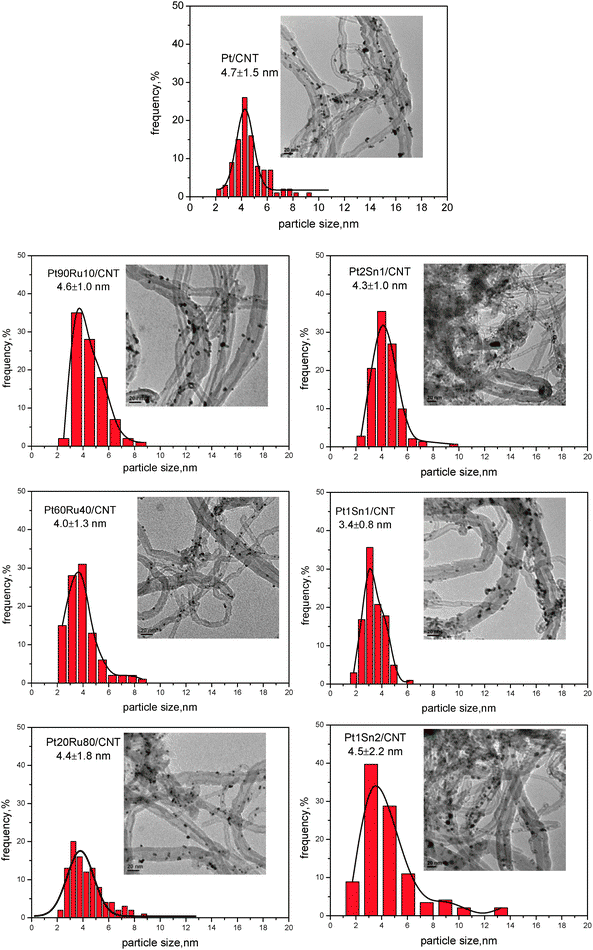 | ||
| Fig. 5 TEM results for PtRu/CNT and PtSn/CNT with different Pt/M ratio. | ||
Besides the particle size effect, surface composition and the local structure of Pt–Ru/CNT catalysts were also examined by using CO stripping, which is a sensitive surface probe technique. As shown in Fig 6, the CO stripping on Pt/CNTs shows a weak shoulder and a main peak potential at −0.5 and −0.1 V, respectively. The main oxidation current was attributed to the oxidation of linear-adsorbed CO species whereas the shoulder peak corresponds to the oxidation of bridge-bonded CO.29 It is reported that the adsorption of each bridge-bonded CO species involves 2 (or more) adjacent adsorption sites and the one with a linear structure corresponding to one adsorption site per CO-adsorbed particle. In the presence of Ru, the intensity of a CO stripping peak at −0.5 and −0.1 V decreases and a new CO stripping peak at −0.25 V is observed. Since the CO stripping peak at −0.5 V is related to the oxidation of bridge-bonded CO species, a decrease of this peak intensity due to the presence of Ru indicates a decrease of the number of adjacent Pt adsorption sites. According to the results of XRD and TEM, Pt/CNT has a larger particle size than that of Pt–Ru/CNT. Zeng et al. have demonstrated that larger platinum particles show more negative CO stripping potential in relation to the small particles.30 Therefore, the main CO stripping potentials on Pt–Ru/CNT should be more positive than that on Pt/CNT. But the testing result was not the case. The major negative potential shift for Pt–Ru/CNT catalysts further evidences that a Pt–Ru alloy was formed by substituting Pt with Ru atoms.31
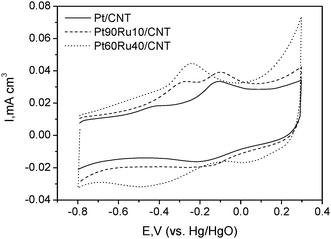 | ||
| Fig. 6 CO stripping curves on Pt/CNTs, Pt90Ru10/CNTs and Pt80Ru20/CNTs recorded in 1 M KOH solution. | ||
The surface composition effect for Sn promoted Pt catalysts was characterized by XPS measurements. Fig 7 shows the XPS spectra of Pt 4f and Sn 3d core levels for Pt–Sn catalysts with different Pt/Sn molar ratios. The Pt 4f XPS gives characteristic doublets of metallic Pt0 and Pt2+ species for all samples, which are similar to that of Pt/CNT. When Pt/Sn molar ratio is higher than 1, zero-valent Pt is the predominant Pd oxidation state, reaching 66.3% and 62.6% for Pt2Sn1/CNT and Pt1Sn1/CNT, respectively. However, further addition of Sn results in a reverse fraction of two Pd species, giving only 48.1% of Pt0 species. Sn 3d core levels verify the presence of an oxidic Sn state (SnO, SnO2 or Sn hydroxides) in all samples independent of Sn content. With the increasing content of Sn, an obvious shift to lower BEs was observed due to the electronegativity differences in the elemental Pt and Sn, leading to charge transfer from the less electronegative Sn to the more electronegative Pt.21 The calculated surface Pt/Sn atomic ratios are listed in Table 2. All samples possess a surface Pt/Sn ratio lower than half of the bulk value, which also verifies a surface coverage of Sn oxides for Pt–Sn nanoparticles of all the samples.
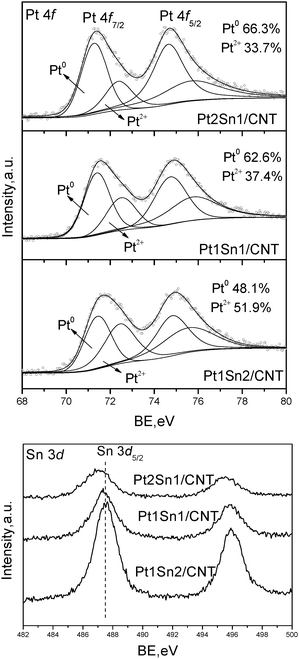 | ||
| Fig. 7 XPS results for Pt–Sn/CNT with different Pt/Sn molar ratios. | ||
The catalytic performances of Pt–Ru bimetallic catalysts with different Pt/Ru ratios for the selective benzyl alcohol oxidation over 3 h are summarized in Table 1. No benzyl alcohol conversion can be detected at 80 °C with either no catalyst or bare CNT support. Depositing only Ru on CNT hardly catalyzed the reaction, giving a conversion of 1.3%. On the contrary, Pt/CNT monometallic catalyst exhibits a fair benzyl alcohol conversion of 35.6% and qTOF of 68 h−1. Partially replacing Pt with Ru to form bimetallic Pt–Ru alloyed nanoparticles can effectively enhance the oxidation activity, whereas further alloying Ru would decrease the activity. The highest activity (qTOF of 100 h−1) is achieved over the Pt90Ru10/CNTs catalyst, which is remarkably higher as compared to both Ru and Pt monometallic catalysts.
The catalytic results of Pt–Sn/CNT catalysts are listed in Table 2, giving a similar trend to the Pt–Ru catalysts. Monometallic Sn/CNT shows no activity for the benzyl alcohol, while Pt/CNT gives a moderate conversion of 15.6% after 1 h reaction. In contrast, alloying Sn with Pt remarkably enhanced the catalytic activity, although further doping Sn would lead to a slight drop deterioration. The highest activity (qTOF of 435 h−1) is achieved over the Pt1Sn1/CNT catalyst, which is remarkably higher than Pt monometallic catalysts.
The above results reveal that monometallic Pt is more efficient than Ru or Sn in this particular reaction. Thus, it is reasonable to suggest that the benzyl alcohol oxidation mainly occurs on Pt sites in a bimetallic catalyst. Fine tuning the ratio of Pt and promoter produces close contact between Pt and promoter sites on the alloyed bimetallic catalysts, therefore exhibiting higher activity for the benzyl alcohol oxidation. However, further addition of promoter beyond a level would cause a dilution of the Pt concentration on the catalyst surface and a depressing activity. Moreover, high selectivity towards benzaldehyde is retained (>95%) regardless of the cooperation of promoter.
Although alloying with Ru and Sn can enhance the catalytic performance of the Pt catalyst, cooperation of Sn leads to a 4-fold activity compared to Ru (qTOF = 435 and 100 h−1 for Pt1Sn1/CNT and Pt90Ru10/CNT, respectively), which suggests different roles of Ru and Sn as promoters. According to the dehydrogenation mechanism of alcohol oxidation over Pt-group metal catalysts, the adsorbed alcohol dehydrogenates in two elementary steps.7 The O–H bond of alcohol breaks upon the adsorption on surface Pt sites, resulting in the adsorbed alkoxide and Pt-hydride species. For the adsorbed alkoxide, the β-C–H bond strength is weaker than other C–H bonds, leading to the preferential breaking of the β-C–H bond in the rate-determining step. The surface hydride species must be oxidized by either adsorbed oxygen or surface OH species to shift the equilibrium towards the formation of the carbonyl compound and accelerate the reaction. For Pt90Ru10/CNT catalysts, although Ru is a noble metal element, it is not directly involved in the surface reaction. Instead, Watanabe et al. suggested that Ru would react with H2O to form Ru–OH species according to a “bi-functional mechanism”.32 Therefore, the promoting action of Ru arises mainly due to the easier chemisorption of oxygen from water to form Ru–OH, which reacts with adjacent Pt–H species, thus enhancing the reaction by liberating free surface Pt sites.
On the contrary, Sn is a non-noble metal element and has no catalytic activity when used as catalyst alone. According to the Vegard’s law for a Pt–Sn alloy, the value of the Pt lattice parameter would decrease when cooperated with Sn. It is possible that the alloying Sn atoms may invoke modification of the electronic environment around Pt atoms in the Pt–Sn alloy. Previous XPS results also verify a significant electron transfer from less electronegative Sn to the more electronegative Pt (Fig 7). Therefore, the strong electronic interaction greatly accelerated the dehydration, which is the rate-limiting step for the benzyl alcohol oxidation, leading to a superior activity compared to Pt–Ru catalyst.
The time-conversion relationships were examined over the two optimal catalysts Pt90Ru10/CNT and Pt1Sn1/CNT, respectively.
Fig 8 shows the influence of reaction time on benzyl alcohol conversion and product selectivity over Pt90Ru10/CNT catalyst. Over 90% benzaldehyde selectivity can be reached as long as the benzyl alcohol conversion is less than 60%. With longer reaction duration, the conversion of benzyl alcohol and selectivity towards benzoic acid increase, whereas the selectivity towards benzylaldehyde decreases. Benzaldehyde is the only product at the initial stage of the reaction, evidencing that benzyl alcohol oxidation to benzoic acid proceeds through the intermediate of benzaldehyde. It is beneficial to avoid operating this benzyl alcohol oxidation in a kinetic region in a batch reactor because the active sites are successively oxidized and their activities decline. During the first 3 h reaction, the reaction rate is constant (linear correlation between conversion and reaction time), implying that this reaction is operated under an oxygen-transport-limited regime, i.e., the rate of oxygen supply is lower than that of alcohol dehydrogenation. The reaction rate is remarkably lower after 3 h, suggesting a suppressed reaction activity. Garcia et al. have reported a similar phenomenon during the oxidation of glycerol in aqueous solutions over Pt/C catalyst and proposed that the reaction rate for the oxidation of alcohols over platinum metals is directly proportional to the pH value.33 After long-term reactions, large amounts of benzoic acid were formed due to over-oxidation of benzyl alcohol, resulting in a lower pH and-catalyst deactivation.
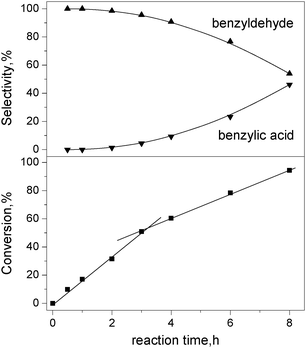 | ||
| Fig. 8 Effect of reaction time of conversion and selectivity in benzyl alcohol oxidation over Pt90Ru10/CNT catalyst. Condition: substrate = 3 mmol; deionized water = 15 mL, substrate/metal = 500 mol/mol, T = 80 °C, O2 = 25 mL min−1. | ||
For Pt1Sn1/CNT, Fig 9 shows the influence of reaction time on benzyl alcohol conversion and product selectivity over it, the conversion of benzyl alcohol increases monotonically with the reaction time, reaching 100% after 2 h. The curve is fitted with first-order reaction kinetics, giving a rate constant of 1.06 ± 0.16 h−1. The selectivity toward benzaldehyde is high at the initial stage while it gradually deteriorates at longer reaction times, which is ascribed to the formation of benzoic acid by further oxidation of benzaldehyde. Therefore, Sn is more effective as a promoter for Pt-based catalysts, which is attributed to the strong electronic effect.
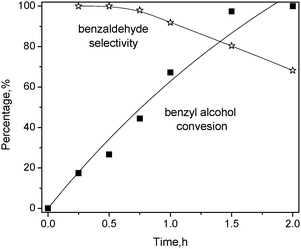 | ||
| Fig. 9 Effect of reaction time on benzyl alcohol oxidation over Pt1Sn1/CNT catalyst. Condition: substrate = 3 mmol; deionized water = 15 mL, catalyst = 20 mg, T = 80 °C, O2 = 25 mL min−1. | ||
3.3 Effect of supports
CNT support was benchmarked against other carbon supports, e.g., un-functionalized CNT (CNT-p), activated carbon (AC) and graphite. The Pt–Ru and Pt–Sn bimetallic catalysts on different supports are prepared using the same MAPR method and their catalytic properties are significantly dependent on the supports, as shown in Table 3 and 4. For Pt–Ru series catalysts, the acid-functionalized CNT outperforms other supports, showing the highest benzyl alcohol conversion (52.5%) and comparable benzaldehyde selectivity (96.5%). When doped with Sn, the best performance was also obtained over CNT supports, which is significantly higher than the other supports. The surface properties of the support remarkably affect the particle size and size distribution of Pt or Pt alloy nanoparticles during the deposition process as well as the metal-support interaction and the corresponding activities during the reaction. CNT functionalized by acid pretreatment generates abundant oxygen-containing groups on the sidewalls and tube tips, which improve the hydrophilicity of the CNT surface, provide sites for deposition of PtCl62− ions, and thereby result in homogeneously dispersed Pt–Ru nanoparticles with narrow particle size distributions on CNT, as confirmed in TEM results.34,35 On the other hand, the conical stacking structure creates abundant dangling bonds on the surface of herringbone CNTs, which reduce the coordination number of the metal atom with carbon.36 Zhang et al. demonstrated that the metal particles can epitaxially grow on the (0001) basal surface plane of graphite, and small and highly dispersed nanoparticles are prone to form on the surface of herringbone CNT.37 In addition, the tubular structure and mesoporous open-ended morphology of CNT decrease the diffusion resistance and facilitate the transport and adsorption of substrates onto nanoparticles. These made the acid-functionalized CNT a superior support for bimetallic catalysts.| Entry | Catalyst | Content,c wt% | Conv., % | Select., % | qTOF,d h−1 | |
|---|---|---|---|---|---|---|
| Pt | Ru | |||||
| a Condition: substrate = 3 mmol; deionized water = 15 mL, substrate/metal = 500 mol/mol, T = 80 °C, t = 3 h, O2 = 25 mL min−1. b Pristine CNT without acid-treatment was used as support. c Metal contents were tested by ICP. d qTOF is calculated using the (Pt + Ru) metal content obtained from ICP. | ||||||
| 1 | Pt90Ru10/CNT | 4.4 | 0.4 | 52.5 | 96.5 | 100 |
| 2 | Pt90Ru10/CNT-pb | 4.7 | 0.4 | 28.2 | 97.6 | 51 |
| 3 | Pt90Ru10/AC | 4.2 | 0.5 | 35.6 | 96.0 | 63 |
| 4 | Pt90Ru10/Graphite | 4.1 | 0.4 | 25.5 | 94.8 | 51 |
| Entry | Catalyst | Content,c wt% | Conv., % | Select., % | qTOF,d h−1 | |
|---|---|---|---|---|---|---|
| Pt | Ru | |||||
| a Condition: substrate = 3 mmol; deionized water = 15 mL, catalyst = 20 mg, T = 80 °C, t = 1 h, O2 = 25 mL min−1. b Pristine CNT without acid-treatment was used as support. c Metal contents were tested by ICP. d qTOF is calculated using the Pt content obtained from ICP. | ||||||
| 1 | Pt1Sn1/CNT | 4.52 | 2.27 | 67.2 | 91.9 | 435 |
| 2 | Pt1Sn1/CNT-pb | 5.10 | 2.96 | 47.7 | 97.6 | 274 |
| 3 | Pt1Sn1/AC | 3.41 | 2.15 | 27.4 | 100 | 235 |
| 4 | Pt1Sn1/Graphite | 4.87 | 2.25 | 36.8 | 92.5 | 221 |
4. Conclusions
Pt catalysts supported on carbon nanotubes were prepared by microwave-assisted a polyol reduction method, which outperformed the traditional impregnation or deposition precipitation method, resulting in homogeneously dispersed particles with narrow size distribution and enhanced surface Pt exposure. The catalytic performance was examined for the aerobic oxidation of benzyl alcohol in a base-free aqueous solution under mild conditions. Finely alloying Pt with Ru or Sn with appropriate ratio to form bimetallic alloys can effectively improve the catalytic activity while retaining good benzaldehyde selectivity. The characterization results reveal that Ru promoted the reaction by reacting with the surface of the Pt-hydride species to liberate free Pt active sites while the addition of Sn enhances the electronic transfer during the dehydrogenation. Moreover, acid functionalized CNT was identified as the superior support due to its hydrophilic surfaces, conical stacking structures, and tubular structure with mesoporous open-ended morphology.Notes and references
-
M. Hudlicky, Oxidations in Organic Chemistry, ACS, Washington DC, 1990 Search PubMed
.
- T. Mallat and A. Baiker, Chem. Rev., 2004, 104, 3037 CrossRef CAS
.
- R. A. Sheldon, I. Arends and A. Dijksman, Catal. Today, 2000, 57, 157 CrossRef CAS
.
- R. A. Sheldon, I. W. C. E. Arends, G.-J. t. Brink and A. Dijksman, Acc. Chem. Res., 2002, 35, 774 CrossRef CAS
.
-
R. A. Sheldon and J. K. Kochi, Metal-Catalyzed Oxidation of Organic Compounds, Academic Press, New York, 1981 Search PubMed
.
- R. A. Sheldon, M. Wallau, I. Arends and U. Schuchardt, Acc. Chem. Res., 1998, 31, 485 CrossRef CAS
.
- G. J. ten Brink, I. Arends and R. A. Sheldon, Science, 2000, 287, 1636 CrossRef CAS
.
- Y. M. A. Yamada, T. Arakawa, H. Hocke and Y. Uozumi, Angew. Chem., Int. Ed., 2007, 46, 704 CrossRef CAS
.
- W. C. Ketchie, Y. L. Fang, M. S. Wong, M. Murayama and R. J. Davis, J. Catal., 2007, 250, 94 CrossRef CAS
.
- A. Corma and H. Garcia, Chem. Soc. Rev., 2008, 37, 2096 RSC
.
-
(a) N. Dimitratos, J. A. Lopez-Sanchez, D. Morgan, A. F. Carley, R. Tiruvalam, C. J. Kiely, D. Bethell and G. J. Hutchings, Phys. Chem. Chem. Phys., 2009, 11, 5142 RSC
; (b) C. D. Pina, E. Falletta and M. Rossi, J. Catal., 2008, 260, 384 CrossRef
.
- V. Radmilovic, T. J. Richardson, S. J. Chen and P. N. Ross, J. Catal., 2005, 232, 199 CrossRef CAS
.
- D. R. Rolison, P. L. Hagans, K. E. Swider and J. W. Long, Langmuir, 1999, 15, 774 CrossRef CAS
.
- Z. Guo, Y. Chen, L. Li, X. Wang, G. L. Haller and Y. Yang, J. Catal., 2010, 276, 314 CrossRef CAS
.
- C. M. Zhou, Y. T. Chen, Z. Guo, X. Wang and Y. H. Yang, Chem. Commun., 2011, 47, 7473 RSC
.
- E. P. Maris, W. C. Ketchie, M. Murayama and R. J. Davis, J. Catal., 2007, 251, 281 CrossRef CAS
.
- D. Liu, Y. M. López-De Jesús, J. R. Monnier and C. T. Williams, J. Catal., 2010, 269, 376 CrossRef CAS
.
- Y. T. Chen, H. P. Wang, C. J. Liu, Z. Y. Zeng, H. Zhang, C. M. Zhou, X. L. Jia and Y. H. Yang, J. Catal., 2012, 289, 105 CrossRef CAS
.
- V. R. Choudhary, R. Jha and P. Jana, Green Chem., 2007, 9, 267 RSC
.
- E. Antolini, L. Giorgi, F. Cardellini and E. Passalacqua, J. Solid State Electrochem., 2001, 5, 131 CrossRef CAS
.
- J. H. Kim, S. M. Choi, S. H. Nam, M. H. Seo, S. H. Choi and W. B. Kim, Appl. Catal., B, 2008, 82, 89 CrossRef CAS
.
- F. Peng, C. M. Zhou, H. J. Wang, H. Yu, J. H. Liang and J. A. Yang, Catal. Commun., 2009, 10, 533 CrossRef CAS
.
- G. Neri, C. Milone, S. Galvagno, A. P. J. Pijpers and J. Schwank, Appl. Catal., A, 2002, 227, 105 CrossRef CAS
.
- S. M. Choi, M. H. Seo, H. J. Kim and W. B. Kim, Synth. Met., 2011, 161, 2405 CrossRef CAS
.
- F. Li, Q. H. Zhang and Y. Wang, Appl. Catal., A, 2008, 334, 217 CrossRef CAS
.
- Y. T. Chen, H. J. Zheng, Z. Guo, C. M. Zhou, C. Wang, A. Borgna and Y. H. Yang, J. Catal., 2011, 283, 34 CrossRef CAS
.
- D. Chu and S. Gilman, J. Electrochem. Soc., 1996, 143, 1685 CrossRef CAS
.
- Z. Zhou, W. Li, P. Guo, H. Yang, X. Xiang, L. Zeng and Z. Fu, J. Solid State Electrochem., 2010, 14, 191 CrossRef CAS
.
- B. Beden, C. Lamy, N. R. Detacconi and A. J. Arvia, Electrochim. Acta, 1990, 35, 691 CrossRef CAS
.
- J. H. Zeng, J. Y. Lee and W. J. Zhou, Appl. Catal., A, 2006, 308, 99 CrossRef CAS
.
- Z. Jusys, J. Kaiser and R. J. Behm, Electrochim. Acta, 2002, 47, 3693 CrossRef CAS
.
- M. Watanabe and S. Motoo, J. Electroanal. Chem., 1975, 60, 267 CrossRef CAS
.
- R. Garcia, M. Besson and P. Gallezot, Appl. Catal., A, 1995, 127, 165 CrossRef CAS
.
- Y. Xing, J. Phys. Chem. B, 2004, 108, 19255 CrossRef CAS
.
- K.-i. Tanaka, M. Shou, H. Zhang, Y. Yuan, T. Hagiwara, A. Fukuoka, J. Nakamura and D. Lu, Catal. Lett., 2008, 126, 89 CrossRef CAS
.
- X. Fu, H. Yu, F. Peng, H. Wang and Y. Qian, Appl. Catal., A, 2007, 321, 190 CrossRef CAS
.
- Y. H. Zhang, M. L. Toebes, A. van der Eerden, W. E. O'Grady, K. P. de Jong and D. C. Koningsberger, J. Phys. Chem. B, 2004, 108, 18509 CrossRef CAS
.
| This journal is © The Royal Society of Chemistry 2013 |
