Computational screening of functionalized zinc porphyrins for dye sensitized solar cells†
Received 19th June 2013, Accepted 30th September 2013
First published on 3rd October 2013
Abstract
An efficient dye sensitized solar cell (DSSC) is one possible solution to meet the world's rapidly increasing energy demands and associated climate challenges. This requires inexpensive and stable dyes with well-positioned frontier energy levels for maximal solar absorption, efficient charge separation, and high output voltage. Here we demonstrate an extensive computational screening of zinc porphyrins functionalized with electron donating side groups and electron accepting anchoring groups. The trends in frontier energy levels versus side groups are analyzed and a no-loss DSSC level alignment quality is estimated. Out of the initial 1029 molecules, we find around 50 candidates with level alignment qualities within 5% of the optimal limit. We show that the level alignment of five zinc porphyrin dyes which were recently used in DSSCs with high efficiencies can be further improved by simple side group substitutions. All frontier energy levels, gaps and level alignment quality values are stored in a database publicly available.
1 Introduction
The limited access to fossil fuels and the CO2 related climate problems have made the search for efficient sustainable energy sources one of the most important challenges of our time. Since the emergence of the first efficient system in 1991,1 dye sensitized solar cells (DSSCs) have been intensively researched due to their potential as a cost-efficient and flexible alternative to conventional solar cells.2 The working mechanisms of a DSSC are illustrated schematically in Fig. 1. Incoming photons from the sun are absorbed by a molecular dye, which is anchored to a semi-conductor nanoparticle (typically TiO2). The excited electrons on the dye are transferred to the conduction band of the semiconductor in an ultrafast charge separation process, and extracted to an external circuit. In the last step the electron is transferred from the counter electrode back to the dye by an electrolyte. The many steps involved in a DSSC cycle impose several constraints on the properties of the dye molecule. In addition to being stable under illumination and in contact with the often corrosive electrolyte, the alignment of the highest occupied molecular orbital (HOMO) and the lowest unoccupied molecular orbital (LUMO) with the redox potential of the electrolyte and the conduction band of the semiconductor, respectively, as well as a large overlap of the absorption spectrum with the solar spectrum, are crucial properties. The use of porphyrin based dyes has very recently been demonstrated as a very successful path.3 In addition to the large absorption of visible light, porphyrins are easily customized by introducing side groups. A special scheme for functionalizing porphyrins is the donor–π-acceptor structure in which the HOMO is mainly located on the donor side groups while the LUMO is mostly located on the acceptor group. This construction entails a natural separation of the electron and the hole thereby minimizing the recombination rate. Furthermore, if the acceptor acts as an anchoring group to the semi-conductor surface, the rate of electron injection from the dye to the semi-conductor is increased. Using this concept a record efficiency of 12.3% has recently been reported for a zinc porphyrin based DSSC with a cobalt based electrolyte.4 As an example of a porphyrin-based donor–π–acceptor system, we show the HOMO and the LUMO of the M3T2P dye5 in Fig. 2. Here the separation of the HOMO and the LUMO is clearly seen.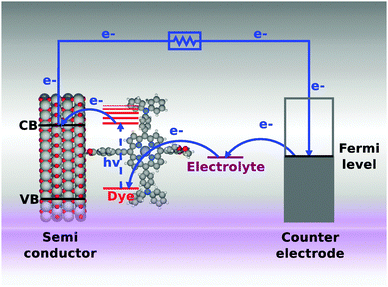 |
| | Fig. 1 Schematic overview of the working mechanisms of a dye sensitized solar cell (DSSC). | |
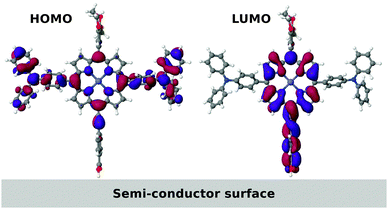 |
| | Fig. 2 Visual representation of the calculated HOMO (left) and LUMO (right) of the donor–π-acceptor M3T2P zinc porphyrin dye molecule. | |
The tremendous increase of computational power over the last couple of decades, in combination with methodological improvements, has made it possible to guide the development of new materials using first principles quantum mechanical calculations. Previous examples include highly stable metal alloys,6 semiconductor superlattices with tailored band gaps,7 battery cathode materials,8 inorganic scintillator materials9 as well as molecules for organic photovoltaics10–13 and materials for photo-catalytic water splitting.14,15 In this paper, we introduce the use of large-scale computational tools to search for optimal donor–π–acceptor porphyrin based dyes. We present the calculated frontier energy levels, orbitals, and optical gaps for 1029 functionalized zinc porphyrin dye candidates. Based on this we investigate trends in the selective tuning of energy levels and orbital shapes and estimate a (loss-less) DSSC level alignment quality of the candidate molecules. As a concrete example we suggest how the level alignment of five experimentally investigated dyes can be improved. All calculated data are available in the database Computational Materials Repository at the web address http://cmr.fysik.dtu.dk/.
2 Methods
In this screening project we investigate zinc porphyrins functionalized by different side groups and anchor groups. The zinc porphyrin backbone is shown in Fig. 3, where the R1, R2 and R3 labels denote side group locations and A denotes the anchor group location. A total of seven different side groups (see Fig. 4) and three different anchor groups (see Fig. 5) have been chosen for this study. The TPA, MOTPA and TMP side groups as well as the EthynPhA anchor group have been investigated experimentally by Liu et al.,5 the DMP, DTBP and DTA side groups are modified versions of those investigated experimentally by Yella et al.4 and the 2CarboxyPropenA and 2CyanoPropenA anchor groups have been investigated theoretically by Lee et al.16 The groups have generally been chosen to represent well-known building blocks that should be experimentally available. An example of this is the choice of the EthynPhA anchor group which is a commonly used group. The last two anchoring groups have been chosen to offer a comparison to the EthynPhA group. Furthermore, the donating side groups have been chosen to include comparable groups offering a wide spectra in size. All quantum mechanical calculations are performed using density functional theory (DFT)17 with the PBE18,19 exchange–correlation functional as implemented in the GPAW code.20 For all standard calculations we have used a basis set of numerical atomic orbitals21 (LCAO mode) with a double-ζ polarized basis set, a grid-spacing of 0.18 and a unit cell with 5.0 Å vacuum added on both sides of the molecule in all directions. All structures have been optimized using the BFGS method as implemented in the Atomic Simulation Environment (ASE)22 until all forces are below 0.05 eV Å−1. After the geometry optimization the location of the HOMO, EHOMO and LUMO, ELUMO, is calculated as the ionization potential IP and electron affinity EA of the molecule. Thus the resulting gap, Egap, is given by:| |  | (1) |
where E[0] is the ground state total energy and E[−1] and E[+1] is the total energy of the negatively and positively charged ions of the molecule, respectively. This definition of Egap avoids the use of Kohn–Sham eigenvalues which are well-known to be inaccurate within PBE. The choice of level of theory reflects the large amount of calculations necessary to perform this study. It can be noted that the obtained EHOMO values are in good agreement with results obtained from PBE calculations with the all-electron Gaussian09 program suite23 and the high-end Coupled-Cluster results obtained using the Molpro program suite.24 For the ELUMO the agreement is worse with differences up to ≈0.2 eV between PBE and both the Gaussian09 DFT and Coupled-Cluster values. However, as will be discussed later, the LUMO energy will not be used for the final level alignment quality calculations. For more details see Tables S1 and S2 in the ESI.† To investigate the quality of the GGA type PBE functional, a comparison between results obtained using the hybrid B3LYP25–27 and results obtained using PBE for a wide range of zinc porphyrins is given in the ESI† (see Fig. S1–S3). Here a constant shift of up to 0.5 eV is observed for EHOMO and Egap. However, since the shift is constant, the trends for both levels of theory are the same and thus we expect that using PBE will be sufficient. In addition to the fundamental gap, the optical gaps, E1, which include the electron–hole interactions, are calculated. This is done by forcing the molecule to the triplet groundstate by fixing the magnetic moment, and thus promoting one of the two electrons in the HOMO to the LUMO. We denote this method triplet ΔSCF. Note that this is not the same as the normal singlet ΔSCF method implemented in GPAW.28 The latter provides a more realistic description of the optical transition (which does not involve spin flip), but is less robust and can be difficult to converge for some of the molecules investigated. The excitation energies calculated by the singlet ΔSCF method are observed to be up to 0.3 eV (see Table S3 in the ESI†) higher than those predicted by the triplet ΔSCF method. However, the robustness problems of the singlet ΔSCF force us to use the triplet ΔSCF method.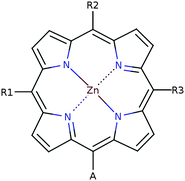 |
| | Fig. 3 Labeling of positions in the zinc porphyrin backbone structure. | |
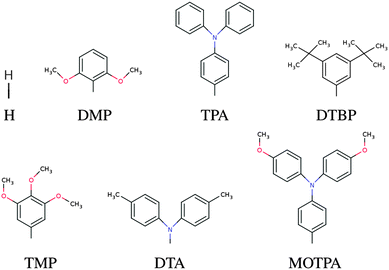 |
| | Fig. 4 The donor groups investigated in this work. | |
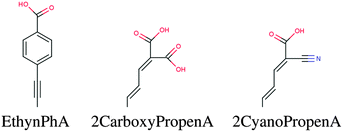 |
| | Fig. 5 The accepting anchor groups investigated in this work. | |
A comparison between the calculated EHOMO, Egap and E1 energies and corresponding experimental values obtained by Liu et al.5 is given in Table 1. The experimental data have been obtained for dyes on a TiO2 film in acetonitrile and the values have been converted to a vacuum scale using a value for the Normal Hydrogen Electrode (NHE) of −4.5 eV versus vacuum.29–31 For the T2P, MT2P and M3T2P species an excellent agreement between calculations and experimental values are observed, while the agreement is slightly worse for the T3P and MT3P species. We stress that the effect of hybridization and image charge screening32 by the TiO2 surface as well as the effect of solvent on the HOMO energies have not been included in the calculations. The trends for the calculated optical gaps, E1, are in good agreement with the measured values, however, with the tendency that the calculated values are approximately 0.3–0.4 eV too low. Part of this discrepancy can be explained by the approximately 0.2 eV underestimation coming from the use of the triplet rather than singlet excitation (see ESI†). Furthermore, the experimental E1 values are obtained from the absorption edge of the adsorbed dyes and can thus in addition to the simple HOMO → LUMO transition also include higher energy transitions. In fact, the main features in the absorption spectrum of porphyrins are known to involve higher lying transitions.33 Based on these observations, we conclude that our method can be used to predict general tendencies for changes in EHOMO, ELUMO and E1 upon functionalizing zinc porphyrins at a semi-quantitative level.
Table 1 Comparison between calculated EHOMO, Egap and E1 and experimental EHOMO and E1 obtained by Liu et al.5 for a set of zinc porphyrins with the EthynPhA anchor group. The experimental data are obtained for dyes on a TiO2 film in acetonitrile
| Namea | R1 | R2 | R3 | EHOMO (eV) | exp. EHOMOb (eV) | Egap (eV) | E1 (eV) | exp. E1 (eV) |
|---|
| Name used by Liu et al.5 Experimental potentials modified to be relative to vacuum using the potential of NHE vs. vacuum of −4.5 eV.29–31 |
|---|
| T2P | TPA | H | TPA | −5.63 | −5.60 | 3.88 | 1.54 | 1.84 |
| T3P | TPA | TPA | TPA | −5.38 | −5.59 | 3.57 | 1.41 | 1.79 |
| MT2P | MOTPA | H | MOTPA | −5.29 | −5.26 | 3.62 | 1.49 | 1.83 |
| MT3P | MOTPA | MOTPA | MOTPA | −5.01 | −5.25 | 3.30 | 1.35 | 1.78 |
| M3T2P | TPA | TMP | TPA | −5.47 | −5.49 | 3.73 | 1.46 | 1.82 |
In order to identify the optimal electronic spectrum of the dyes relative to the semiconductor conduction band edge, we have defined a level alignment quality of a DSSC:
| |  | (2) |
where:
Here
Ec −
EH is the distance from the HOMO level to the conduction band,
E1 is the optical gap of the dye,
Θ(
E −
E1) is a step function representing the absorption of the dye molecules,
Isolar(
E) is the photon flux of the ASTM G-173-03 (AM 1.5 G) solar spectrum (see Fig. S4 in ESI
†), and
Voc is the open-circuit voltage. The level alignment quality is normalized by the solar effect:

. A visual representation of
Ec −
EH and
E1 is given in
Fig. 6. The use of the
Θ(
E −
E1) step function to represent the dye absorption is based on the assumption that all solar photons with an energy higher than
E1 of the dye are absorbed by the dye molecules. This is a reasonable assumption for strongly absorbing porphyrin based dyes
3 in the usual DSSC setup where the effective area of dyes on the nanostructured semiconductor surface corresponds to several monolayers. Variations in the absorption spectrum of the different porphyrins may still influence the realistically obtainable level alignment quality. However, calculation of these features is not possible for a large screening project due to the high computational cost. We note that the level alignment quality is comparable to a DSSC efficiency where all losses have been neglected. In reality, however, many other critical factors have an influence on the overall efficiency of a DSSC and it should be stressed that we do not claim to include these in the present study. Our emphasis is only on the possibility of systematically improving the level alignment.
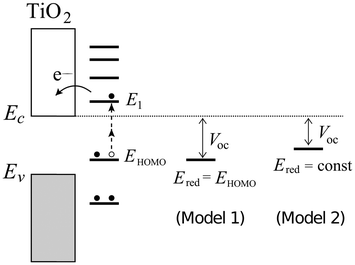 |
| | Fig. 6 Diagram visualizing the Ec − EH and E1 energies relative to the HOMO of the dye. In the model the Voc has been defined for either a perfectly aligned redox potential (model 1) where Voc = Ec − EH or for a fixed redox potential (model 2) with Voc = 1 V. | |
3 Results and discussion
3.1 Trends in energy levels
The calculated values of EHOMO and ELUMO plotted against Egap are shown in Fig. 7. It is observed that the variation in Egap, for a fixed anchor group, to a large extent is caused by a shift in the HOMO energy for the differently functionalized porphyrins. The LUMO is determined by the anchor group. In Table 2 we list the molecules showing the largest and smallest values of the three quantities EHOMO, ELUMO and Egap, respectively. It can be seen that the maximum difference in ELUMO is ∼1.0 eV while the maximum difference in EHOMO is ∼1.7 eV. This leads to the possibility of tuning Egap by up to ∼2.1 eV and demonstrates the great flexibility in energy level design offered by functionalized porphyrins.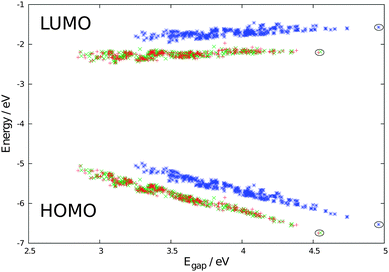 |
| | Fig. 7 Calculated corresponding EHOMO and ELUMO relative to vacuum ordered by the resulting Egap of functionalized zinc porphyrins with the EthynPhA (blue star), 2CarboxyPropenA (green ×) and 2CyanoPropenA (red cross) anchor groups. The black circles indicate the porphyrins with only hydrogen side groups. | |
Table 2 EHOMO, ELUMO and Egap for selected zinc porphyrins
| A | R1 | R2 | R3 | EHOMO (eV) | ELUMO (eV) | Egap (eV) |
|---|
| Largest value of all candidates. Smallest value of all candidates. |
|---|
| EthynPhA | H | H | H | −6.53 | −1.57 | 4.96a |
| 2CyanoPropenA | MOTPA | DTA | MOTPA | −5.17 | −2.33 | 2.85b |
| EthynPhA | MOTPA | MOTPA | MOTPA | −4.99a | −1.69 | 3.30 |
| 2CyanoPropenA | H | H | H | −6.74b | −2.21 | 4.54 |
| EthynPhA | TMP | TMP | TMP | −5.54 | −1.46a | 4.08 |
| 2CyanoPropenA | DTA | DTA | DTA | −5.58 | −2.47b | 3.11 |
The zinc porphyrins with the MOTPA, DTA and TPA side groups exhibit particularly small energy gaps. A simple explanation for this trend can be obtained by comparing EHOMO of the pure zinc porphyrin with EHOMO of the protonated side groups given in Table 3. According to first order perturbation theory, the interaction between the HOMO of the pure zinc porphyrin and the side group HOMO should be proportional to the inverse of the energy difference and thus the smallest energy differences should result in the largest interactions. From the table it follows that it is indeed the HOMOs of the MOTPA, DTA and TPA side groups that are closest in energy to the HOMO of the pure zinc porphyrin, and thus our findings are in agreement with the expectations from perturbation theory. This suggests that future selection of side groups to be investigated could be guided by EHOMO for the protonated side group.
Table 3 EHOMO and ELUMO for the pure zinc porphyrin backbone and the protonated side and anchor groups
| Group | EHOMO (eV) | ELUMO (eV) |
|---|
| DMP | −7.65 | 2.08 |
| TPA | −6.75 | 0.42 |
| MOTPA | −6.49 | 0.58 |
| TMP | −7.04 | 2.23 |
| DTA | −6.70 | 0.99 |
| DTBP | −8.22 | 1.61 |
| |
| EthynPhA | −8.56 | −0.24 |
| 2CarboxyPropenA | −9.24 | −1.04 |
| 2CyanoPropenA | −9.37 | −1.03 |
| |
| Backbone ZnP | −6.79 | −1.35 |
Since the energy differences between the LUMOs of the side groups and the LUMO in the pure zinc porphyrin are significantly larger than the energy differences for the HOMOs (see Table 3) we can furthermore understand why ELUMO is shifted less than EHOMO upon functionalization of the porphyrins with the donating side groups. Visual inspection of the frontier orbitals of the pure porphyrin and two representative functionalized porphyrins is given in Fig. S5 in the ESI.† From these plots it follows that the change in the spatial shape of the HOMO/LUMO orbitals follows the trend observed for the energy shifts. Specifically, the HOMO of the DMP functionalized porphyrin is very similar to that of the pure zinc porphyrin, while the HOMO of the DTA functionalized porphyrin is pulled towards the side group. The differences in the LUMO orbitals for the three zinc porphyrins are also found to be minor compared to the differences in the HOMOs, which is again consistent with previously discussed results.
Exactly the same trends found for the donating side groups apply to the accepting anchor groups. Table 3 shows that the LUMO of the protonated 2CarboxyPropenA and 2CyanoPropenA anchor groups matches the LUMO of the zinc porphyrin much better than the LUMO of the protonated EthynPhA. This is consistent with the observation that functionalization of the zinc porphyrin by the two former anchor groups has the largest effect on the LUMO (by around −0.5 eV).
It is important to note that Egap corresponds to the differences between the HOMO and the LUMO, i.e. the fundamental energy gap. In optical absorption, the attraction between the electron and the hole left behind (the electron–hole interaction) will allow for absorption of photons with energy less than Egap. In Fig. S6 in the ESI,† we show that Egap is essentially linearly correlated with the optical gap, E1. The range of variation of E1, however, is decreased from 2.1 eV observed for Egap to approximately 0.6 eV. This is as expected since the Coulombic attraction between the electron and the hole depends strongly on the distance between the charges. Since the porphyrins with the largest Egap have both the HOMO and the LUMO located on the porphyrin backbone, these porphyrins have a higher electron–hole interaction than porphyrins with smaller Egap thus decreasing the range of E1.
3.2 Level alignment quality
To calculate the level alignment quality as defined in eqn 2, we use two different models for the open circuit voltage, see Fig. 6. The first model assumes a perfect alignment of the dye HOMO with the redox level of the electrolyte and thus sets Voc = Ec − EH. This assumption is mostly used to illustrate the clean effect of the choice of dyes since a realistic cell will have a specific electrolyte and thus a fixed theoretical Voc. However, the assumption of a perfect alignment may soon be very relevant to the emergence of high-efficiency DSSCs incorporating a variety of cobalt- and sulfur-based electrolytes.4,34–36Fig. 8 gives the level alignment quality as a function of Ec − EH and E1 under this assumption. The Ec − EH value is determined as the energy difference between the HOMO and the conduction band position of TiO2, which is set to −4.0 eV relative to vacuum.5 Using a single value for the conduction band position of TiO2 is an assumption since the titania films used in DSSCs are typically amorphous films made from sintered nanoparticles of TiO2 and can therefore be expected to display a band structure that deviates significantly from that of a crystalline semiconductor. Furthermore it can be noted that the charge injection rates differ depending on which crystallographic surface of TiO2 is exposed.37 However, having constructed the database the level alignment quality of the candidate dyes can always be re-ranked by using different input parameters, e.g. one might use an acid surface treatment to shift the quasi-Fermi level of the titania film.38 However, using the value of −4.0 eV for the conduction band position, the predicted values for the investigated zinc porphyrins with the EthynPhA anchor group (purple triangle) are in general seen to be close to the maximum level alignment quality. Especially the candidates with an intermediate modification of the HOMO and thus intermediate E1 and Ec − EH, are within a predicted high-quality zone. To obtain a higher level alignment quality it is however desired to have a shift to lower E1 values while retaining a fixed HOMO position. This can be achieved by tuning only the LUMO level, which is done by changing the anchor group. The desired shift is exactly observed for the zinc porphyrins with the 2CarboxyPropenA (red squares) and 2CyanoPropenA (yellow circles) anchor groups. Several of these candidates have values lying almost perfectly in the predicted highest level alignment quality zone with the best candidates having optical gaps (E1) in the range 1.0–1.1 eV and HOMO levels positioned around 1.2 eV below Ec.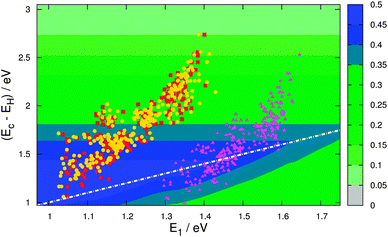 |
| | Fig. 8 η as a function of Ec − EH and E1 with Voc = Ec − EH (model 1). The points in the plot indicate the location of the investigated zinc porphyrins with the EthynPhA (purple triangle), 2CarboxyPropenA (red square) and 2CyanoPropenA (yellow circle) anchor groups using triplet ΔSCF values for E1 and assuming TiO2 as the semi-conductor with a conduction band located at −4.0 eV relative to vacuum. The white dotted line indicates the location where Ec − EH = E1. | |
Another more experimentally realistic definition of Voc can be obtained by assuming the use of the I−/I3− redox pair, which remains the most common choice of DSSC electrolyte. Under such conditions Voc will not be dictated by Ec − EH but rather by the dye independent Ec − Ered where Ered is the redox potential of the electrolyte. A modified version of Fig. 8 where a constant Voc = 1 V (model 2 in Fig. 6) has been used is presented in Fig. 9. One of the largest differences between Fig. 8 and 9 is the lowering of the optimal Ec − EH due to the removal of the linear relationship between the HOMO position and η. This effect is also the reason for the general reduction in the level alignment quality. As a consequence, the zinc porphyrins with the EthynPhA anchor group now all lie outside the highest level alignment quality zone. However, the porphyrins with the other two anchor groups and low Ec − EH and E1 values are still predicted to be promising candidates. In general, the observed decrease in level alignment quality of model 2 compared to model 1 shows the importance of investigating new electrolytes with redox levels tailored to the dye molecules. In Fig. 8 and 9, a white dotted line indicating Ec − EH = E1 is added since excited electrons in molecules where Ec − EH > E1, due to thermal relaxation, can get trapped below the conduction band of the semi-conductor. However, since we in this study operate with a relatively high uncertainty we will not exclude any candidates from our investigation based on this criteria and the lines thus only serve as an indicator for the readers. Table 4 shows η for the ten best zinc porphyrin candidates with Voc = Ec − EH (model 1). In the table a preference for porphyrins with the lowest possible values for E1 is a striking feature. This can be explained by the fact that E1 sets the lower limit of absorption and a lowering of this value thus leads to an increase in the range where the solar photons are converted to DSSC electrons. To further maximize the level alignment quality, an alignment of the E1 and the Ec − EH energies is also favorable, since only excitation of the dye to a level above the conduction band of the semiconductor will give rise to the creation of a DSSC electron (see Fig. 6). However, a competition between this alignment and the linear dependence of the open-circuit voltage leads to a preference for a slightly higher Ec − EH energy for the model 1 case (Voc = Ec − EH). It can be noted that the value ηdyn = 0.49 obtained at Voc = E1 = 1.1 eV agrees well with the ultimate efficiency without recombination, u = 0.44 at E1 = 1.1 eV, reported by Shockley and Queisser.39 In the referred study they used black-body radiation for the solar spectrum in contrast to our use of the AM 1.5 G solar spectrum, which causes the small discrepancy. The recombination for a specific dye candidate is highly dependent on the overlap between the LUMO and the HOMO and an evaluation of this effect is beyond the scope of this paper.
Table 4 The ten best zinc porphyrin candidates measured on η using a dynamic Voc = Ec − EH (model 1)
| A | R1 | R2 | R3 | (Ec − EH) (eV) | E1 (eV) | ηcona | ηdynb |
|---|
| Voc = 1 V. Voc = Ec − EH. |
|---|
| 2CarboxyPropenA | DTA | MOTPA | MOTPA | 1.16 | 1.05 | 0.42 | 0.49 |
| 2CyanoPropenA | TPA | MOTPA | MOTPA | 1.17 | 1.03 | 0.42 | 0.49 |
| 2CyanoPropenA | DTA | MOTPA | MOTPA | 1.17 | 1.03 | 0.42 | 0.49 |
| 2CarboxyPropenA | MOTPA | TPA | MOTPA | 1.17 | 1.09 | 0.41 | 0.49 |
| 2CarboxyPropenA | TPA | MOTPA | MOTPA | 1.20 | 1.09 | 0.40 | 0.48 |
| 2CarboxyPropenA | MOTPA | MOTPA | MOTPA | 1.06 | 1.05 | 0.45 | 0.48 |
| 2CyanoPropenA | MOTPA | MOTPA | MOTPA | 1.06 | 1.04 | 0.45 | 0.48 |
| 2CyanoPropenA | TMP | MOTPA | MOTPA | 1.24 | 1.06 | 0.38 | 0.47 |
| 2CarboxyPropenA | MOTPA | TMP | MOTPA | 1.24 | 1.15 | 0.38 | 0.47 |
| 2CarboxyPropenA | TMP | MOTPA | MOTPA | 1.24 | 1.06 | 0.38 | 0.47 |
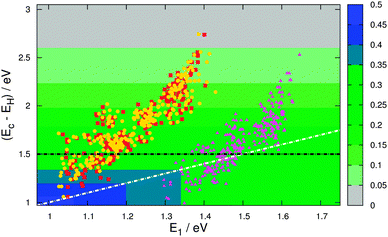 |
| | Fig. 9 η as a function of Ec − EH and E1 with a constant value of Voc = 1.0 V (model 2). The points in the plot indicate the location of the investigated zinc porphyrins with the EthynPhA (purple triangle), 2CarboxyPropenA (red square) and 2CyanoPropenA (yellow circle) anchor groups using triplet ΔSCF values for E1 and assuming TiO2 as the semi-conductor with a conduction band located at −4.0 eV relative to vacuum. The black dotted line indicates the lower limit of Ec − EH for dyes to be used with the I−/I3− electrolyte (see text) and the white dotted line indicates the location where Ec − EH = E1. | |
Using the common I−/I3− electrolyte, a theoretical Voc = Ec − Ered of around 0.9 V is obtainable.5 However, since the dye regeneration by this electrolyte is only efficient with a potential difference between the redox-potential of the electrolyte and the HOMO of the dye of more than 0.6 V,2,40–42 a value of Ec − EH ≥ 1.5 eV is required for an efficient regeneration of the dye candidates. A list of the ten best candidates with this restriction is given in Table 5. Here the preference for low values of E1 and matching of E1 and Ec − EH is again observed, but the predicted level alignment qualities (with Voc = 1 V) are significantly lower compared to the case with no restriction on the Ec − EH energy, which clearly illustrates the short-comings of the iodide based electrolyte. On the other hand, a more diverse set of dyes employing all three anchor groups is predicted to possess high level alignment quality under these conditions. This leaves room for considering more practically oriented issues when choosing an anchor group. In Table 6 we present calculated Ec − EH, E1 and η values for five experimentally investigated dyes.4,5 In general these dyes possess relatively high η values, but none of them lie within our calculated top ten candidates (model 1 in Table 4), which is mainly due to the high E1 values predicted for these dyes. All dyes have the EthynPhA anchor group and an easy way to lower the E1 values would be substituting this anchor group with the 2CarboxyPropenA or the 2CyanoPropenA anchor groups. Doing this for e.g. the MT3P dye, increases ηdyn from 0.34 to 0.48. Considering model 2 with the iodide induced restriction of Ec − EH ≥ 1.5 eV only the T2P and YD2-o-C8 dyes are relevant. To improve the level alignment quality of the rest of the candidates, a replacement of some of the side groups with e.g. the DTBP or H side groups may shift down the HOMO in energy thus increasing Ec − EH. Substituting the center TMP group in M3T2P with the DTBP group e.g. increases Ec − EH from 1.46 eV to 1.61 eV. Thus some relatively simple substitutions of side and anchor groups can lead to a better level alignment for these five dyes.
Table 5 The ten best zinc porphyrin candidates with Ec − EH ≥ 1.5 eV measured on η
| A | R1 | R2 | R3 | (Ec − EH) (eV) | E1 (eV) | ηcona | ηdynb |
|---|
| Voc = 1 V. Voc = Ec − EH. |
|---|
| EthynPhA | H | MOTPA | TMP | 1.50 | 1.45 | 0.29 | 0.43 |
| EthynPhA | H | TMP | MOTPA | 1.51 | 1.49 | 0.29 | 0.43 |
| 2CarboxyPropenA | TPA | TPA | DTA | 1.51 | 1.12 | 0.29 | 0.43 |
| 2CyanoPropenA | TPA | MOTPA | H | 1.50 | 1.17 | 0.29 | 0.43 |
| EthynPhA | DMP | DMP | MOTPA | 1.51 | 1.46 | 0.29 | 0.43 |
| 2CarboxyPropenA | MOTPA | DTA | H | 1.51 | 1.09 | 0.29 | 0.43 |
| EthynPhA | TMP | DTA | TPA | 1.51 | 1.41 | 0.29 | 0.43 |
| EthynPhA | TPA | H | TPA | 1.51 | 1.47 | 0.29 | 0.43 |
| EthynPhA | TPA | DMP | DTA | 1.51 | 1.44 | 0.29 | 0.43 |
| 2CyanoPropenA | DTA | DTA | TPA | 1.51 | 1.12 | 0.29 | 0.43 |
Table 6 Calculated Ec − EH, E1 and η values for five experimentally investigated dyes
| Name | A | R1 | R2 | R3 | (Ec − EH) (eV) | E1 (eV) | ηcona | ηdynb |
|---|
| Voc = 1 V. Voc = Ec − EH. Dyes reported by Liu et al.5 Modified version of the dye reported by Yella et al.4 |
|---|
| T2Pc | EthynPhA | TPA | H | TPA | 1.51 | 1.47 | 0.29 | 0.43 |
| T3Pc | EthynPhA | TPA | TPA | TPA | 1.45 | 1.46 | 0.30 | 0.44 |
| MT3Pc | EthynPhA | MOTPA | MOTPA | MOTPA | 0.99 | 1.35 | 0.35 | 0.34 |
| M3T2Pc | EthynPhA | TPA | TMP | TPA | 1.46 | 1.45 | 0.31 | 0.45 |
| YD2-o-C8d | EthynPhA | DMP | DTA | DMP | 1.77 | 1.48 | 0.20 | 0.36 |
4 Conclusions
We have presented a computational screening study of functionalized zinc porphyrins for use in dye sensitized solar cells. The screening procedure is based on DFT calculations providing an optimal balance between accuracy and computational cost. Specifically, the frontier energy levels and orbitals, together with the first optical excitation were calculated for 1029 zinc porphyrins with different electron donating sidegroups and electron accepting anchor groups. It was shown that this donor–π-acceptor architecture allows for selective tuning of the highest occupied (HOMO) and lowest unoccupied (LUMO) molecular orbitals by up to 2.1 eV, by varying the functional groups. The performance of the dyes was benchmarked by evaluating a loss-less DSSC level alignment quality with two different energy level alignment scenarios: (i) perfect matching of the electrolyte redox potential and the dye HOMO level, and (ii) a fixed redox potential and an overpotential of 0.6 eV corresponding to the conditions for the standard iodide electrolyte. We have furthermore investigated five experimentally used dyes and found that simple substitution of one side or one anchor group may improve the level alignment of these dyes. All investigated molecules and their calculated frontier energy levels are available in the database Computational Materials Repository at the web address http://cmr.fysik.dtu.dk/.The fact that the estimated level alignment qualities are rather high with the best candidates lying very close to the maximum limit, indicates that losses, such as recombination losses and overpotentials associated with the redox charge transfer reactions, would be important to include as part of the screening in the future. On the other hand, with the present approach one can identify a small family of dye candidates with specific energy levels and orbital properties which could then be further assessed with respect to losses, stability, synthetic- or device-related considerations. In the future it may be interesting to investigate porphyrins with other side groups and metal centers as well as different π-spacers between the backbone and the anchor group and we plan to expand the database to include several of these. Furthermore the inclusion of two or more porphyrin backbones may also be included in the search for better dyes.
Acknowledgements
The authors would like to thank Angel Rubio and Franz Himpsel for inspiring discussions. KBØ and KST would further like to thank the Danish Council for Independent Research DFF-Sapere Aude program (grant no. 11-1051390) for financial support. JMGL acknowledges support from the Spanish Ministry of Economy and Competitiveness under Projects FIS2009-07083, FIS2010-21282-C02-01 and FIS2012-30996 and through Ramon y Cajal grant RYC-2011-07782.References
- B. O'Regan and M. Grätzel, Nature, 1991, 353, 737–740 CrossRef CAS.
- A. Hagfeldt, G. Boschloo, L. Sun, L. Kloo and H. Pettersson, Chem. Rev., 2010, 110, 6595–6663 CrossRef CAS PubMed.
- L.-L. Li and E. W.-G. Diau, Chem. Soc. Rev., 2013, 42, 291–304 RSC.
- A. Yella, H.-W. Lee, H. N. Tsao, C. Yi, A. K. Chandiran, M. K. Nazeeruddin, E. W.-G. Diau, C.-Y. Yeh, S. M. Zakeeruddin and M. Grätzel, Science, 2011, 334, 629–634 CrossRef CAS PubMed.
- B. Liu, W. Zhu, Y. Wang, W. Wu, X. Li, B. Chen, Y.-T. Long and Y. Xie, J. Mater. Chem., 2012, 22, 7434–7444 RSC.
- G. H. Johannesson, T. Bligaard, A. V. Ruban, H. L. Skriver, K. W. Jacobsen and J. K. Nørskov, Phys. Rev. Lett., 2002, 88, 255506 CrossRef CAS.
- A. Franceschetti and A. Zunger, Nature, 1999, 402, 60–63 CrossRef CAS PubMed.
- G. Ceder, Y.-M. Chiang, D. R. Sadoway, M. K. Aydinol, Y.-I. Jang and B. Huang, Nature, 1998, 392, 694–696 CrossRef CAS PubMed.
- W. Setyawan, R. M. Gaume, S. Lam, R. S. Feigelson and S. Curtarolo, ACS Comb. Sci., 2011, 13, 382–390 CrossRef CAS PubMed.
- J. Hachmann, R. Olivares-Amaya, S. Atahan-Evrenk, C. Amador-Bedolla, R. S. Snchez-Carrera, A. Gold-Parker, L. Vogt, A. M. Brockway and A. Aspuru-Guzik, J. Phys. Chem. Lett., 2011, 2, 2241–2251 CrossRef CAS.
- R. Olivares-Amaya, C. Amador-Bedolla, J. Hachmann, S. Atahan-Evrenk, R. S. Sanchez-Carrera, L. Vogt and A. Aspuru-Guzik, Energy Environ. Sci., 2011, 4, 4849–4861 CAS.
- N. M. O'Boyle, C. M. Campbell and G. R. Hutchison, J. Phys. Chem. C, 2011, 115, 16200–16210 CAS.
- I. Y. Kanal, S. G. Owens, J. S. Bechtel and G. R. Hutchison, J. Phys. Chem. Lett., 2013, 4, 1613–1623 CrossRef CAS.
- I. E. Castelli, T. Olsen, S. Datta, D. D. Landis, S. Dahl, K. S. Thygesen and K. W. Jacobsen, Energy Environ. Sci., 2012, 5, 5814–5819 CAS.
- I. E. Castelli, D. D. Landis, K. S. Thygesen, S. Dahl, I. Chorkendorff, T. F. Jaramillo and K. W. Jacobsen, Energy Environ. Sci., 2012, 5, 9034–9043 CAS.
- M.-J. Lee, M. P. Balanay and D. H. Kim, Theor. Chem. Acc., 2012, 131, 1–12 CAS.
- W. Kohn and L. J. Sham, Phys. Rev., 1965, 140, A1133–A1138 CrossRef.
- J. P. Perdew, K. Burke and M. Ernzerhof, Phys. Rev. Lett., 1996, 77, 3865–3868 CrossRef CAS.
- J. P. Perdew, K. Burke and M. Ernzerhof, Phys. Rev. Lett., 1997, 78, 1396 CrossRef CAS.
- J. Enkovaara, C. Rostgaard, J. J. Mortensen, J. Chen, M. Dulak, L. Ferrighi, J. Gavnholt, C. Glinsvad, V. Haikola, H. A. Hansen, H. H. Kristoffersen, M. Kuisma, A. H. Larsen, L. Lehtovaara, M. Ljungberg, O. Lopez-Acevedo, P. G. Moses, J. Ojanen, T. Olsen, V. Petzold, N. A. Romero, J. Stausholm-Møller, M. Strange, G. A. Tritsaris, M. Vanin, M. Walter, B. Hammer, H. Häkkinen, G. K. H. Madsen, R. M. Nieminen, J. K. Nørskov, M. Puska, T. T. Rantala, J. Schiøtz, K. S. Thygesen and K. W. Jacobsen, J. Phys.: Condens. Matter, 2010, 22, 253202 CrossRef CAS PubMed.
- A. H. Larsen, M. Vanin, J. J. Mortensen, K. S. Thygesen and K. W. Jacobsen, Phys. Rev. B: Condens. Matter Mater. Phys., 2009, 80, 195112 CrossRef.
- S. Bahn and K. W. Jacobsen, Comput. Sci. Eng., 2002, 4, 56–66 CrossRef CAS.
- M. J. Frisch, G. W. Trucks, H. B. Schlegel, G. E. Scuseria, M. A. Robb, J. R. Cheeseman, G. Scalmani, V. Barone, B. Mennucci, G. A. Petersson, H. Nakatsuji, M. Caricato, X. Li, H. P. Hratchian, A. F. Izmaylov, J. Bloino, G. Zheng, J. L. Sonnenberg, M. Hada, M. Ehara, K. Toyota, R. Fukuda, J. Hasegawa, M. Ishida, T. Nakajima, Y. Honda, O. Kitao, H. Nakai, T. Vreven, J. A. Montgomery Jr, J. E. Peralta, F. Ogliaro, M. Bearpark, J. J. Heyd, E. Brothers, K. N. Kudin, V. N. Staroverov, R. Kobayashi, J. Normand, K. Raghavachari, A. Rendell, J. C. Burant, S. S. Iyengar, J. Tomasi, M. Cossi, N. Rega, J. M. Millam, M. Klene, J. E. Knox, J. B. Cross, V. Bakken, C. Adamo, J. Jaramillo, R. Gomperts, R. E. Stratmann, O. Yazyev, A. J. Austin, R. Cammi, C. Pomelli, J. W. Ochterski, R. L. Martin, K. Morokuma, V. G. Zakrzewski, G. A. Voth, P. Salvador, J. J. Dannenberg, S. Dapprich, A. D. Daniels, O. Farkas, J. B. Foresman, J. V. Ortiz, J. Cioslowski and D. J. Fox, Gaussian 09 Revision B.01, Gaussian Inc., Wallingford, CT, 2009 Search PubMed.
- H.-J. Werner, P. J. Knowles, G. Knizia, F. R. Manby, M. Schütz, P. Celani, T. Korona, R. Lindh, A. Mitrushenkov, G. Rauhut, K. R. Shamasundar, T. B. Adler, R. D. Amos, A. Bernhardsson, A. Berning, D. L. Cooper, M. J. O. Deegan, A. J. Dobbyn, F. Eckert, E. Goll, C. Hampel, A. Hesselmann, G. Hetzer, T. Hrenar, G. Jansen, C. Köppl, Y. Liu, A. W. Lloyd, R. A. Mata, A. J. May, S. J. McNicholas, W. Meyer, M. E. Mura, A. Nicklass, D. P. O'Neill, P. Palmieri, K. Pflüger, R. Pitzer, M. Reiher, T. Shiozaki, H. Stoll, A. J. Stone, R. Tarroni, T. Thorsteinsson, M. Wang and A. Wolf, MOLPRO, version 2010.1, a package of ab initio programs, 2010, see http://www.molpro.net Search PubMed.
- C. Lee, W. Yang and R. G. Parr, Phys. Rev. B: Condens. Matter Mater. Phys., 1988, 37, 785–789 CrossRef CAS.
- A. D. Becke, J. Chem. Phys., 1993, 98, 5648–5652 CrossRef CAS.
- P. J. Stephens, F. J. Devlin, C. F. Chabalowski and M. J. Frisch, J. Phys. Chem., 1994, 98, 11623–11627 CrossRef CAS.
- J. Gavnholt, T. Olsen, M. Engelund and J. Schiøtz, Phys. Rev. B: Condens. Matter Mater. Phys., 2008, 78, 075441 CrossRef.
- E. Skulason, G. S. Karlberg, J. Rossmeisl, T. Bligaard, J. Greeley, H. Jonsson and J. K. Norskov, Phys. Chem. Chem. Phys., 2007, 9, 3241–3250 RSC.
- J. E. B. Randles, Trans. Faraday Soc., 1956, 52, 1573–1581 RSC.
- E. Kötz, H. Neff and K. Müller, J. Electroanal. Chem., 1986, 215, 331–344 CrossRef.
- J. M. Garcia-Lastra, C. Rostgaard, A. Rubio and K. S. Thygesen, Phys. Rev. B: Condens. Matter Mater. Phys., 2009, 80, 245427 CrossRef.
- M. Gouterman, J. Mol. Spectrosc., 1961, 6, 138–163 CrossRef CAS.
- J.-H. Yum, E. Baranoff, F. Kessler, T. Moehl, S. Ahmad, T. Bessho, A. Marchioro, E. Ghadiri, J.-E. Moser, C. Yi, M. K. Nazeeruddin and M. Grätzel, Nat. Commun., 2012, 3, 631 CrossRef PubMed.
- M. Wang, N. Chamberland, L. Breau, J.-E. Moser, R. Humphry-Baker, B. Marsan, S. M. Zakeeruddin and M. Grätzel, Nat. Chem., 2010, 2, 385–389 CrossRef CAS PubMed.
- X. Xu, K. Cao, D. Huang, Y. Shen and M. Wang, J. Phys. Chem. C, 2012, 116, 25233–25241 CAS.
- N. Martsinovich and A. Troisi, Phys. Chem. Chem. Phys., 2012, 14, 13392–13401 RSC.
- A. Allegrucci, N. A. Lewcenko, A. J. Mozer, L. Dennany, P. Wagner, D. L. Officer, K. Sunahara, S. Mori and L. Spiccia, Energy Environ. Sci., 2009, 2, 1069–1073 CAS.
- W. Shockley and H. J. Queisser, J. Appl. Phys., 1961, 32, 510–519 CrossRef CAS.
- C. Bauer, G. Boschloo, E. Mukhtar and A. Hagfeldt, J. Phys. Chem. B, 2002, 106, 12693–12704 CrossRef CAS.
- J. N. Clifford, E. Palomares, M. K. Nazeeruddin, M. Grätzel and J. R. Durrant, J. Phys. Chem. C, 2007, 111, 6561–6567 CAS.
- D. Kuciauskas, M. S. Freund, H. B. Gray, J. R. Winkler and N. S. Lewis, J. Phys. Chem. B, 2000, 105, 392–403 CrossRef.
Footnote |
| † Electronic supplementary information (ESI) available: Method validation, the standard ASTM G-173-03 (AM 1.5 G) solar spectrum, visualization of representative frontier orbitals and a comparison between energy gaps with and without electron–hole interaction. See DOI: 10.1039/c3cp54050b |
|
| This journal is © the Owner Societies 2013 |
Click here to see how this site uses Cookies. View our privacy policy here.  Open Access Article


 . A visual representation of Ec − EH and E1 is given in Fig. 6. The use of the Θ(E − E1) step function to represent the dye absorption is based on the assumption that all solar photons with an energy higher than E1 of the dye are absorbed by the dye molecules. This is a reasonable assumption for strongly absorbing porphyrin based dyes3 in the usual DSSC setup where the effective area of dyes on the nanostructured semiconductor surface corresponds to several monolayers. Variations in the absorption spectrum of the different porphyrins may still influence the realistically obtainable level alignment quality. However, calculation of these features is not possible for a large screening project due to the high computational cost. We note that the level alignment quality is comparable to a DSSC efficiency where all losses have been neglected. In reality, however, many other critical factors have an influence on the overall efficiency of a DSSC and it should be stressed that we do not claim to include these in the present study. Our emphasis is only on the possibility of systematically improving the level alignment.


