 Open Access Article
 This Open Access Article is licensed under a
 Creative Commons Attribution 3.0 Unported Licence
Surface-charge distribution on a dielectric sphere due to an external point charge: examples of C60 and C240 fullerenes
Gerardo
Raggi
,
Anthony J.
Stace
and
Elena
Bichoutskaia
*
Department of Physical and Theoretical Chemistry, School of Chemistry, University of Nottingham, University Park, Nottingham NG7 2RD, UK. E-mail: Elena.Bichoutskaia@nottingham.ac.uk
First published on 2nd October 2013
Abstract
An analytical solution for the distribution of surface charge on a dielectric sphere due to the presence of an external point charge is presented. This solution describes how charge on the surface of the sphere is polarised in the electric field into regions of negative and positive charge. The polarisation effect (distribution of surface charge) generally varies with the separation between the sphere and the charge, and it is particularly significant at very short separations. Results obtained from the classical electrostatic model are in qualitative agreement with density functional theory calculations of charge separation in C60 and C240 fullerenes in the presence of an external point charge. This suggests that, from an electrostatic point of view, in the static electric field of external charges these molecules exhibit dielectric behaviour.
I. Introduction
An understanding of the electrostatic properties of dielectric materials has important consequences for many industrial processes and procedures. Prime examples where electrostatic effects can have a significant influence on particle behaviour include removal of fine particles and coal dust from the atmosphere in power stations,1 particle charging and deposition during powder coating,2 and the dynamic behaviour of particles in dry powder inhalers.3In an earlier publication,4 an analytical solution to the classical problem describing how charged particles of dielectric materials interact with one another was presented. Using this solution it has been possible to explain why like-charged particles of dielectric materials could attract one another, and to show that such attraction arises from a mutual polarisation of bound charge on the interacting particles due to an electric field generated by the particles.5 To obtain an analytical solution for the force between two charged particles, the position-dependent electrostatic potential was expanded as a Legendre polynomial series, and appropriate boundary conditions were introduced. Since the ability of an external field to polarise materials is an essential component of the electrostatic interaction between charged dielectric particles,6 it is important to test the validity of the adopted electrostatic approach, especially at the nano-scale, by means of comparison with relevant quantum chemical calculations.
The counterpart problem of a conducting particle in the presence of an external point charge was first proposed by Kelvin in 1845,7 which eventually led to the development of the image charge theory.6 In this paper, the analytical solution4 is adapted to the problem of a point charge placed outside a dielectric particle. The results obtained by the classical electrostatic analysis are compared with the distribution of surface charge density in C60 and C240 fullerenes computed using density functional theory (DFT). For each example, the influence of an external point charge on partial atomic charges on the fullerene molecule is investigated and compared with the polarisation charge induced on the surface of the dielectric sphere.
This study contributes to an on-going debate8–10 on whether or not a single C60 molecule can be treated as a dielectric particle. The defining characteristic of a metal, or more generally a conductor, is the presence of a finite density of states (DOS) at the Fermi level. Both photoemission experiments11 and in particular scanning tunnelling spectroscopy,12 where a fullerene is effectively incorporated into an electric circuit, find no evidence for the presence of a finite DOS at the Fermi level both for a fullerite crystal (or thin fullerene film) and individual C60 molecules. If the C60 molecule was a purely metallic particle one would expect to see metallic screening of the core–hole created in photoemission from the C 1s core level. This type of screening gives rise to a very distinctive line-shape known as the Doniach–Sunjic line profile,13 which is essentially a measure of the metallic DOS at the Fermi level. The photoemission spectrum of both highly oriented pyrolytic graphite and glassy carbon shows an asymmetric core-level peak-shape due to the collective screening of the core hole created by the photoemission process (see Fig. 3 of ref. 14). However for the C60 molecules, the core-level emission is almost symmetric along the energy axis.14,15 This suggests that the C60 molecule behaves like a dielectric particle under the influence of a static electric field.
II. Distribution of polarisation charge on the spherical interface due to the presence of external point charge
The distribution of charge on the spherical interface induced by the presence of an external point charge is derived using a Legendre polynomial expansion. A point charge of magnitude q is located outside a dielectric sphere of charge Q and radius a at a distance h = |h| from the centre of the sphere. Fig. 1 illustrates the geometry of the dielectric sphere–point charge interaction. The dielectric constant, k, of the sphere is dimensionless as it is defined as the permittivity relative to that of vacuum, i.e. k = ε/ε0, where ε0 = 8.8541878176 × 10⁻¹² F m−1.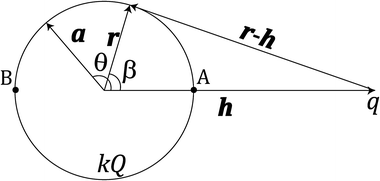 | ||
| Fig. 1 Geometric representation of the sphere–point charge interaction. | ||
The electrostatic potential Φ(r) at any point in space r is found by solving the Poisson differential equation
 | (1) |
 | (2) |
 is a proportionality coefficient. In the first term of eqn (2) there is a singularity on the surface of the sphere where |r − a| ≡ 0, which results in two separate expressions inside and outside the sphere. For r < a (inside the sphere), this term takes the form4
and for r > a (outside the sphere) it has the form
 | (3) |
 | (4) |
We impose the boundary conditions,4 which state that the normal components of the dielectric displacement field D and the tangential components of the electric field E satisfy the following equations
 | (5) |
The total charge, σ, on the surface of the sphere is defined as a sum of a uniformly distributed free charge Q and a bound polarisation charge σpolsurf. Inside the sphere, the volume density of polarization charge is zero since  (except at r = h). At the interface, therefore, the normal component of the electric field is discontinuous due to the presence of a permanent surface charge4
 | (6) |
Expansions (3) can be used to express the boundary condition (6) using Legendre polynomials to give an expression for the polarisation surface charge density
 | (7) |
 | (8) |
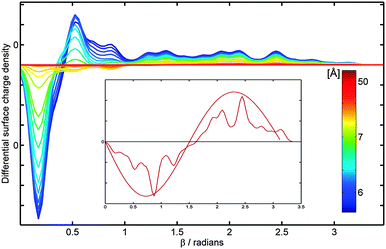
Fig. 2 shows the surface charge density distribution, obtained using eqn (8), on a neutral sphere (Q = 0) of radius a = 3.8 Å and dielectric constant k = 3.45, which has the dimensions17 and dielectric properties18 of the C60 molecule. The surface charge density for each value of the angle β has been weighted by an element of surface area, and it is presented in Fig. 2 in the form of 2πa2sin(β)σ(cosβ).5 The curves in Fig. 2 show the distribution of the surface charge as a function of the angle β (x-axis) and the separation distance h (colour labels) between the sphere and a positive point charge q = +15e. It can be seen from Fig. 2 that the surface charge density of a neutral sphere is polarized in the presence of external point charge, and the density distribution varies significantly as a function of sphere–point charge separation. The polarisation effects become more profound as the point charge is brought closer to the sphere reaching a maximum near the contact point (h = a). It turns out that a point charge continues to exert a significant influence on the neutral particle up to a separation distance of 50 Å (inset of Fig. 2). At larger separation distances (h > 50 Å), the surface charge becomes uniformly distributed over the surface, and effectively becomes independent of h. Therefore, previous treatments19–24 in which a uniform (or non-uniform but independent of the separation distance) distribution of surface charge is assumed are only valid at large separations between a polarizable particle and external charge.
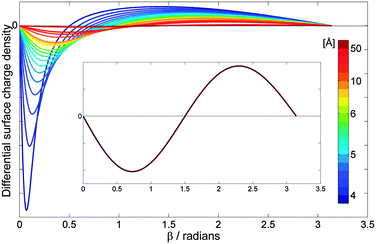 | ||
| Fig. 2 Differential surface charge density, calculated as 2πa2sin(β)σ(cosβ) using eqn (8), on a sphere representing the dimensions and dielectric properties of the C60 molecule: a = 3.8 Å k = 3.45, Q = 0. The point charge has a magnitude of q = +15e. The colour labeling is used to represent the separation, h, between a point charge and the centre of the sphere, which varies with a step of 0.2 Å in the distance range of 4.2 Å (dark blue) to 7 Å (green), thereafter h is taken to be 8, 9, 10, 15, 20, and 50 Å (deep red). Inset shows the surface charge density distribution at h = 50 Å. | ||
As shown in Fig. 2 the value of the differential surface density is zero for β = 0 and β = π as these angles correspond to a density at a point (points A and B in Fig. 1). The lobe of negative charge describes the charge density on the surface area close to the external positive charge, and the lobe of positive charge accounts for the density smeared towards β = π. It can be seen that the surface charge density is polarised more towards the external charge, and the effect is more pronounced for shorter separations, typically for h less than 7 Å. At h = 50 Å (inset in Fig. 2), the charge is separated in such a way that the negative charge occupies the entire hemisphere close to the external charge, whereas positive charge is located in the hemisphere defined by β ∈ (90°, 270°). Upon a further increase in the charge-sphere separation h, the induced polarisation charge approaches zero (no polarisation of the sphere). This charge polarisation behaviour is in close agreement with that described in ref. 5 for the interaction of neutral C60 with C602+.
The above classical electrostatic analysis of the surface charge density distribution on a dielectric sphere due to the presence of an external point charge can be validated with quantum chemical calculations of partial atomic charges in C60 and C240 fullerenes as described in the next section.
III. Quantum chemical description of the charge density in C60 and C240 fullerenes
In this section the classical electrostatic model is compared with results obtained at the B3LYP25,26/6-311G*27 DFT level of theory, as implemented in the Q-Chem quantum chemistry package,28 for the distribution of charge in the C60 and C240 molecules in the presence of an external point charge. Partial atomic charges on the carbon atoms in C60 and C240 fullerenes have been calculated using the Mulliken population analysis29 and subsequently compared with the surface charge density predicted by eqn (8).Fig. 3 depicts the distribution of partial atomic charges on a neutral C60 molecule, as predicted by the Mulliken population analysis, at three separation distances between the point charge and the centre of C60. Mulliken analysis29 is the oldest and simplest population analysis method, and it is widely accepted that the absolute magnitude of the atomic charges is not accurate as their values display a high degree of sensitivity to the atomic basis set with which they were calculated.30 However, the location of charge within the molecule is predicted reliably provided a consistent basis set is used. Three values of the point charge-C60 separation distance have been considered, namely h = 5 Å (Fig. 3a), h = 10 Å (Fig. 3b) and h = 50 Å (Fig. 3c), showing an increasing de-localization of negative charge on fullerene, depicted in green in Fig. 3, as the point charge, located to the right of the fullerene cage (not shown in Fig. 3) moves away from the molecule. It can be clearly seen that at h = 50 Å the negative charge spreads over the entire hemisphere and the charge density on the neutral C60 remains polarized, which is consistent with the classical electrostatic analysis presented in the inset of Fig. 2. The point charge with the value of q = +15e continues to exert a strong influence on the neutral fullerene cage even at distances greater than 50 Å.
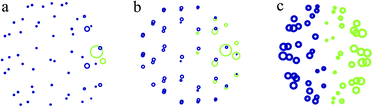 | ||
| Fig. 3 Distribution of partial atomic charges on the C60 molecule at three values of separation distance between the centre of C60 and the external point charge of q = +15e located to the right of the fullerene cage (not shown): (a) 5 Å, (b) 10 Å, and (c) 50 Å. Blue circles show positive charge residing on carbon atoms, and green circles depict negative charge. The size of each circle has been renormalized to convey the degree of polarization rather than its magnitude. | ||
For a comparison with the continuous charge density distribution derived from the classical electrostatic model (Fig. 2) a Gaussian distribution function has been used to represent the computed net atomic charges, which has an effect of smearing the charge density across the surface of the molecule. Eighteen slices of the surface of C60 with the same width (defined by a fixed incremental angle Δβ = 10°) have been considered. For each slice a normal distribution function is used to smear the charge determined by the Mulliken population analysis. The index n is used to define the number of slices over which each Gaussian function extends. In Fig. 4, the partial charge is distributed only within each slice (n = 2), thus showing not only a clear polarization of the negative and positive charges for small values of angle β but also small peaks corresponding to residual positive charges on atoms further away from the external charge.
 | ||
| Fig. 4 C60 surface charge density, obtained from the Mulliken population analysis, in the presence of the external point charge of q = +15e. The colour labeling is used to represent the separation, h, between a point charge and the centre of C60, which varies with a step of 0.2 Å in the distance range of 5 Å (dark blue) to 7 Å (green), thereafter h is taken to be 8, 9, 10, 15, 20, and 50 Å (deep red); Δβ = 10° and n = 2. Inset shows the surface charge density distribution at h = 50 Å compared to the analytical solution shown in the inset of Fig. 2. | ||
For the larger neutral C240 molecule whose radius is taken to be 7.3 Å, the distribution of partial atomic charges is presented in Fig. 5 for two separation distances of h = 9 Å (Fig. 5a) and h = 20 Å (Fig. 5b). The corresponding charge density distribution for the optimized geometry of C240 and Δβ = 10° is shown in Fig. 6 for n = 2. These results are qualitatively similar to the case of C60 presented in Fig. 3 and 4.
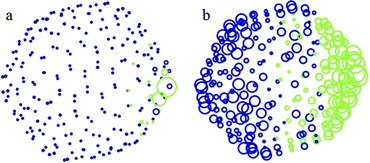 | ||
| Fig. 5 Distribution of partial atomic charges on the C240 molecule at two values of separation distance between the centre of C240 and the external point charge of q = +15e located to the right of the fullerene cage (not shown): (a) 9 Å and (b) 20 Å. Further details can be found in the caption to Fig. 3. | ||
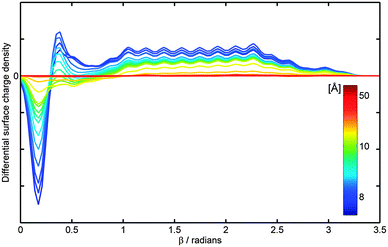 | ||
| Fig. 6 C240 surface charge density, obtained from the Mulliken population analysis, in the presence of the external point charge of q = +15e. The colour labeling is used to represent the separation, h, between a point charge and the centre of C240, which varies with a step of 0.2 Å in the distance range of 8 Å (dark blue) to 10 Å (green), thereafter h is taken to be 12, 20 and 50 Å (deep red); Δβ = 10° and n = 2. | ||
Conclusions
The recently developed classical model4 to describe electrostatic interactions between charged spheres of a dielectric material requires the material to be susceptible to polarisation in the presence of an external electric field. In order to test this assumption, the model has been adapted to the particular problem of a dielectric sphere interacting with a point charge. For this problem an expression is given for the displacement of bound charge density on the sphere as a function of separation between a point charge and the centre of a sphere. Comparisons have been made between the classical electrostatic results and those derived from a DFT study of the bound surface charge density on the dielectric molecular spheres C60 and C240. By smearing the calculated partial atomic charges it is shown that there are marked similarities between these two approaches. This suggests that the classical electrostatic picture used to describe the behaviour of dielectric materials in the presence of an electric field is appropriate for the treatment of small particles. Furthermore, the proposed model might have implications in experiments involving the fullerene – multiple-charged ion collisions.31,32 In experiments concerned with charge-transfer processes the insight into polarization of fullerenes is the first step in the understanding of their fission mechanism.Acknowledgements
We thank Prof. P. Moriarty for fruitful discussions on conducting properties of individual fullerene cages. GR acknowledges the CONACYT Mexico Scholarship for PhD funding (Reg. 215343). EB acknowledges financial support through an ERC Starting Grant, an EPSRC Career Acceleration Fellowship, and a New Directions for EPSRC Research Leaders Award (EP/G005060).References
- A. Jaworek, W. Balachandran, A. Krupa, J. Kulon and M. Lackowski, Environ. Sci. Technol., 2006, 40, 6197 CrossRef.
- X. Meng, J. J. Zhu and H. Zhang, J. Phys. D: Appl. Phys., 2009, 42, 065201 CrossRef.
- A. Hickey, H. Mansour and M. Telko, J. Pharm. Sci., 2007, 96, 1302 CrossRef CAS PubMed.
- E. Bichoutskaia, A. L. Boatwright, A. Khachatourian and A. J. Stace, J. Chem. Phys., 2010, 133, 024105 CrossRef PubMed.
- A. J. Stace, A. L. Boatwright, A. Khachatourian and E. Bichoutskaia, J. Colloid Interface Sci., 2011, 354, 417 CrossRef CAS PubMed.
- J. D. Jackson, Classical Electrodynamics, Wiley, New York, 1999 Search PubMed.
- W. Thomson (Lord Kelvin), J. Math. Pure. Appl., 1845, 10, 364 Search PubMed.
- A. J. Stace and E. Bichoutskaia, Phys. Chem. Chem. Phys., 2011, 13, 18339 RSC.
- H. Zettergren, O. B. Forsberg and H. Cederquist, Phys. Chem. Chem. Phys., 2012, 14, 16360 RSC.
- A. J. Stace and E. Bichoutskaia, Phys. Chem. Chem. Phys., 2012, 14, 16771 RSC.
- P. J. Benning, J. L. Martins, J. H. Weaver, L. P. F. Chibante and R. E. Smalley, Science, 1991, 252, 1417 CAS.
- J. L. Wragg, J. E. Chamberlain, H. W. White, W. Kratschmer and D. R. Huffman, Nature, 1990, 348, 623 CrossRef CAS.
- S. Doniach and M. Sunjic, J. Phys. C: Solid State Phys., 1970, 3, 285 CrossRef CAS.
- J. A. Leiro, M. H. Heinonen, T. Laiho and I. G. Batirev, J. Electron Spectrosc. Relat. Phenom., 2003, 128, 205 CrossRef CAS.
- E. Rotenberg, C. Enkvist, P. A. Brühwiler, A. J. Maxwell and N. Mårtensson, Phys. Rev. B: Condens. Matter, 1996, 54, R5279 CrossRef CAS.
- R. Messina, J. Chem. Phys., 2002, 117, 11062 CrossRef CAS.
- H. Zettergren, J. Jensen, H. T. Schmidt and H. Cederquist, Eur. Phys. J. D, 2004, 29, 63 CrossRef CAS.
- M. Nakamuraand and P. Hervieux, Chem. Phys. Lett., 2006, 428, 138 CrossRef PubMed.
- H. Ohshima, J. Colloid Interface Sci., 1995, 170, 432 CrossRef CAS.
- X. Chu and D. T. Wasan, J. Colloid Interface Sci., 1996, 184, 268 CrossRef CAS.
- G. Iversen, Y. I. Kharkats and J. Ulstrup, Mol. Phys., 1998, 94, 297 CAS.
- T. P. Doerr and Y. K. Yu, Phys. Rev. E: Stat., Nonlinear, Soft Matter Phys., 2006, 73, 061902 CrossRef CAS.
- Z. J. Lian and H. R. Ma, J. Chem. Phys., 2007, 127, 104507 CrossRef CAS PubMed.
- H. Ohshima, J. Colloid Interface Sci., 2008, 328, 3 CrossRef CAS PubMed.
- A. D. Becke, J. Chem. Phys., 1993, 98, 5648 CrossRef CAS.
- C. Lee, W. Yang and R. G. Parr, Phys. Rev. B: Condens. Matter Mater. Phys., 1988, 37, 785 CrossRef CAS.
- R. Krishnan, J. S. Binkley, R. Seeger and J. A. Pople, J. Chem. Phys., 1980, 72, 650 CrossRef CAS.
- Y. Shao, L. F. Molnar, Y. Jung, J. Kussmann, C. Ochsenfeld, S. T. Brown, A. T. B. Gilbert, L. V. Slipchenko, S. V. Levchenko, D. P. O'Neill, R. A. Di Stasio Jr, R. C. Lochan, T. Wang, G. J. O. Beran, N. A. Besley, J. M. Herbert, C. Y. Lin, T. V. Voorhis, S.-H. Chien, A. Sodt, R. P. Steele, V. A. Rassolov, P. E. Maslen, P. P. Korambath, R. D. Adamson, B. Austin, J. Baker, E. F. C. Byrd, H. Dachsel, R. J. Doerksen, A. Dreuw, B. D. Dunietz, A. D. Dutoi, T. R. Furlani, S. R. Gwaltney, A. Heyden, S. Hirata, C.-P. Hsu, G. Kedziora, R. Z. Khalliulin, P. Klunzinger, A. M. Lee, M. S. Lee, W. Liang, I. Lotan, N. Nair, B. Peters, E. I. Proynov, P. A. Pieniazek, Y. M. Rhee, J. Ritchie, E. Rosta, C. D. Sherrill, A. C. Simmonett, J. E. Subotnik, H. L. Woodcock III, W. Zhang, A. T. Bell, A. K. Chakraborty, D. M. Chipman, F. J. Keil, A. Warshel, W. J. Hehre, H. F. Schaefer III, J. Kong, A. I. Krylov, P. M. W. Gill and M. Head-Gordon, Phys. Chem. Chem. Phys., 2006, 8, 3172 RSC.
- R. S. Mulliken, J. Chem. Phys., 1955, 23, 1833 CrossRef CAS.
- E. R. Davidson and S. Chakravorty, Theor. Chim. Acta, 1992, 83, 319 CrossRef CAS.
- N. Haag, Z. Berényi, P. Reinhed, D. Fischer, M. Gudmundsson, H. A. B. Johansson, H. T. Schmidt and H. Cederquist, Phys. Rev. A: At., Mol., Opt. Phys., 2008, 78, 043201 CrossRef.
- J. Jensen, H. Zettergren, H. T. Schmidt, H. Cederquist, S. Tomita, S. B. Nielsen, J. Rangama, P. Hvelplund, B. Manil and B. A. Huber, Phys. Rev. A: At., Mol., Opt. Phys., 2004, 69, 053203 CrossRef.
| This journal is © the Owner Societies 2013 |