 Open Access Article
Creative Commons Attribution 3.0 Unported Licence
Determining the unique refractive index properties of solid polystyrene aerosol using broadband Mie scattering from optically trapped beads
Stephanie H.
Jones
ab,
Martin D.
King
a and
Andrew D.
Ward
*b
aSTFC, Central Laser Facility, Research Complex at Harwell, Rutherford Appleton Laboratory, Harwell Oxford, Didcot, Oxfordshire, OX11 0FA, U.K.. E-mail: andy.ward@stfc.ac.uk; stephanie.jones@stfc.ac.uk
bDepartment of Earth Sciences, Royal Holloway University of London, Egham, Surrey, TW20 0EX, U.K.. E-mail: m.king@es.rhul.ac.uk
First published on 28th October 2013
Abstract
A method is described to measure the refractive index dispersion with wavelength of optically trapped solid particles in air. Knowledge of the refraction properties of solid particles is critical for the study of aerosol; both in the laboratory and in the atmosphere for climate studies. Single micron-sized polystyrene beads were optically trapped in air using a vertically aligned counter-propagating configuration of focussed laser beams. Each bead was illuminated using white light from a broadband light emitting diode (LED) and elastic scattering within the bead was collected onto a spectrograph. The resulting Mie spectra were analysed to accurately determine polystyrene bead radii to ±0.4 nm and values of the refractive index to ±0.0005 over a wavelength range of 480–700 nm. We demonstrate that optical trapping combined with elastic scattering can be used to both accurately size polystyrene beads suspended in air and determine their wavelength dependent refractive index. The refractive index dispersions are in close agreement with reported values for polystyrene beads in aqueous dispersion. Our results also demonstrate a variation in the refractive index of polystyrene, from bead to bead, in a commercial sample. The measured variation highlights that care must be taken when using polystyrene beads as a calibration aerosol.
1 Introduction
Atmospheric aerosol is known to impact on many areas of life, such as air pollution, human health, and modern climate change.1,2 The climate of the Earth is directly affected by aerosols scattering and absorbing solar radiation and indirectly affected by aerosols acting as cloud condensation nuclei. There is a significant amount of uncertainty regarding aerosol contribution to both effects and characterisation of the physical properties of atmospheric aerosol such as radius and refractive index are necessary to reduce the uncertainty.Polystyrene beads are often used as a test aerosol to calibrate instruments used to size aerosols with light scattering techniques.3 The refractive index of the beads controls, in part, the elastic scattering of light as a function of scattering angle and wavelength. Therefore, knowledge of the bead's refractive index as a function of wavelength is critical for the use of polystyrene beads as test aerosol. Refractive index varies with wavelength and the variation can be described by a Cauchy equation.4 The variation in refractive index with wavelength can also be referred to as a dispersion of the refractive index. The Cauchy equation is of the form;
 | (1) |
To date, a number of studies have focussed on the characterisation of the refractive index dispersion of polystyrene either as bulk material or as an aqueous suspension.5–8 For polystyrene bead suspensions, the dispersions of the refractive index with wavelength are broadly in agreement. Miles et al.,9 performed a cavity-ring-down study looking at polystyrene beads in air and reported a value of the real component of refractive index of 1.627 ± 0.027 at a single illumination wavelength of 560 nm. The reported value was larger, but within the uncertainty of the measurement, when compared to those obtained from studies of aqueous polystyrene bead suspensions.5–8
The study presented here demonstrates the technique of optical trapping of polystyrene beads in air combined with white-light scattering10–13 and the application of Mie theory,14–16 to determine the radius and wavelength-dependent values of refractive index. Details for application of Mie theory for spectral analysis are given in Ward et al.10 and in Moore et al.11 and references therein.
The refractive index dispersion with wavelength for polystyrene beads in air were investigated and compared to polystyrene beads in water. Beads were individually characterised to determine the variation in size and refractive index within the sample of polystyrene beads.
Bateman et al.5 used transmission photospectrometer measurements to determine the size and refractive index dispersion of a suspension of polystyrene beads in water as preliminary work towards the characterisation of biological hydrosols. Polystyrene microspheres were chosen for Ma et al.'s6 investigation as a proxy for turbid media used in the development of biomedical optics and the calibration of optical instrumentation. Ma et al.6 determined the complex and real values of the refractive indices as a function of wavelength using reflectance and transmission measurements of the suspensions of polystyrene beads in water using an integrating sphere. Other researcher's motivations for studying polystyrene were to provide optical reference data for bulk polystyrene7 and to contribute to bulk optical plastic data.8 The National Institute of Standards and Technology (NIST) have also used an integrating sphere to make absorption measurements to determine the refractive index dispersions of polystyrene suspensions.17 NIST selected polystyrene as a generic micro bead and their results indicated slightly different refractive index dispersions for different sized polystyrene beads, resulting in a difference of 0.001 in refractive index between beads of different radii. A further study18 of individual polystyrene beads has been undertaken in solution. Philips et al.18 nebulised a solution of polystyrene beads and used electric fields to control the resultant charged beads in order to isolate one bead. The bead was illuminated using a laser and the size and refractive index values of polystyrene fitted.
In the study presented here single polystyrene beads in air have been optically trapped using a vertically aligned counter-propagating configuration of focussed laser beams. The technique provides a contact free method of studying single aerosol particles and is an ideal way to model aerosols in the climate and their related atmospheric chemistry.19,20 Optical trapping is suitable for the analysis of laboratory generated aerosol but is, to our knowledge, untested against atmospheric aerosol sources. Complications may arise for particles that strongly absorb light at the laser trapping wavelength. Whilst different laser wavelengths can be used to address this problem there are materials such as black carbon and humic acids that may remain unsuited for use in optical trapping studies. Optical trapping of liquid aerosol droplets has been reported by a number of authors and is reviewed by McGloin.21 However, the trapping of microscopic solid spheres (<5 μm) is not as prevalent and was first reported by Summers et al.,22 using a single beam gradient trap. Summers et al. showed that stable trapping of the bead was achieved for a few seconds. Li et al.,23 have subsequently reported success in trapping such beads using a horizontally orientated counter-propagating trap with significant stability in trapping even under low pressure conditions. Flynn et al.24 and Lindballe et al.25 have trapped polystyrene beads in aqueous suspension using horizontal counter-propagating optical traps. Flynn et al.24 analysed the forward scattered laser light at different laser power ratios to determine the size and refractive index at low resolution.
Building on the initial work of Ward et al.10 and then Moore et al.11 this study demonstrates that light scattering from a white LED and application of Mie theory can be used to accurately size polystyrene beads suspended in air and determine the refractive index dispersion over a broadband wavelength range.
2 Experimental
2.1 Apparatus and aerosol generation
A vertically aligned counter-propagating optical trap was used to trap forty-six individual polystyrene beads. A diagram of the apparatus is shown in Fig. 1. The equipment consists of a 1.50 W, 1064 nm, continuous wave Nd:YAG laser (Laser Quantum) coupled to two fibre-optic cables using a beamsplitter coupling port (Oz Optics). The laser beam was fibre-delivered to two opposed objective lenses (Mitutoyo M Plan Apo 50×, NA = 0.42) using simple beam expansion optics to match the beam diameter to the back aperture of the objective lens.26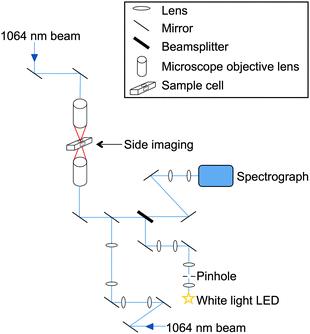 | ||
| Fig. 1 Schematic diagram of the experimental apparatus. Two laser beams (1064 nm) from a twin-coupled fibre output are focussed through opposing objective lenses to form an optical trap in an aluminium cell. White light from an LED of wavelength range 480–700 nm is focussed on to the trapped bead and backscattered light collected onto a spectrograph. | ||
The focussed beams were aligned in x, y and z dimensions using differential micrometer control on the top objective to create a counter-propagating optical trap. Vertical focal separation between the two beams was set at 10 μm. The laser power of the upwards pointing beam was 10 mW and the downwards beam 15 mW at the point of focus. These laser powers permitted stable optical trapping combined with an in-focus brightfield image of the trapped bead. The larger radiation pressure from the downwards beam was used to force the bead into the image plane of the lower objective lens.23 A brightfield side image of the bead, orthogonal to the previous image of the trapped bead, was also obtained to assist bead trapping. An aluminium cell is used for bead trapping and was placed between the two objective lenses. The windows in the top and bottom faces of the cell were coverslips which allowed the laser beams to focus into the cell with minimal aberration. The cell also contained inlet and outlet ports orthogonal to the laser beam paths to allow delivery and exhaust of aerosols.
An atomiser (Topas, ATM 220) with a diffusion dryer (Topas, DDU 570/L) was used to deliver dry polystyrene beads, of approximately 1.25 μm radius, into the trapping cell. The beads were obtained from Bangs Laboratories (PS05N, Batch 5893) and are specified at 1.25 μm radius with 0.08 μm standard deviation. Transmission Electron Microscopy analysis was also performed on the polystyrene bead sample using a JEOL JEM-2100/HT electron microscope in low-magnification mode. The average particle radius was determined as 1.216 μm with a standard deviation of 0.015 μm. A number of beads were delivered into the cell and the cell position was adjusted relative to the laser beams until a single bead was trapped. The remaining beads were removed by collisions with the cell walls. All beads were from the same commercial sample and each bead was studied individually.
No control was made for humidity or temperature. Room humidity was typically 30% RH and room temperature was 21 °C and kept constant by air conditioning. To allow inspection of the beads after trapping they were placed on the lower coverslip by raising the sample cell relative to the trapping position. The inspection was to confirm that a solid polystyrene bead was trapped rather than dust, a small fragment of the silica gel from the diffusion dryer or an aqueous liquid droplet.
Light from a white LED (Comar 01 LD 555, 6 V) was focussed on the trapped bead as shown in Fig. 1. An iris was placed in the optical train in such a position that the edge of the iris was in focus in the microscope imaging plane. The area of the imaged iris was adjusted to be of a size slightly greater than that of the trapped bead. A portion of the white light was backscattered by the polystyrene bead and collected across a 25 degree cone angle by the objective lens before exiting along the same optics through the microscope towards a beamsplitter where it was focussed into a spectrograph (Acton SP2500i) via a series of mirrors (Semrock Max Mirror). The light was subsequently imaged on to a charge-coupled device (CCD) detector (Princeton Instrument Spec 10:400 BR). Spectra were collected by scanning from 480–700 nm using a 1200 groove mm−1 grating with a resolution of 0.028 nm. The spectrograph and CCD were calibrated for wavelength using the spectral lines of Ar and Xe gas lamps (reference lines from NIST database27).
2.2 Imaging
The optically trapped polystyrene bead was imaged using brightfield illumination such that the upper objective lens acted as a condenser. The bead was also imaged horizontally, through two coverslip windows in the cell, to provide both horizontal and vertical views of the bead respectively as shown in Fig. 2. Side-imaging aided optical trapping as the falling polystyrene beads were observed approaching the laser focus allowing the cell position to be adjusted accordingly. Illumination sources used for imaging were turned off during acquisition of elastically backscattered light.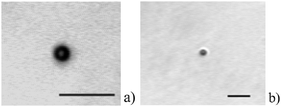 | ||
| Fig. 2 Brightfield images of a trapped polystyrene bead showing views from (a) the lower objective lens (Mitutoyo M Plan Apo 50×, NA 0.42) and (b) the side-imaging lens (Mitutoyo M Plan Apo 20×, NA 0.42). Optical filters placed in front of each camera have blocked the laser light from the image. Scale bar on each image represents 10 microns. | ||
2.3 Data fitting
The recorded spectrum of the intensity of elastically backscattered light with wavelength, henceforth the “Mie spectrum”, was compared to the predicted spectrum calculated from Mie theory using two processes. Initially four different sets of empirical constants (A, B and C) for the wavelength-dependent dispersion of refractive index from the literature were used to determine the radii of the trapped polystyrene beads using eqn (1). The second process of fitting used the determined radii as a starting value for iteration of both the empirical constants A, B and C and also the particle size to determine whether better fits could be determined, and enable bead-to-bead comparison.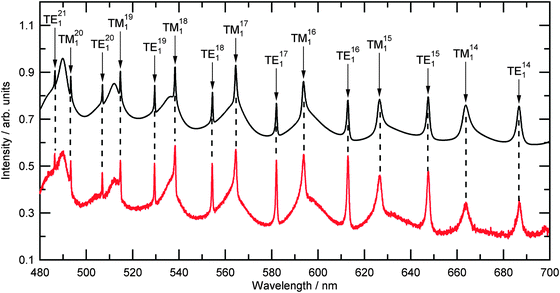 | ||
| Fig. 3 A typical recorded experimental Mie spectrum for an optically trapped polystyrene bead (Table 2, number 13) is shown in red. The background signal from the white LED has been divided through the collected signal but no other processing or modifications have been made. The calculated Mie spectra for a polystyrene bead of size 1.227 μm, and a dispersion of refractive index as detailed in Table 2 is shown in black and is offset by 0.5 arbitrary units. | ||
The initial calculation of Mie resonance wavelengths were performed using literature values5–8 to define the wavelength dispersion of the refractive index of polystyrene. The values of the coefficients A, B and C in these studies are valid over the experimental wavelength range of 480–700 nm. The imaginary part of the refractive index for polystyrene is typically small and constant in the visible region29 and in this work was fixed at 0.0003i. The refractive index of air was also assumed constant over this wavelength range at 1.00027.30 Calculated resonance wavelengths were altered by varying only the particle size in 0.1 nm increments and the resulting positions compared to experimental resonance wavelengths.11 The minimum value in the average difference per resonance, χr as defined in eqn (2), was used to determine the best fit for particle size.
 | (2) |
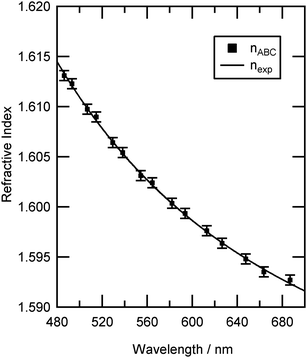 | ||
| Fig. 4 The determined values of refractive index for individual resonance positions of an optically trapped polystyrene bead in air (Table 2, number 13) are shown as points, nABC. The refractive index dispersion is shown as a solid line. The uncertainty in refractive index, ±0.0005, results from an uncertainty of ±0.4 nm in bead radius. | ||
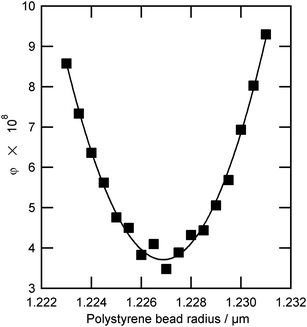 | ||
| Fig. 5 The value of the Levenberg–Marquardt residual, φ, as a function of bead radius for an optically trapped polystyrene bead (Table 2, number 13). The uncertainty in determination of optimum bead radius is ±0.4 nm. | ||
3 Results and discussion
3.1 Comparison with literature refractive index dispersions
Table 1 lists the summarised average and standard deviation of the optimum radii for the forty-six optically trapped beads using literature constants for the Cauchy equation to describe the variation of refractive index with wavelength. Also listed in Table 1 is the average value of, χr (eqn (2)), the figure of merit for comparing experimental and calculated resonance positions. Bateman et al.'s5 wavelength-dependent equation to describe refractive index gives the best quality of fit to the experimental data. However, with the exception of Ma et al.6 all fits are similar.| Literature source | Average radius/μm | χ r/nm |
|---|---|---|
| a Variations in radii are standard deviations. The uncertainty for the average radius using the equation from Ma et al. is not stated as the particle sizing process results in a poor fit as indicated by the large value of χr. | ||
| Bateman et al.5 | 1.227 ± 0.009 | 0.056 |
| Ma et al.6 | 1.299a | 2.089 |
| Matheson et al.7 | 1.231 ± 0.009 | 0.077 |
| Sultanova et al.8 | 1.232 ± 0.009 | 0.092 |
| This work | 1.227 ± 0.008 | 0.046 |
3.2 Iterative fitting results for individual polystyrene beads
The results for single polystyrene beads will now be considered. Fig. 3 compares a typical Mie spectrum from the experiment (bead number 13) with a calculated Mie spectrum and shows excellent agreement in resonance wavelength values. The difference in wavelength of the resonance positions for the spectra in Fig. 3 was an average of 0.049 nm which was less than 2 pixels on the detector. The calculated Mie spectrum in Fig. 3 was calculated for values of radius and A, B and C as detailed in Table 2.| Bead | Radius/μm | χ r/nm | A | B/nm2 | C/108 nm4 |
|---|---|---|---|---|---|
| 1 | 1.238 | 0.049 | 1.5716 | 8272 | 2.48 |
| 4 | 1.240 | 0.037 | 1.5700 | 8631 | 2.09 |
| 7 | 1.219 | 0.042 | 1.5702 | 8299 | 2.74 |
| 13 | 1.227 | 0.049 | 1.5736 | 8300 | 2.58 |
| 18 | 1.229 | 0.050 | 1.5723 | 8772 | 1.76 |
| 19 | 1.231 | 0.041 | 1.5747 | 7305 | 3.94 |
| 22 | 1.225 | 0.043 | 1.5712 | 8793 | 1.74 |
| 26 | 1.219 | 0.045 | 1.5720 | 8481 | 2.28 |
| 29 | 1.227 | 0.045 | 1.5725 | 8145 | 2.66 |
| 39 | 1.211 | 0.048 | 1.5698 | 9122 | 1.27 |
To obtain the radius of the polystyrene bead, a number of radii were fitted as described in Section 2.3.2. For bead 13, the value of the Levenberg–Marquardt residual, φ was plotted as a function of radius close to the optimum size value, as shown in Fig. 5, demonstrating a clear minimum that corresponds to a radius of 1.227 μm. As the bead radius was altered away from the optimum position the change in refractive index required to match the calculated Mie spectrum resonances to the experimental Mie spectrum resonances became more exaggerated and the residual value, φ, increased. The above procedure results in an uncertainty of ±0.4 nm in particle radius (determined from Fig. 5) which propagates to an uncertainty in refractive index of ±0.0005 as shown in Fig. 4.
3.3 Data fitting results for ten polystyrene beads
The values of the radius and empirical constants A, B and C for each of the ten beads are listed in Table 2. A range of values for both the radius and A, B and C were determined when the beads were fitted using an identical procedure (see 2.3.2). The difference in values of size and refractive index was greater than the error in these quantities and therefore significant. The individual values of refractive index for the beads are plotted as a function of wavelength in Fig. 6 to illustrate the differences between the ten beads. Thus, the size and more interestingly the composition of each test aerosol was different for each bead, clearly showing that individual polystyrene beads would not be a suitable choice for instrument calibration at high resolution.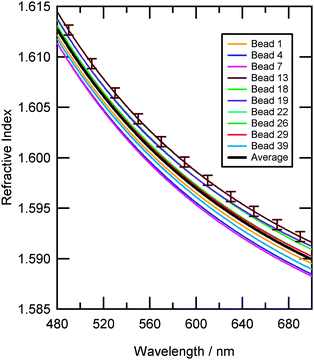 | ||
| Fig. 6 Refractive index dispersions for ten individual polystyrene beads taken from Table 2. Each bead has a unique radius and wavelength dependent refractive index. Indicative error bars show the variation of refractive index for each bead arising from the measurement and data fitting process. The average refractive index dispersion of the ten beads is shown as a black line. | ||
The average dispersion of the ten beads can be seen as the black line in Fig. 6, and was calculated by averaging the values of the coefficients A, B and C for the ten beads in Table 2 which resulted in eqn (3). The overall variation (two standard deviations) of the refractive indices for the sample of polystyrene beads was 0.0022, and is shown in Fig. 7. Eqn (3) agrees well with that of Bateman et al.5
 | (3) |
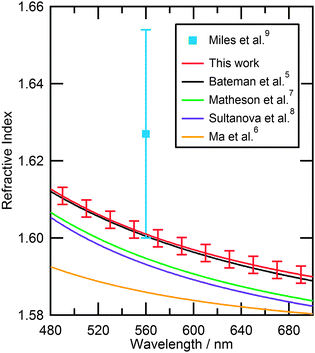 | ||
| Fig. 7 Comparison of the refractive index dispersions from literature with the refractive index dispersion obtained in this study over the wavelength range 480–700 nm. Error bars indicate the variation of refractive index dispersion for the polystyrene bead sample. | ||
The average values of A, B and C were used to re-fit particle size as defined in Section 2.3.1 to the set of forty-six beads and the results are shown in Tables 1 and 3. A smaller average value of χr was determined using these A, B and C values in comparison to those obtained from literature. Thus, for the sample of polystyrene beads used in this study, the description of the refractive index dispersion presented in eqn (3) was more accurate.
| Bead | Radius/nm | χ r/nm | Bead | Radius/nm | χ r/nm |
|---|---|---|---|---|---|
| 1 | 1.237 | 0.050 | 24 | 1.230 | 0.038 |
| 2 | 1.223 | 0.039 | 25 | 1.224 | 0.050 |
| 3 | 1.223 | 0.055 | 26 | 1.219 | 0.044 |
| 4 | 1.239 | 0.039 | 27 | 1.216 | 0.059 |
| 5 | 1.229 | 0.041 | 28 | 1.232 | 0.045 |
| 6 | 1.235 | 0.048 | 29 | 1.227 | 0.049 |
| 7 | 1.218 | 0.042 | 30 | 1.235 | 0.043 |
| 8 | 1.225 | 0.040 | 31 | 1.214 | 0.054 |
| 9 | 1.232 | 0.041 | 32 | 1.229 | 0.051 |
| 10 | 1.214 | 0.042 | 33 | 1.224 | 0.047 |
| 11 | 1.239 | 0.041 | 34 | 1.236 | 0.045 |
| 12 | 1.219 | 0.052 | 35 | 1.226 | 0.040 |
| 13 | 1.228 | 0.050 | 36 | 1.221 | 0.059 |
| 14 | 1.224 | 0.045 | 37 | 1.231 | 0.059 |
| 15 | 1.237 | 0.047 | 38 | 1.229 | 0.037 |
| 16 | 1.237 | 0.058 | 39 | 1.210 | 0.050 |
| 17 | 1.211 | 0.042 | 40 | 1.229 | 0.035 |
| 18 | 1.230 | 0.046 | 41 | 1.212 | 0.054 |
| 19 | 1.231 | 0.036 | 42 | 1.231 | 0.058 |
| 20 | 1.219 | 0.055 | 43 | 1.215 | 0.046 |
| 21 | 1.229 | 0.045 | 44 | 1.236 | 0.037 |
| 22 | 1.225 | 0.041 | 45 | 1.233 | 0.033 |
| 23 | 1.237 | 0.051 | 46 | 1.230 | 0.044 |
The average polystyrene bead radius measured from the Mie scattering analysis (1.227 ± 0.008 μm) is within error of that measured by electron microscopy (1.216 ± 0.015 μm) and has a similar deviation in particle size.
Fig. 7 is a comparison of different refractive index dispersions from literature to the average dispersion obtained in this study. The dispersion used to describe our study lies close to that of Bateman et al.5 indicating that our result agrees well with their study of polystyrene beads in aqueous suspension. Other studies6–8 have slightly lower values of refractive index for polystyrene, Matheson et al.7 and Sultanova et al.8 being closer to our value than Ma et al.6
The result that is the most relevant to our study is that of Miles et al.9 who determined the refractive index of different sized polystyrene beads. Whilst the values reported by Miles et al. and this work agree within error, the larger value of Miles et al. compared to all previous works5–8 cannot be repeated in our fitting process by including values of real refractive indices in the range 1.62–1.65.
The variation of refractive index dispersion for the different polystyrene beads shown in Fig. 6 could indicate small chemical or physical differences in the polymer material during synthesis of the bead. However, there were two assumptions made in the fitting of Mie resonance wavelengths that could also lead to artefacts when considering individual beads. The first assumption was that the polystyrene beads were all perfectly spherical. Mie scattering of droplets under small deformation is shown33,34 to result in resonances which shift, broaden and split as the droplet asymmetry increases. Careful inspection of the experimental Mie spectra for polystyrene beads showed no discernible splitting or broadening of the narrow first-order resonances. The second assumption was that the wavelength dependent refractive index was described accurately by a three-term Cauchy equation; however, there could be a function to the curve which was not taken into account that requires a wavelength-dependent refractive index equation of a different form i.e. with more terms.
Conclusions
Forty-six polystyrene beads were optically trapped in air using a counter-propagating trap. Analysis of backscattered light and application of Mie scattering theory resulted in a determination of radius and new empirical constants for the wavelength dispersion of refractive index for polystyrene beads in air. From an iterative fitting process the polystyrene bead radius was determined with an uncertainty of ±0.4 nm and refractive index dispersion with an uncertainty of ±0.0005. Each polystyrene bead from the same batch was found to have a different radius and refractive index dispersion over the 480–700 nm range. Therefore, the use of a monodisperse value of refractive index for polystyrene bead samples could be problematic when conducting high accuracy work.This study has demonstrated the successful use of a technique to determine wavelength dependent refractive indices and radii for forty-six polystyrene beads. Comparison to literature indicates that the values of refractive index for polystyrene beads in air and polystyrene beads in aqueous suspension, determined by Bateman et al.,5 are in close agreement. Our analysis demonstrated that the technique is very sensitive and is capable of characterising polydispersity in size and composition for polystyrene beads. Therefore, we recommend that the use of polystyrene beads to calibrate light scattering instruments, for aerosol size measurements, should be treated with caution with regards to the variation in particle size and refractive index within the calibration sample. The study has shown the use of optically trapped polystyrene beads as a solid test aerosol and future studies will investigate different types of solid aerosol.
Acknowledgements
SHJ wishes to thank NERC for funding of grant (NE/HC19I03/1). We thank Wilm Jones (Cardiff University) for assistance in obtaining TEM images. We are also grateful to STFC for support under grants 12130016 and 12230019 for access to the laboratories of the Central Laser Facility at the Research Complex at Harwell.Notes and references
- IPCC, Climate Change 2007: The Physical Science Basis. Contribution of Working Group I to the Fourth Assessment Report of the Intergovernmental Panel on Climate Change, Cambridge University Press, Cambridge, UK, 2007.
- U. Pöschl, Angew. Chem., Int. Ed., 2005, 44, 7520–7540 CrossRef PubMed.
- R. Friehmelt and S. Heidenreich, J. Aerosol Sci., 1999, 30, 1271–1279 CrossRef CAS.
- F. A. Jenkins, Fundamentals of optics, McGraw-Hill, 4th edn, 1976 Search PubMed.
- J. B. Bateman, E. J. Weneck and D. C. Eshler, J. Colloid Sci., 1959, 14, 308–329 CrossRef CAS.
- X. Ma, J. W. Lu, R. S. Brock, K. M. Jacobs, P. Yang and X.-H. Hu, Phys. Med. Biol., 2003, 48, 4165–4172 CrossRef.
- L. A. Matheson and J. L. Saunderson, Styrene: Its polymers and copolymers and derivatives in Optical and Electrical Properties of Polystyrene, American Chemical Society, 1952 Search PubMed.
- N. G. Sultanova, I. D. Nikolov and C. D. Ivanov, Opt. Quantum Electron., 2003, 35, 21–34 CrossRef CAS.
- R. E. H. Miles, S. Rudić, A. J. Orr-Ewing and J. P. Reid, J. Phys. Chem. A, 2010, 114, 7077–7084 CrossRef CAS PubMed.
- A. D. Ward, M. Zhang and O. Hunt, Opt. Express, 2008, 16, 16390–16403 CrossRef CAS.
- L. J. Moore, M. D. Summers and G. A. D. Ritchie, Phys. Chem. Chem. Phys., 2013, 15, 13489–13498 RSC.
- Y. Liu, X. Li, Y. L. Kim and V. Backman, Opt. Lett., 2005, 30, 2445 CrossRef.
- A. A. Zardini, U. K. Krieger and C. Marcolli, Opt. Express, 2006, 14, 6951 CrossRef CAS.
- C. F. Bohren and D. R. Huffman, Absorption and Scattering of Light by Small Beads, Wiley Scientific, 1998 Search PubMed.
- P. Chylek, V. Ramaswamy, A. Ashkin and J. M. Dziedzic, Appl. Opt., 1983, 22, 2302–2307 CrossRef CAS.
- J. D. Eversole, H.-B. Lin, A. L. Huston, A. J. Campillo, P. T. Leung, S. Y. Liu and K. Young, J. Opt. Soc. Am. B, 1993, 10, 1955 CrossRef CAS.
- A. K. Gaiglas, L. Wang, V. Karpiak, Y.-Z. Zhang and S. Choquette, J. Res. NIST, 2012, 117, 202–215 CrossRef.
- D. T. Philips, P. J. Wyatt and R. M. Berkman, J. Colloid Interface Sci., 1970, 34, 159–162 CrossRef.
- M. D. King, K. C. Thompson, A. D. Ward, C. Pfrang and B. R. Hughes, Faraday Discuss., 2008, 137, 173 RSC.
- O. R. Hunt, A. D. Ward and M. D. King, RSC Adv., 2013, 3, 19448–19454 RSC.
- D. McGloin, Philos. Trans. R. Soc., A, 2006, 364, 3521–3537 CrossRef CAS PubMed.
- M. D. Summers, D. R. Burnham and D. McGloin, Opt. Express, 2008, 16, 11 CrossRef.
- T. Li, S. Kheifets, D. Medellin and M. G. Raizen, Science, 2010, 328, 1673–1675 CrossRef CAS PubMed.
- R. A. Flynn, B. Shao, M. Chachisvilis, M. Ozkan and S. C. Esener, Biosens. Bioelectron., 2006, 21, 1029–1036 CrossRef CAS PubMed.
- T. B. Lindballe, M. V. Kristensen, A. P. Kylling, D. Z. Palima, J. Gluckstad, S. R. Keiding and H. Stapelfeldt, J. Eur. Opt. Soc.-Rapid, 2011, 6, 11057 CrossRef.
- E. Fallman and O. Axner, Appl. Opt., 1997, 36, 2107–2113 CrossRef CAS.
- NIST Atomic Spectra Database Lines Data, Ar I and Xe I, http://physics.nist.gov/cgi-bin/ASD/lines1.pl accessed on 03.04.2012.
- C. Mätzler, IAP Res. Rep., 2002.
- Duke Scientific Corporation, Technical Note 007B, December 1, 1996.
- R. J. Mathar, J. Opt. A: Pure Appl. Opt., 2007, 9, 470 CrossRef CAS.
- W. H. Press, S. A. Teukolsky, W. T. Vetterling and B. P. Flannery, Numerical recipes – the art of scientific computing, Cambridge University Press, 2007 Search PubMed.
- J. L. Huckaby, A. K. Ray and B. Das, Appl. Opt., 1994, 33, 7112 CrossRef CAS PubMed.
- S. Arnold, D. E. Spock and L. M. Folan, Opt. Lett., 1990, 15, 1111 CrossRef CAS.
- G. Schweiger, Opt. Lett., 1990, 15, 156 CrossRef CAS.
| This journal is © the Owner Societies 2013 |
