 Open Access Article
Creative Commons Attribution 3.0 Unported Licence
The influence of pore size and surface area of activated carbons on the performance of ionic liquid based supercapacitors†
Sebastian Pohlmanna, Belén Lobatob, Teresa A. Centeno*b and Andrea Balducci*a
aWestfälische Wilhelms-Universität, Institut für Physikalische Chemie-MEET, Corrensstr. 28/30, 48149 Münster, Germany. E-mail: andrea.balducci@uni-muenster.de; Fax: +39 251 8336084; Tel: +39 251 8336083
bInstituto Nacional del Carbón (CSIC), Apartado 73, 33080 Oviedo, Spain. E-mail: teresa@incar.csic.es; Fax: +34 985 297662; Tel: +34 985 119 090
First published on 21st August 2013
Abstract
This study analyses and compares the behaviour of 5 commercial porous carbons in the ionic liquid N-butyl-N-methylpyrrolidinium bis(trifluoromethanesulfonyl)imide (PYR14TFSI) and its mixture with propylene carbonate (PC) as electrolytes. The results of this investigation show that the existence of a distribution of pore sizes and/or constrictions at the entrance of the pores leads to significant changes in the specific capacitance of the investigated materials. The use of PYR14TFSI as an electrolyte has a positive effect on the EDLC energy storage, but its high viscosity limits the power density. The mixture 50![[thin space (1/6-em)]](https://www.rsc.org/images/entities/char_2009.gif) :
:![[thin space (1/6-em)]](https://www.rsc.org/images/entities/char_2009.gif) 50 wt% propylene carbonate–PYR14TFSI provides high operative voltage as well as low viscosity and thus notably enhances EDLC operation.
50 wt% propylene carbonate–PYR14TFSI provides high operative voltage as well as low viscosity and thus notably enhances EDLC operation.
1. Introduction
Electrochemical double layer capacitors (EDLCs), also named supercapacitors, are currently considered to be some of the most promising electrochemical storage devices.1,2 In EDLCs the charge is stored at the interface between the electrode, typically including activated carbon (AC) as active material, and the electrolyte, which usually contains quaternary ammonium salts dissolved in propylene carbonate (PC) or acetonitrile (ACN).3,4 Currently available EDLCs can be charged and discharged within seconds, display high power (up to 10 kW kg−1) and extremely high cycle life (>500![[thin space (1/6-em)]](https://www.rsc.org/images/entities/char_2009.gif) 000).5 The energy storage capability of these systems, in the order of 5 Wh kg−1, meets the needs of present applications.6 Nevertheless, it is not sufficient for new uses proposed for EDLCs. Consequently, in the last few years tremendous efforts have been made in order to increase the energy of these devices.
000).5 The energy storage capability of these systems, in the order of 5 Wh kg−1, meets the needs of present applications.6 Nevertheless, it is not sufficient for new uses proposed for EDLCs. Consequently, in the last few years tremendous efforts have been made in order to increase the energy of these devices.The energy (E) of an EDLC is described by the equation E = 1/2CV2, where C and V are the capacitance and operation voltage, respectively. Taking this equation into account, it is evident that the increase in V represents the most convenient strategy to increase the energy of these devices. Several studies have shown that operative voltages above 3 V prevent high cycle life when standard electrolytes containing propylene carbonate or acetonitrile are used in combination with AC-based electrodes.7,8 In this context, new types of electrolytes have been proposed for high voltage EDLCs in the last few years.
Ionic liquids (ILs) are presently considered to be the most attractive alternative electrolytes, as recent studies have shown that their use enables the realization of safe EDLCs with operative voltages as high as 3.5 V.9 IL-based electrolytes can be divided into two main categories: (i) the so-called solvent-free electrolytes made of solely ILs9–11 and (ii) solvent-containing electrolytes in which ILs are dissolved in organic solvents, e.g. PC or ACN and act as conducting salts.12,13 Both types have different physico-chemical properties which result in advantages and disadvantages for their application as electrolytes. Solvent-containing ILs typically display higher conductivity than the solvent-free ones. On the other hand, due to the lack of any flammable solvent, the latter are a safer choice than the former.14 Additionally, both categories often display higher viscosity and different dielectric constants compared to conventional organic electrolytes.
As the energy storage in EDLCs is based on electrostatic interactions at the electrode–electrolyte interface, the characteristics of both components strongly affect this interface.15,16 The current ACs for supercapacitors present a porosity tailored for utilization primarily either in aqueous or organic solvents but their capacitance in IL might be significantly reduced due to the larger size of ions.17
This paper examines the performance of five commercial activated carbons with average micropore widths between 1.04 and 1.45 nm, using a solvent-free IL (N-butyl-N-methyl-pyrrolidinium bis(trifluoromethanesulfonyl)imide, PYR14TFSI) and a solvent containing IL (PC-PYR14TFSI (50![[thin space (1/6-em)]](https://www.rsc.org/images/entities/char_2009.gif) :
:![[thin space (1/6-em)]](https://www.rsc.org/images/entities/char_2009.gif) 50 wt%)) as electrolytes. For convenience, this mixture will be referred to as PC-PYR14TFSI. In order to better understand the effect of the electrolytes' properties on the performance of EDLCs, conventional 1 M (C2H5)4NBF4 in PC (1 M Et4NBF4 in PC) has also been included for comparison.
50 wt%)) as electrolytes. For convenience, this mixture will be referred to as PC-PYR14TFSI. In order to better understand the effect of the electrolytes' properties on the performance of EDLCs, conventional 1 M (C2H5)4NBF4 in PC (1 M Et4NBF4 in PC) has also been included for comparison.
This study illustrates the importance of a reliable structural characterization of porous carbons used as active electrode materials in EDLCs and, in particular, the determination of the surface area available to the electrolytes. Moreover, it also shows that the selection of the electrolyte is a key factor in the optimization of the electrochemical performance of the carbon electrode. The application of the ionic liquid PYR14TFSI as an electrolyte has a positive effect on the EDLCs energy storage due to its high maximum operative voltage of 3.7 V. This enhancement is countered by the high viscosity of pure PYR14TFSI, resulting in a limited power density. The use of the mixture 50![[thin space (1/6-em)]](https://www.rsc.org/images/entities/char_2009.gif) :
:![[thin space (1/6-em)]](https://www.rsc.org/images/entities/char_2009.gif) 50 wt% propylene carbonate–PYR14TFSI notably enhances the EDLC operation due to its maximum operative voltage of 3.5 V and nevertheless a low viscosity compared to PYR14TFSI.
50 wt% propylene carbonate–PYR14TFSI notably enhances the EDLC operation due to its maximum operative voltage of 3.5 V and nevertheless a low viscosity compared to PYR14TFSI.
2. Experimental section
2.1. Ionic liquids
The ionic liquid N-butyl-N-methylpyrrolidinium bis(trifluoromethanesulfonyl)imide (PYR14TFSI) was synthesized according to the procedure reported in ref. 18. Propylene carbonate, PC, was used as received (UBE, Japan). The conducting salts tetraethylammonium tetrafluoroborate (Et4NBF4) and PYR14TFSI were dried under vacuum and stored in a drybox. Using these salts and solvents, two electrolytes were prepared: 1 M Et4NBF4 in propylene carbonate and a mixture 50![[thin space (1/6-em)]](https://www.rsc.org/images/entities/char_2009.gif) :
:![[thin space (1/6-em)]](https://www.rsc.org/images/entities/char_2009.gif) 50 wt% of propylene carbonate and PYR14TFSI (PC-PYR14TFSI). All electrolytes displayed water contents lower than 30 ppm, as measured using the Karl Fischer technique.
50 wt% of propylene carbonate and PYR14TFSI (PC-PYR14TFSI). All electrolytes displayed water contents lower than 30 ppm, as measured using the Karl Fischer technique.Table 1 summarizes the viscosity and the conductivity of the electrolytes at 25 °C (ref. 19) as well as the size of the corresponding ions.10,20
2.2. Carbons
Five commercial activated carbons, M30 (Osaka Gas Co.), SC10 (Arkema-Ceca), CWH30 (Gryfskand) and E-Supra and DLC Super 30 (Norit), were used as active materials in the composite electrodes. Their porous characteristics were determined using complementary techniques such as N2 adsorption at −195 °C (Micromeritics ASAP 2010) and immersion calorimetry (Clavet-type calorimeter) at 20 °C.15,16 The characterization of the carbons was based on the analysis of the adsorption isotherm by the Dubinin–Radushkevich equation, the comparison-plot method, the NLDFT approach and the BET equation as well as by immersion calorimetry into 0.4 M solution of phenol in water.15,21 The micropore accessibility, on the other hand, was assessed by the enthalpies of immersion (ΔiH) into liquids having different critical molecular sizes ranging from 0.33 nm to 1.50 nm.15,16 The total oxygen content of the carbon surface [O] was estimated from the enthalpy of immersion of carbon into benzene (−ΔiH[C6H6]) and into water (−ΔiH[H2O]).22Scanning electron microscopy (SEM) micrographs were taken by using an accelerating voltage of 3 kV, a working distance of 3.5 mm and a magnification ranging from 5000× to 50![[thin space (1/6-em)]](https://www.rsc.org/images/entities/char_2009.gif) 000× (Auriga scanning electron microscope (Carl Zeiss)).
000× (Auriga scanning electron microscope (Carl Zeiss)).
2.3. Electrochemical tests
The electrodes used for the electrochemical tests were composed of 85 wt% active material (AC), 10 wt% conductive agent (Super C65, Timcal) and 5 wt% binder (sodium carboxymethyl-cellulose, Walocel CMC 2000, Dow Chemicals).19 An aluminum current collector was used in all tests. The average active material mass loading was about 2.5 mg and the electrode area was 1.13 cm2. As separator, a Whatman GF/D glass microfiber filter (thickness: 675 μm) with a diameter of 13 mm was used in all experiments. The separator was drenched with 100 μL of the considered electrolyte.All electrochemical tests were carried out at 20 °C with Swagelok®-type cells using a VMP multichannel potentiostatic–galvanostatic system (Biologic Science Instruments, France) connected to a climatic chamber. The capacitance of the AC electrode was determined using a three-electrode configuration cell. In this configuration the AC-based working electrode was used against a counter electrode (AC-based) with an active mass loading at least 15 times higher than that of the working electrode. An Ag wire quasi-reference electrode was used as a reference electrode. EDLCs were assembled using two identical electrodes. Cyclic voltammetry was carried out at scan rates between 5 and 200 mV s−1. Galvanostatic charge–discharge tests were performed applying current densities ranging from 5 to 50 mA cm−2. All electrochemical measurements were carried out at 20 °C. The electrochemical tests allowed estimating the values of capacitance referred to the active material in the electrode (Cam), equivalent series resistance (ESR), coulombic efficiency (η), average power (Paverage) and energy (Eaverage).10 The equations used to calculate Paverage, Eaverage and Cam are shown below.
where i is the current in ampere (A), E is the cell voltage in volt (V), td is the discharge time in seconds (s), mam is the active material's weight of both electrodes in gram (g) and dE/dt is the slope of the discharge curve in millivolts per second (mV s−1).
3. Results and discussion
The viscosity and the conductivity of the three investigated electrolytes are compared in Table 1. PYR14TFSI presents the highest viscosity and the lowest ionic conductivity, whereas the solvent-containing mixture PC-PYR14TFSI and the standard electrolyte 1 M Et4NBF4 in PC display rather similar values. Regarding the ion size, the cation and the anion of the conventional electrolyte are much smaller (35% and 30% for the cation and the anion, respectively) than those of the two PYR14TFSI-containing electrolytes.SEM images (Fig. 1) show that the carbon M30, produced from mesophase microbeads, is composed of spheres of around 50 μm in diameter. The other ACs derive from lignocellulosic precursors and display a large variety of irregular particles.
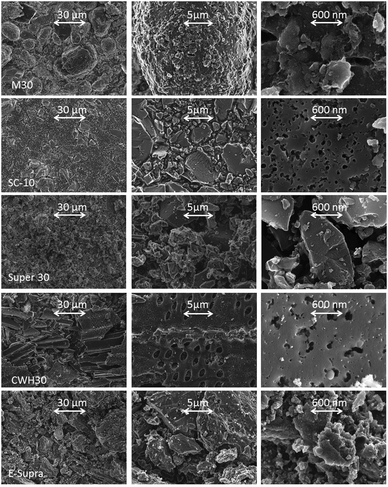 | ||
| Fig. 1 SEM pictures of the activated carbons. | ||
An overview of the main porous properties of the activated carbons is provided by the results of the adsorption and immersion experiments summarised in Table 2 (see also Table S1, ESI†).
| Carbon | [O] (μmol m−2) | Determined from N2 adsorption | |||||
|---|---|---|---|---|---|---|---|
| Wo (nm) | Lo (nm) | Smi (m2 g−1) | Se (m2 g−1) | TSA (m2 g−1) | SBET (m2 g−1) | ||
| CWH-30 | 0.80 | 0.38 | 1.04 | 731 | 23 | 724 | 940 |
| E-Supra | 0.66 | 0.37 | 1.13 | 655 | 36 | 685 | 845 |
| Super-30 | 0.56 | 0.60 | 1.24 | 968 | 9 | 971 | 1618 |
| SC-10 | 0.43 | 0.65 | 1.31 | 992 | 21 | 1020 | 1728 |
| M30 | 1.11 | 0.79 | 1.45 | 1090 | 10 | 1167 | 2398 |
The analysis of the N2 adsorption isotherm by the Dubinin–Radushkevich equation shows that the porosity of the carbons consists mainly of micropores (width <2 nm) with a limited proportion of larger pores. The average micropore size Lo ranges from 1.04 to 1.45 nm and the microporous surface area Smi is between 655 and 1090 m2 g−1. The comparison plot based on the reference N2 adsorption for a non-porous carbon leads to external (non-microporous) surfaces Se that account for less than 40 m2 g−1.
The specific surface area of carbons evaluated by Kaneko's comparison method (Scomp), the NLDFT approach (SDFT) and by immersion calorimetry into 0.4 M aqueous solution of phenol (Sphenol) are in good agreement with the predictions of the D–R equation SDR = Smi + Se (Table S1, ESI†). On the other hand, the area estimated by BET equation, SBET, strongly diverges from the other determinations. As already reported,22SBET is representative only for carbons with pore widths around 0.9 nm and overrates the surface area of the materials with a high contribution of micropores above 1 nm. Therefore, a reliable assessment of the total surface areas has been obtained by using the average value TSA = (SDR + Scomp + SDFT + Sphenol)/4, rather than to rely on a single determination.
As reported in Table 2, the total surface area is around 700 m2 g−1 for CWH-30 and E-Supra, whereas Super-30 and SC-10 achieve, approximately, 1000 m2 g−1. In the case of the superactivated carbon M30, the specific surface area is increased up to 1167 m2 g−1. The data also report that the TSA of the carbons with average pore sizes of 1.04 nm (CWH-30) and 1.13 nm (E-Supra) are no longer perceptible for the electrolytes and the surface area accessible to the ions is notably smaller than the total surface area measured by N2 molecule adsorption methods.
The profiles derived from immersion calorimetry with molecules of different sizes reveal significant differences in the accessibility of the microporous system of the five activated carbons. Fig. 2 shows the volumes Wo(Lc) accessible to the molecules of critical dimension Lc, as calculated from the enthalpy of immersion −ΔiH(Lc).16 The carbons CWH-30 and E-Supra present a significantly reduced accessibility. It appears that CCl4 (0.63 nm) is excluded from around 22% of the total micropore volume and only 60% is accessible to the largest molecule, TXP (1.5 nm). This effect is less relevant in Super-30 with an average micropore size of 1.24 nm, 91% and 78% of the total microporosity being accessible to CCl4 and TXP, respectively. On the other hand, SC-10 and M-30 correspond to highly activated carbons with an open porosity in the supermicropores range and their system is equally accessible to molecules of different sizes. In view of their average micropore size (1.31 and 1.45 nm, respectively), the free access of TXP may result surprising, but it just indicates that the structure of these samples is not rigid and that very large molecules may induce deformations in the micropores system. This is not unusual for carbons with high degrees of burn-off and, therefore, thin pore walls.23
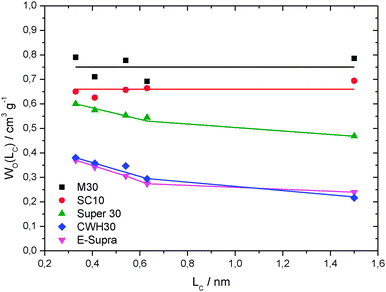 | ||
| Fig. 2 Micropore volume of activated carbons accessible to liquids with different molecular sizes. | ||
Fig. 3 compares the gravimetric capacitance (a) and the normalized capacitance to the total surface area TSA (b) of the investigated ACs as obtained by 3-electrode setup CVs carried out at 5 mV s−1 in the investigated electrolytes. According to previous studies, Et4NBF4 in PC was used applying an overall potential of 2.7 V4 while for PC-PYR14TFSI and PYR14TFSI the potential was 3.5 V.12
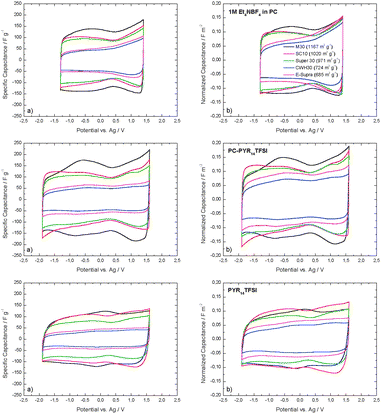 | ||
| Fig. 3 Cyclic voltammograms derived from 3-electrode setup CV-experiments at a scan rate of 5 mV s−1. (a) Specific capacitance per weight of active material, (b) normalized capacitance to the total surface area TSA of carbons. | ||
In the first approximation, it appears that the gravimetric capacitance of the different materials correlates, in all electrolytes, with the total surface area. A difference between the low- and high-surface carbons is clearly visible (Fig. 3a). M30 displays the highest values for surface area and gravimetric capacitance and a slightly distorted CV profile. This distortion could be caused by the presence of faradic reactions due to the higher content of oxygenated surface groups of this carbon compared to the others. On the other hand, the carbons with low specific surface areas (CWH30 and E-Supra) reach visibly lower gravimetric capacitances. The CV shape for CWH-30 and E-Supra in 1 M Et4NBF4 in PC reflects the effect of molecular sieving due to the limited accessibility of Et4N+ cations (0.68 nm) as suggested by the restricted access of CCl4 (0.63 nm) to the overall microporosity of these carbons (Fig. 2). The lack of symmetry cannot be observed in PYR14TFSI based electrolytes due to the size of both the PYR14+ cation and the TFSI− anion. Their access to the microporous structure of CWH-30 and E-Supra is limited, thus confining the normalized capacitance on both sides of the cyclic voltammogram.
It has been widely reported that the capacitance of carbons in different electrolytes depends on a variety of factors but, among them, the ratio between the pore width and the ion size resulted to be a key parameter.1,7,24 Further insights are provided by the normalized capacitance per unit of total surface area (Fig. 3b). When compared to the values observed for the gravimetric capacitance, the difference between the high and the low surface area ACs appears less significant. For carbons SC-10 and M30, without pores below 0.7 nm and in the absence of constrictions at the entrance of larger pores, the total surface area TSA also represents the area accessible to the ions. On the other hand, although the average width of the micropores in CWH-30 and E-Supra, 1.04 and 1.13 nm, respectively, is compatible with the size of the ions, their access is hindered by the existence of a distribution of micropore sizes and gate effects, as indicated by the immersion calorimetry experiments (Fig. 2).
The comparison of the normalized capacitance in PC-PYR14TFSI and pure PYR14TFSI definitely shows the influence of the characteristics of the electrolyte itself rather than the effect of ion dimensions (the ions size is the same for both electrolytes). The lower capacitance of all carbons in PYR14TFSI can be attributed to the high viscosity of pure IL in comparison with the mixture PC-PYR14TFSI and the absence of solvent molecules.25
The study was extended to EDLC devices with two identical electrodes. In agreement with the results obtained in a 3-electrode configuration (Fig. 3a), the gravimetric capacitance displayed by the EDLCs increases with the specific surface of the active material. In PYR14TFSI the EDLCs capacitance was, in most of the cases, about 10% lower than that observed in the mixture PC-PYR14TFSI (Fig. 4a).
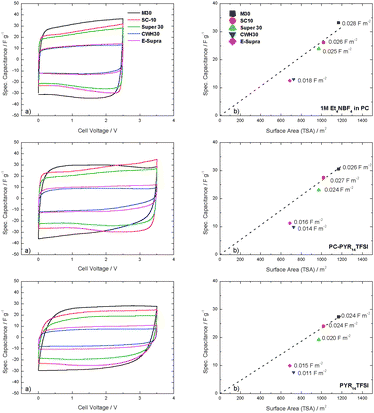 | ||
| Fig. 4 (a) Specific capacitance at 20 mV s−1 as obtained from 2-electrode setup CV experiments, (b) variation of the gravimetric capacitance with the total surface area of carbons. The numbers indicate the value of normalized capacitance for each carbon. | ||
The effect of pore size distributions of the carbons on the EDLCs performance in different electrolytes is clearly revealed when the normalized capacitance per square meter of surface area is considered. Fig. 4b illustrates the evolution of the specific capacitance of EDLCs as a function of the total surface area of carbons. The surface related-capacitance in 1 M Et4NBF4 in PC is very similar to M30, SC-10 and Super-30 (around 0.027 fm−2) suggesting a total accessibility of the overall surface area of these materials. In contrast, the reduction in the normalized capacitance observed for CWH-30 and E-Supra indicates that the surface area accessible to Et4N+ and, therefore, the effective surface in the formation of the double layer is significantly lower than the total TSA determined with small probe N2.
As PYR14TFSI possesses much larger ions than Et4NBF4 (Table 1), the effect of pore size distribution of carbons on the EDLCs capacitance is more significant in the IL-based electrolytes. The fact that the normalized capacitance for SC-10 and M-30 (0.026–0.027 fm−2) in PC-PYR14TFSI is very similar to that obtained in 1 M Et4NBF4 in PC indicates no hindrance for the larger ions of the ionic liquid. This is also supported by the data shown in Fig. 2, as the entire surface of M-30 and SC-10 is totally accessible to any size in the range of the investigated ions.
The slight deviation observed for Super-30 and the significant drop for CWH30 and E-Supra in PYR14TFSI based-electrolytes reflects the restricted accessibility associated with the corresponding PSDs. Fig. 2 reports a limited presence of pores below 1 nm for Super-30 but the contribution appears much more relevant in the carbon materials CWH30 and E-Supra.
Finally, slightly lower normalized capacitance observed in PYR14TFSI compared to PC-PYR14TFSI would correspond to the effect of the higher viscosity of the pure IL as well as the lack of solvent.
In order to further investigate the EDLC systems, 2-electrode setup CV experiments at 20 mV s−1 were conducted. The specific capacitance of these EDLCs is in agreement with the results obtained from 3-electrode setup CVs displayed in Fig. 3. From the data shown in Fig. 4a it is possible to estimate the average capacitance contribution of the surface area for total accessibility, resulting in 0.027 fm−2 for 1 M Et4NBF4 in PC and PC-PYR14TFSI and 0.024 fm−2 in PYR14TFSI (Fig. 4b). In fact, these values quantify the interaction of each electrolyte with the carbon surface and can be used to calculate, as a first approximation, the surface area accessible to them. Thus, back calculations based on C (fg−1)/Cs (fm−2) lead to the effective surface of the investigated carbons in the different electrolytes (Table 3).
| Carbon | S [1 M Et4NBF4 in PC] (m2 g−1) | S [PC-PYR14TFSI] (m2 g−1) | S [PYR14TFSI] (m2 g−1) |
|---|---|---|---|
| CWH-30 | 485 | 367 | 321 |
| E-Supra | 467 | 419 | 417 |
| Super-30 | 889 | 856 | 804 |
| SC-10 | 970 | 1019 | 1004 |
| M30 | 1230 | 1133 | 1142 |
The data displayed in Table 3 illustrate that the TSA of the carbons with average pore sizes of 1.04 nm (CWH-30) and 1.13 nm (E-Supra) is no longer perceptible for the electrolytes and the surface area accessible to the ions is notably smaller than the total surface area measured using N2 molecule adsorption methods. This suggests that the average micropore pore size may not be a reliable characteristic in order to assess the potential use of a carbon with a specific electrolyte.
As shown in Fig. 5a, the normalized capacitance per surface area changes from carbon to carbon, where larger micropore accessibility leads to higher capacitance values per overall surface area. When compared to the values observed for the gravimetric capacitance, the difference between the high and low surface area ACs appears less important. As shown in Fig. 5b, at low scan rates the normalized capacitance displayed by M30 and SC-10 is the highest among the investigated ACs. It is interesting to note that while in 1 M Et4NBF4 in PC the capacitance of M30 (0.03 fm−2) is slightly higher than that of SC-10 (0.026 fm−2), in both IL-based electrolytes the capacitance of these ACs is almost identical. With the exception of M-30, the change from 5 to 200 mV s−1 reduces the normalized capacitance approximately 20% in Et4NBF4/PC and 27% in PC-PYR14TFSI. In spite of M-30 having the most accessible porous structure, it shows significantly lower capacitance retention and only 54–50% of the value at 5 mV s−1 retained at 200 mV s−1.
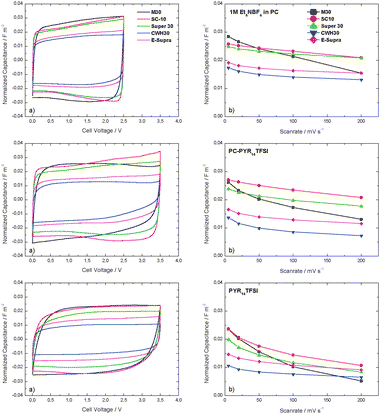 | ||
| Fig. 5 (a) Cyclic voltammograms of evaluated carbons in three different electrolytes at 20 mV s−1, using normalized capacitance (fm−2); (b) normalized capacitance of evaluated carbons at different scan rates, as obtained from the respective cyclic voltammograms. Values of normalized capacitance are per m2 of overall surface area. | ||
These results clearly indicate that the rate capability cannot be solely explained by taking into account average pore sizes or pore size distributions. Several parameters have an influence on these characteristics, such as the intrinsic electronic conductivity of the carbon and the density of oxygen-surface groups.17,26 It should be pointed out that, among the present carbons, the mesophase-derived carbon M30 displays the highest density of oxygen surface functionalities of 1.1 μmol m−2 (Table 2).
On the other hand, the capacitance retention in the highly viscous PYR14TFSI is not as high as in the other two electrolytes. Moreover, it appears to be greatly dependent on the extension of the surface area of carbons accessible to the IL rather than on the pore width. The electrical conductivity of the electrode (which has not been taken into account in this investigation) might play a role in the electrode performance.
The electrochemical characterization of the EDLCs was completed by galvanostatic charge–discharge experiments at current densities ranging from 5 to 50 mA cm−2. The charge–discharge profiles (4500th cycle) at 10 mA cm−2 illustrated in Fig. 6a show the typical triangular shape and no faradaic reactions are observed. The ohmic drop is strongly affected by the conductivity and viscosity of the corresponding electrolytes and the values follow the pattern Et4NBF4 in PC < PC-PYR14TFSI ≪ PYR14TFSI. Among the present carbons, M30 shows the largest ohmic drop, also reflected in its rate behaviour (Fig. 6b). Although SC10 has a performance similar to Super 30 in 1 M Et4NBF4 in PC, it exhibits lower power capabilities in PYR14TFSI-based electrolytes, indicating that the influence of micropore structure and TSA is greatly dependent on the chosen electrolyte.
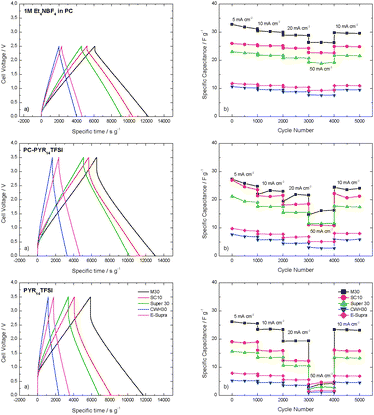 | ||
| Fig. 6 (a) Charge–discharge profiles of evaluated carbons in the three electrolytes at 10 mA cm−2. Due to different weights of active material per EDLC, the discharge time has been referred to the active materials mass in the EDLC; (b) specific capacitance over cycling at different scan rates ranging from 5 to 50 mA cm−2. | ||
Fig. 6b reveals that the electrolyte determines the capacitance retention of each carbon and whereas the EDLCs containing Et4NBF4 in PC and PC-PYR14TFSI display good capacitance retention up to 50 mA cm−2, performance of the device with PYR14TFSI is limited to 20 mA cm−2. This limited performance at 20 °C has been already reported in literature.10
As not only energy, but also power are important characteristics of an EDLC, using the results of the above mentioned tests, the average energy and power of all investigated systems are illustrated by the Ragone-like plot of Fig. 7. It is observed that the use of ILs has a positive effect on the energy storage of EDLCs, but the high viscosity of the solvent-free electrolyte PYR14TFSI leads to a limited power density. As shown, the use of PC-PYR14TFSI consents to improve the performance of IL-based EDLCs significantly, allowing the realization of devices with a good compromise between high energy and acceptable power compared to 1 M Et4NBF4 in PC when used at currents below 50 mA cm−2.
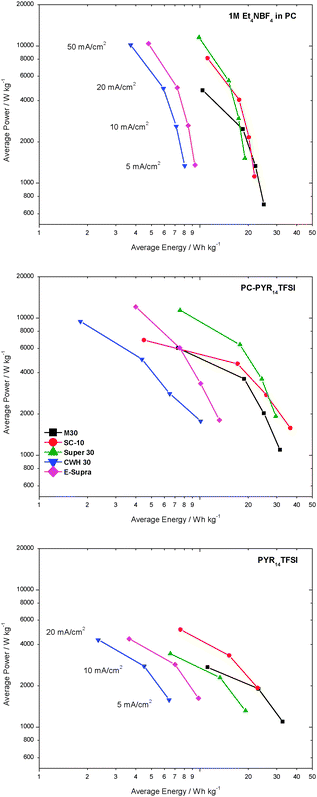 | ||
| Fig. 7 Ragone plot for the different carbons in the three electrolytes. The values for power/energy were determined at current densities ranging from 5–50 mA cm−2. For neat PYR14TFSI, the current densities ranged up to only 20 mA cm−2 due to the high viscosity of the electrolyte. | ||
Fig. 7 clearly illustrates that the selection of the carbon is extremely important for the optimization of these devices. A carbon with relative high surface area of around 900 m2 g−1, an average pore size in the order of 1.2–1.3 nm and limited gate effects such as Super 30, appears to take full advantage of the electrolyte PC-PYR14TFSI.
4. Conclusions
This study illustrates the importance of a reliable textural characterization of activated carbons used for ionic liquid-based EDLCs. The analysis of 5 activated carbons with micropore widths between 1.04 and 1.45 nm shows that the total surface determined by standard small molecules such as N2 might be misleading as it may be no longer available for the electrolyte ions. The average micropore pore size may be unreliable to assess the suitability of a carbon for a specific electrolyte. The existence of a distribution of pore sizes and/or constrictions at the entrance of the pores may hinder the access of the electrolyte to the overall porosity. It has been observed that the total surface area of some carbons with average micropore sizes above 1 nm is not accessible to PYR14TFSI. The different accessibility has been identified as the main reason for the difference in the specific capacitance of the investigated materials. However, the effect of other factors, such as surface chemistry, electric conductivity, etc. should not be neglected.The results of this work show that the ionic liquid PYR14TFSI has a positive effect on the EDLCs energy storage when used as an electrolyte, due to its high maximum operative voltage of 3.5 V. Nevertheless, the high viscosity of PYR14TFSI leads to a limited power density. The use of the mixture PC-PYR14TFSI notably enhances the EDLC operation due to its viscosity comparable to conventional organic electrolytes and thus a comparable power density. A carbon with a relatively high surface area of around 900 m2 g−1, an average pore size in the order of 1.2–1.3 nm and no gate effects such as Super 30, appears necessary to take full advantage of the electrolyte PC-PYR14TFSI.
Considering these results, the selection of the electrolyte appears to be a key factor for optimizing the electrochemical performance of the carbon electrode. Two properties result of extremely importance: the electrochemical stability of the ions (necessary to guarantee high operative voltage) and the concentration of the salt or ionic liquids into the electrolyte (which has to be as high as possible in order to guarantee high energy density). The use of an electrolyte able to satisfy both requirements, like PC-PYR14TFSI, results very promising for the improvement of the energy and power density of EDLCs.
Acknowledgements
A. Balducci wishes to thank the University of Münster, the Ministry of Innovation, Science and Research of North Rhine-Westphalia (MIWF) for the financial support. Funds to T. A. Centeno from the European Union's Seventh Framework Programme (FP7/2007-2013) under grant agreement no. 266391-Electrograph and MICINN (project MAT 2011-25198) are gratefully acknowledged.Notes and references
- P. Simon and Y. Gogotsi, Nat. Mater., 2008, 7, 845–854 CrossRef CAS PubMed.
- A. G. Pandolfo and A. F. Hollenkamp, J. Power Sources, 2006, 157, 11–27 CrossRef CAS PubMed.
- J. R. Miller and A. F. Burke, Electrochem. Soc. Interface, 2008, 17, 53 CAS.
- P. W. Ruch, D. Cericola, A. Foelske, R. Kötz and A. Wokaun, Electrochim. Acta, 2010, 55, 2352–2357 CrossRef CAS PubMed.
- P. W. Ruch, D. Cericola, A. Foelske-Schmitz, R. Kötz and A. Wokaun, Electrochim. Acta, 2010, 55, 4412–4420 CrossRef CAS PubMed.
- P. Sharma and T. S. Bhatti, Energy Convers. Manage., 2010, 51, 2901–2912 CrossRef CAS PubMed.
- T. A. Centeno, O. Sereda and F. Stoeckli, Phys. Chem. Chem. Phys., 2011, 13, 12403–12406 RSC.
- R. Kötz, M. Hahn, P. Ruch and R. Gallay, Electrochem. Commun., 2008, 10, 359–362 CrossRef PubMed.
- C. Arbizzani, M. Biso, D. Cericola, M. Lazzari, F. Soavi and M. Mastragostino, J. Power Sources, 2008, 185, 1575–1579 CrossRef CAS PubMed.
- A. Balducci, R. Dugas, P. L. Taberna, P. Simon, D. Plée, M. Mastragostino and S. Passerini, J. Power Sources, 2007, 165, 922–927 CrossRef CAS PubMed.
- N. Handa, T. Sugimoto, M. Yamagata, M. Kikuta, M. Kono and M. Ishikawa, J. Power Sources, 2008, 185, 1585–1588 CrossRef CAS PubMed.
- A. Krause and A. Balducci, Electrochem. Commun., 2011, 13, 814–817 CrossRef CAS PubMed.
- V. Ruiz, T. Huynh, S. R. Sivakkumar and A. G. Pandolfo, RSC Adv., 2012, 2, 5591–5598 RSC.
- M. Armand, F. Endres, D. R. MacFarlane, H. Ohno and B. Scrosati, Nat. Mater., 2009, 8, 621–629 CrossRef CAS PubMed.
- F. Stoeckli, Porosity in Carbons, Edward Arnold, London, 1995, pp. 67–92 Search PubMed.
- F. Stoeckli and T. A. Centeno, Carbon, 1997, 35, 1097–1100 CrossRef CAS.
- T. A. Centeno, M. Hahn, J. A. Fernández, R. Kötz and F. Stoeckli, Electrochem. Commun., 2007, 9, 1242–1246 CrossRef CAS PubMed.
- G. B. Appetecchi, S. Scaccia, C. Tizzani, F. Alessandrini and S. Passerini, J. Electrochem. Soc., 2006, 153, A1685–A1691 CrossRef CAS PubMed.
- R. S. Kühnel, N. Böckenfeld, S. Passerini, M. Winter and A. Balducci, Electrochim. Acta, 2011, 56, 4092–4099 CrossRef PubMed.
- M. Ue, in Proceedings, 8th Int. seminar on double layer capacitors, Deerfield Beach, Florida, USA, 1998.
- T. A. Centeno and F. Stoeckli, Carbon, 2010, 48, 2478–2486 CrossRef CAS PubMed.
- F. Stoeckli and A. Lavanchy, Carbon, 2000, 38, 475–477 CrossRef CAS.
- G. Lota, T. A. Centeno, E. Frackowiak and F. Stoeckli, Electrochim. Acta, 2008, 53, 2210–2216 CrossRef CAS PubMed.
- D. Qu and H. Shi, J. Power Sources, 1998, 74, 99–107 CrossRef CAS.
- A. A. Kornyshev, J. Phys. Chem. B, 2007, 111, 5545–5557 CrossRef CAS PubMed.
- J. Sánchez-González, F. Stoeckli and T. A. Centeno, J. Electroanal. Chem., 2011, 657, 176–180 CrossRef PubMed.
Footnote |
| † Electronic supplementary information (ESI) available. See DOI: 10.1039/c3cp52909f |
| This journal is © the Owner Societies 2013 |


