 Open Access Article
 This Open Access Article is licensed under a
 Creative Commons Attribution 3.0 Unported Licence
Multi-modal switching in responsive DNA block co-polymer conjugates†
Gökçen Yaşayanab, Johannes P. Magnussona, Giovanna Siciliaa, Sebastian G. Spaina, Stephanie Allena, Martyn C. Daviesa and Cameron Alexander*a
aSchool of Pharmacy, University of Nottingham, Nottingham, NG7 2RD, UK. E-mail: cameron.alexander@nottingham.ac.uk; Fax: +44 (0)115 951 5102; Tel: +44 (0)115 846 7678
bMarmara Universitesi, Istanbul, Turkey
First published on 23rd August 2013
Abstract
New classes of information-rich DNA block co-polymer conjugates were synthesised, encoded with thermoresponsive and biocompatible poly(tri(ethylene glycol)ethyl ether methacrylate) (pTriEGMA) chains and oligomeric nucleic acids connected by either bioreducible or non-reducible links. The pTriEGMA chains were grown from initiator-functionalised hybridised DNA, designed to assemble with toehold overhangs. Functional information in the conjugates was explored via dynamic light scattering (DLS) and atomic force microscopy (AFM), in order to evaluate (i) reversible self-assembly into supramolecular structures across the pTriEGMA phase transition temperature; (ii) conformational change via addition of competing DNA sequences across the toeholds, and (iii) reductive cleavage of polymer–DNA links. The results showed that discrete nanoscale conjugates could reversibly associate through pTriEGMA phase behaviour and that size and association behaviour in one class of conjugate could be switched by addition of a competing DNA sequence and by reduction to break the polymer–DNA links. Preliminary experiments with the DNA-conjugates as delivery systems for doxorubicin to a cancer cell line indicated good tolerability of the conjugates alone and cytotoxic efficacy when loaded with the drug.
Introduction
Nucleic acid nanotechnology offers a range of possibilities for new materials with sophisticated functions. Information encoded into DNA and RNA-based materials can encompass not only biological signals, but also structural and architectural function. Pioneering work by Seeman and others has shown that synthetic structures of great complexity can be assembled by re-programming DNA assembly modes.1–4 Complex dynamic behaviour and controlled chemistry with DNA assemblies has been demonstrated,5–7 while catalytically switched DNA assemblies via ‘toehold’ and hairpin sequences have enabled elegant logic and information operations to be performed.8–10The stability of certain DNA sequences in biological environments facilitates their use in practical applications, making such systems appealing as biomedical materials. Systems that could self-assemble to precisely-definable architectures in order to localise at disease sites in the body11 and then alter conformation to signal a problem or release a drug at that target site, are of particular interest. The richness of information in nucleic acid sequences suggests that DNA modules could easily be exploited to encode a structural response in a material to a disease – or externally-mediated signal. Within the biomaterials field there is an increasing focus on switching phenomena, especially via intrinsically-responsive systems.12–17 Leading papers have shown that a new class of amphiphilic co-polymers, based on PEG-methacrylate (PEGMA) are non-toxic, non-immunogenic and can change their conformations/molecular architectures in response to external stimuli.18,19 Related polyPEGMA materials can reversibly assemble into micelles and disassemble to release model drugs in response to stimuli.20 Micellar assembly/disassembly and the stimuli causing these changes can be varied and controlled to a high degree.21–25 Unfortunately, the majority of techniques to cause a response in biomaterials, either for signal transduction or for disassembly and drug release are rather generic in nature, i.e. they require heat, light, change in redox potential etc., none of which are truly customisable. Recent papers from the Herrmann group have shown, however, that polymer micelles and vesicles can be programmed to assemble into precisely controllable architectures via a combination of DNA base-pairing blocks and either hydrophilic PEG or hydrophobic PPG blocks.26–29 The combination therefore of DNA sequences with responsive polymer blocks accordingly offers intriguing possibilities for multi-switchable materials, which might act as cell- or even patient-specific bioprobes, sensors, and controlled release systems. Of particular note would be materials that could be activated by both exogenous stimuli, such as external ultrasound,30 as well as endogenous signals, such as long circulating microRNAs.31,32
However, before any practical applications can be considered for responsive DNA conjugates, their behaviour at the molecular level needs to be defined. Here we report the synthesis of new multi-responsive DNA–polymer conjugates and the characterisation of the conjugates by biophysical techniques, including AFM to give information on conjugate properties at the nanoscale. These materials combine “smart” tri(ethylene glycol)ethyl ether methacrylate (pTriEGMA) chains and oligomeric nucleic acids with ‘toehold’ sequences to facilitate strand interchange. In addition to the thermoresponsive switching of the polymer chains and the sequence binding/interchange function of the DNA blocks, the conjugates were prepared with either reducible disulfide (conjugate 1) or non-reducible links (conjugate 2) between polymer and DNA, thus providing a further means to change functional behaviour in one of the materials. The conjugates and their response modes are shown schematically in Fig. 1.
 | ||
| Fig. 1 Multi-mode switchable polymer–DNA conjugates. The three response modes are shown schematically, with temperature-induced polymer phase transition of ‘A’ blocks in the AB–B*A conjugates to supramolecular assemblies (top), DNA strand switching to separate ‘A–B–C’ and ‘B*–A’ blocks (lower middle) and reductive cleavage of polymer–DNA links to generate ‘A’ and ‘B–B*’ blocks (bottom). | ||
We further show solution biophysical data, including dynamic light scattering (DLS) and atomic force microscopy (AFM) experiments, which were used to characterise the changes in conformation of the conjugates as they were ‘switched’ by (a) temperature changes, (b) addition of DNA strands designed to disrupt self-assembly and (c) reducing agents to cleave the polymer–DNA linkages.
Finally, we report the results of preliminary investigations into the use of these materials as carriers for doxorubicin, a widely used cytotoxic, as a first stage in evaluating the efficacy of polymer–DNA conjugates as multi-switchable drug delivery systems.
Materials and methods
All solvents and reagents were of analytical or HPLC grade and purchased from Sigma or Fisher Scientific unless otherwise specified. Deuterated solvents were purchased from Sigma Aldrich.Tri(ethylene glycol)ethyl ether methacrylate (TriEGMA, Mn 246) was purchased from Sigma-Aldrich and purified by passing it through a column filled with basic alumina before use. Copper(II) bromide (Cu(II)Br2, 99%), copper(I) bromide (Cu(I)Br, >98%), triethylamine (Et3N, 99%), dithiodiethanol (technical grade), α-bromoisobutyryl bromide (98%), fluorescein O-methacrylate (97%), doxorubicin hydrochloride (98.0–102.0%), thiazolyl blue tetrazolium bromide (MTT) and N,N′-disuccinimidyl carbonate (DSC) (>95%), Tris buffer, TRIS borate EDTA (TBE) buffer (10×), N,N′,N′′,N′′′-ethylenediamine tetraacetic acid (EDTA) were purchased from Sigma-Aldrich. Tris-(2-carboxyethyl)phosphine hydrochloride (TCEP) was purchased Invitrogen. Methacryloxyethyl thiocarbamoyl rhodamine B (Polyfluor 570) was purchased from Polysciences. All reagents were used as received unless otherwise stated. Tris(2-pyridyl) methylamine (TPMA) and 3 were prepared as previously reported.33
Oligonucleotide sequences oligo 1 (5′ TAA CAG GAT TAG CAG AGC GAG G, 5′ C6-NH2), oligo 2 (5′ CCT CGC TCT GCT AAT CC, 5′ C6-NH2) and oligo 3 (CCT CGC TCT GCT AAT CCT GTT A) were purchased HPLC purified from Biomers GmbH (Uln, Germany) and used as received. Dialysis membrane (6–8 K, regenerated cellulose) was used as received from Spectrapor.
For AFM studies, mica discs and specimen discs were purchased from Agar Scientific (Stansted, UK), ScanAsyst-Fluid + AFM probes (resonant mechanical frequency: 120–180 kHz, spring constant: 0.7 N m−1) were purchased from Bruker (Cambridge, UK). 0.22 μm PES and 0.45 μm MCF syringe filters were purchased from Interlab (Wellington, New Zealand). Dulbecco's Phosphate Buffered Saline buffer (DPBS, 0.0095 M (PO4) without Ca and Mg) was purchased from Lonza (Cambridge, UK). For zeta potential measurements, disposable capillary cells were purchased from Malvern Instruments (Worcestershire, UK).
Initiator synthesis
Conjugate 1. Conjugate 1 (300 μg, 0.01 μmol) was dissolved in 0.5 mL of DNase free water. Doxorubicin hydrochloride solution (85 μg, 0.15 μmol) and triethylamine (726 μg, 7 μmol) were added to the polymer solution and allowed to equilibrate for 1 h. Triethylamine and free doxorubicin were removed by passing the solution through a PD25 minitrap column (GE Healthcare). Drug loading was determined by measuring the absorbance of the polymer solution at 480 nm in 1/1 water–DMSO and comparing to a doxorubicin hydrochloride standard curve in the same solvent.
Conjugate 2. Conjugate 2 (4000 μg, 0.05 μmol) was dissolved in 3.5 mL of DNase free water. Doxorubicin·HCl solution (400 μg, 0.69 μmol) and triethylamine (726 μg, 7 μmol) were added to the polymer solution and allowed to equilibrate for 1 h. Triethylamine and free doxorubicin were removed by passing the solution through a PD10 column (GE Healthcare). Drug loading was determined as before.
Hybrid 1. Hybrid 1 (689 μg, 0.056 μmol) was dissolved in 0.875 mL of DNase free water. Doxorubicin hydrochloride solution (204 μg, 0.35 μmol) and triethylamine (726 μg, 7 μmol) were added to the polymer solution and it was left to equilibrate for an hour. Triethylamine and free doxorubicin were removed by passing the solution through a PD10 column.
In all cases drug loading was determined by measuring the absorbance of the DNA solution at 480 nm in 50% water–50% DMSO and comparing to a doxorubicin hydrochloride standard curve.
Cell culture
Measurements and analysis
![[thin space (1/6-em)]](https://www.rsc.org/images/entities/char_2009.gif) :1) and TBE (1×) solutions. 1 μg equivalence of the appropriate oligonucleotide was loaded into each well. The oligonucleotide/polymer bands were visualized either using methylene blue or Stains All staining. IDT Oligo Length Standard 10/60 was used a size marker for the gels.
:1) and TBE (1×) solutions. 1 μg equivalence of the appropriate oligonucleotide was loaded into each well. The oligonucleotide/polymer bands were visualized either using methylene blue or Stains All staining. IDT Oligo Length Standard 10/60 was used a size marker for the gels.AFM studies were carried out across varying temperature ranges. For low temperature studies, the sample tubes were cooled in an ice bath prior to imaging and studies were carried out in a pre-cooled room. For studies above room temperature, an external heating stage (Nanoscope, Bruker, Santa Barbara, CA) was used, enabling imaging at controlled temperatures up to 40 °C. In all cases, images were obtained on freshly cleaved mica substrates pre-incubated with 10 mM MgCl2 solution for 10 min, and washed with distilled water several times and blown dry completely with nitrogen at room temperature before sample addition. The polymer–DNA conjugate samples were prepared at a concentration of 10 μg mL−1 in DPBS buffer (filtered through a 0.22 μm syringe filter). For AFM studies, topography images were captured and grain size analysis of the particles were carried out from image data (NanoScope Analysis software – Version 1.20 (Bruker)). Samples were left for at least 30 min following temperature increases, to allow samples to equilibrate prior to resuming imaging.
Variable-temperature AFM studies with polymer–DNA conjugates were performed either by heating aqueous sample solutions directly on the surface of the mica while using the AFM probe (in situ studies), or by heating–cooling samples in a small vial prior to transfer to the AFM chamber and subsequent imaging (ex situ studies).
AFM studies of the effect of competing DNA sequences on the conjugates were performed by injecting a mixture of pre-hybridised polymer–DNA conjugates and the complementary DNA (with the ratio of 1:5) onto magnesium coated mica. Conjugates were then imaged directly in the AFM chamber at temperatures between 15–40 °C, or pre-incubated with the complementary strand in a separate vial at the desired temperature before addition into the AFM chamber maintained at the same incubation temperature.
The effects of reducing agents on the polymer–DNA conjugates were evaluated by adding a solution of TCEP in DPBS (5 mM) to the conjugate solution (10 μg mL−1) with the ratio of 1:1 (v/v) with 5 min incubation time before injection of the sample onto magnesium coated mica in the AFM chamber.
| RH = kT/6πηD |
The measurements of particle sizes of the conjugates were performed at 15, 25, 30, 35 and 40 °C in DPBS buffer. Variable temperature particle size assays were carried out by cooling the system to 15 °C and re-measuring to examine disaggregation behaviour. Then complementary DNA (oligo 3) was added to the solution and particle sizes examined at 15, 30 and 40 °C. Afterwards the conjugates were examined before and after addition of complementary strands at 15 and 30 °C, and finally before and after incubation with TCEP at 30 °C. Samples were heated for 15 min at the target temperature before measurements. All samples were prepared in DPBS buffer.
Results and discussion
The new DNA–polymer hybrids were synthesised using a ‘grafting from’ approach via controlled polymerisation techniques. Atom Transfer Radical Polymerisation (ATRP) was chosen due to wide tolerance of functionality and applicability in ambient aqueous conditions.34 ATRP initiators with amino-reactive N-hydroxysuccinimidyl carbonate bromoisobutyrate ester moieties were synthesised containing either a reducible disulfide (2) or a redox stable oligo ethylene glycol linker (3, Scheme 1).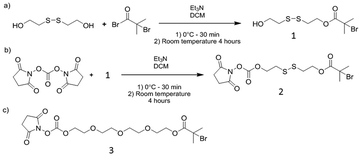 | ||
| Scheme 1 Synthesis of heterobifunctional ATRP-initiators. | ||
The DNA assembly consisted of a 22 base strand (oligo 1) and a 17 base strand (oligo 2). Oligo 2 was complementary to 17 bases from the 3′-terminus of oligo 1. Upon hybridisation of the strands a 5-base overhang, or ‘toehold’, of single stranded DNA was left at the 5′ terminus of oligo 1 to allow facile displacement in the presence of a strand fully complementary to oligo 1. We therefore envisaged an AB–B*A structure would be formed when polymers were grown from opposite ends of the DNA sequences, but which could disassemble to form ABC and AB* structures on addition of the complementary ‘C’ strand.
Both oligonucleotides contained amine moieties at their 5′ termini which were transformed into ATRP initiators by reaction with either 2 or 3. Two classes of conjugate had been intended in these studies, with the responsive polymer part of the conjugate connected to DNA via either a reducible or non-reducible link. Accordingly, reaction of 2 (with a reducible disulfide link) and 3 (no reducible link) with hybrid 1 i.e. pre-annealed oligo 1 (5′ TAA CAG GAT TAG CAG AGC GAG G, 5′ C6-NH2) and oligo 2 (5′ CCT CGC TCT GCT AAT CC, 5′ C6-NH2), yielded the macroinitiator conjugates initiator 1 and 2 respectively (Scheme 2). ATRP in aqueous conditions, with TriEGMA as a monomer known to exhibit LCST behaviour when polymerised, generated soluble block copolymer materials. Two fluorescent monomers, Polyfluor 570 and fluorescein O-methacrylate were also incorporated into the polymer chains to facilitate subsequent polymer analysis. In addition, the two classes of conjugates were prepared with different polymeric chain lengths in order to probe the effect of the thermoresponsive polymer on DNA stability and the polymeric chain length in terms of packing properties of the structures. Responsive polymer conjugate 1 contained shorter polymeric blocks linked to the DNA sequences by disulfide bonds, while the second material, with longer polymer chains and without disulfide linkers was denoted as conjugate 2 (Scheme 2).
 | ||
| Scheme 2 Synthesis of polymer–DNA conjugates. (i) Conjugation of hybrid 1 to a reducible ATRP initiator. (ii) TriEGMA/polyfluor 570 ATRP polymerisation of initiator 1. (iii) Conjugation of hybrid 1 to a non reducible ATRP initiator. (iv) TriEGMA/fluorescein O-methacrylate ATRP polymerisation of initiator 2. | ||
Primary characterisation of the conjugate materials was via gel electrophoresis and UV-Vis spectroscopy. Success of polymer growth was demonstrated by disappearance of sharp DNA-oligomer bands from polyacrylamide gel electrophoresis (PAGE) experiments, and quantification of pTriEGMA with barium/iodine staining in comparison with optical density at 260 nm to determine oligonucleotide content (Fig. S1, ESI†). Thus, while no free oligonucleotide bands corresponding to the initiator-functionalised annealed double strands (initiator 1 and 2) or any residual single strand components (oligo 1 and 2) were apparent in the PAGE experiments, a broad smear on the gel was visible in the lane corresponding to the polymer–DNA conjugates. Comparison of the UV/vis absorptions of the pTriEGMA and DNA blocks of the conjugates enabled a molar mass of the polymer part to be determined as 30 kDa for conjugate 2 (Fig. S1 and Table S1, ESI†). Molar mass of the polymer conjugate 1 was found to be 8 kDa by GPC analysis after separation of the DNA portion by TCEP.
Biophysical studies of polymer–DNA conjugates
In order to probe the solution behaviour of the polymer–DNA conjugates in response to stimuli, AFM, zeta potential measurements and DLS were employed as the primary techniques. Specifically these experiments aimed to address conjugate morphology, size, and surface charge in response to a number of stimuli including temperature, addition of complementary DNA strands and action of reducing agents. AFM has previously been used to study a range of DNA-hybrid materials so was considered particularly relevant to this study.35–37Initial experiments, carried out with freshly cleaved mica as the AFM substrate, showed no attachment of polymer–DNA conjugates at the surface of the mica under aqueous conditions. Pre-treatment of mica with MgCl2 solution followed by a wash step to remove unbound cations resulted in rapid attachment of particles to the surface. This suggested that the polyanionic DNA segments were accessible at the surface of the particles, either forming a corona layer or at least partially projecting from the surface.
Thermal response studies with conjugate 1
Two experimental designs were used to investigate the surface properties and self assembly behaviour of conjugate 1 at various temperatures. These involved (a) imaging the conjugates during temperature ramp experiments directly in the AFM sample chamber, i.e. in situ imaging of response; and (b) carrying out the temperature ramp ex situ in a sample vial and rapidly transferring the conjugates to the AFM chamber for imaging.AFM topography images (Fig. 2) indicated that conjugate 1 formed particles that were approximately spherical under all conditions investigated and the size of the conjugates increased with temperature. AFM in situ images obtained at temperatures below the expected phase transition temperature of the pTriEGMA blocks indicated the mean diameters of conjugate 1 particles were around 6 nm, increasing to ∼28 nm at 35 °C and 161 nm at 40 °C (Table 1). These data suggested that the 8 kDa pTriEGMA chains attached to the oligonucleotide sequences did not exhibit strong and persistent structures at the lowest temperatures, as the hybridised oligos would be expected to have dimensions of 4–5 nm through their 17 paired bases under these conditions.
 | ||
| Fig. 2 (A) AFM topography images of in situ aggregation studies of conjugate 1 below the LCST and at 25, 30, 35 and 40 °C, (B) ex situ aggregation studies of conjugate 1 below the LCST and at 25, 30, 35 and 40 °C. (Scales bars: 100 nm for all images. Vertical scales: 3 nm for all images at below the LCST and 25 °C, 4 nm for all images at 30 and 35 °C, 80 nm for in situ studies at 40 °C, and 130 nm for ex situ studies at 40 °C. Please see ESI,† Fig. S3 for more images obtained at 40 °C, and Table S3 for the AFM height measurements of the conjugates.) | ||
| DAFMa (nm) | DAFMb (nm) | Dhc (nm) | Dhd (nm) | Zeta potential (ζ, mV) | |
|---|---|---|---|---|---|
| a Diameter of particles by AFM in situ temperature ramp studies.b Diameter of particles by AFM ex situ temperature ramp studies.c Hydrodynamic diameter of particles by DLS mass distribution.d Hydrodynamic diameter of particles by DLS number distribution.e DLS and zeta potential studies carried out at 15 °C. | |||||
| Below LCSTe | 6 ± 2 | 6 ± 3 | 3 ± 1 | 2 ± 1 | −14 ± 1 |
| 25 °C | 7 ± 2 | 11 ± 3 | 5 ± 2 | 5 ± 2 | −18 ± 2 |
| 30 °C | 22 ± 6 | 22 ± 5 | 19 ± 7 | 18 ± 7 | −26 ± 2 |
| 35 °C | 28 ± 6 | 28 ± 7 | 23 ± 6 | 21 ± 6 | −28 ± 4 |
| 40 °C | 161 ± 22 | 317 ± 601 | 161 ± 26 | 113 ± 35 | −30 ± 1 |
Ex situ aggregation studies performed on the same conjugate showed very similar size–temperature profiles (Table 1) at all temperatures up to 40 °C, suggesting that conjugate structure and self-assembly was not markedly affected by attachment to the Mg2+-coated mica surface. However, conjugates held at 40 °C ex situ prior to imaging formed particles which were much larger and more polydisperse compared to the same conjugates imaged with in situ temperature changes. This suggested that, as expected, attachment of the particles to mica impeded full aggregation.
Intriguingly, according to both the in situ and ex situ temperature-response AFM imaging studies, the size of the particles increased over the temperature range (∼15–40 °C) spanning the known lower critical solution temperature (LCST) of pTriEGMA (26 °C), but without uncontrolled aggregation. However at temperatures well above the LCST, i.e. 40 °C, the size of the particles increased significantly, suggesting a secondary aggregation phenomenon around physiological temperatures.
DLS studies of conjugate 1 were carried out over the same temperature range probed by AFM, but with heating periods of 15 min at each target temperature before measurements of particle size. These data indicate particle sizes in reasonable accord with those obtained by AFM. However, the DLS data show features consistent with size dispersity, for example high scatter from the larger particles in the sample apparent in the intensity distribution data, and also some evidence of the reductive cleavage of polymers from the DNA segments (Fig. S4, ESI†). It should also be noted that the size of features measured by AFM is a function of the finite size of the apex of the AFM probe, whilst it is the hydrodynamic radius of the particles that is measured by DLS. Hence an exact correlation of measured particle sizes obtained via these different techniques was not expected. The height of features measured by AFM can also be influenced by the compressive forces applied by the imaging probe, and the heights of the particles were indeed found to be far smaller than the lateral dimensions of particles measured by AFM and the diameters obtained by DLS (please see ESI,† Table S3). Nevertheless, the estimates of the particle size from the number and mass distribution DLS data suggested a similar temperature dependent pattern of conjugate solution behaviour as that indicated by AFM imaging (Table 1); again, a two-stage response to temperature was observed, with an initial change in particle size apparent between 25–30 °C and full aggregation at 40 °C.
The effect of temperature on surface charge was estimated using zeta potential measurements (Table 1). Conjugate 1 was negatively charged across the temperature range, most likely due to the phosphate groups of the DNA blocks, and again indicative of a surface corona of DNA segments in the particles. The magnitude of the negative charge increased with temperature probably as a result of enhanced display of the DNA segments as the thermoresponsive pTriEGMA blocks collapse to form a hydrophobic core above the polymer LCST. The change in zeta potential was fully reversible (Fig. S5, ESI†), suggesting that pTriEGMA chain collapse above the LCST in the block co-polymers did not result in uncontrolled aggregation under these conditions.
Thermal response studies with conjugate 2
With a view to exploring the effects of a longer pTriEGMA chain on the association behaviour of the block co-polymers, thermal response studies were carried out on the second material, conjugate 2. The in situ variable-temperature AFM and DLS studies showed a very similar pattern of assembly to that obtained for conjugate 1, with the exception of particle sizes at 40 °C (Fig. 3 and Table 2). Discrete particles rather than large aggregates were formed above 35 °C, and the changes in particle size and zeta potential were fully reversible across the full temperature range (Fig. S5 and S7, Table S4, ESI†). We attribute this to the longer pTriEGMA chains in the conjugate. Support for this assertion also arose from the difficulties in visualisation of conjugate 2 by aqueous phase AFM, indicative of a highly hydrated surface layer of the conjugates under all conditions (Fig. S6, ESI†). | ||
| Fig. 3 AFM topography images of in situ aggregation studies of conjugate 2 below the LCST and at 25, 30, 35 and 40 °C. (Scale bars: 100 nm, vertical scales: 4 nm for all images. Please see ESI,† Table S3 for the AFM height measurements of the conjugates.) | ||
| DAFMa (nm) | Dhb (nm) | Dhc (nm) | Zeta potential (ζ, mV) | |
|---|---|---|---|---|
| a Diameter of particles by AFM in situ temperature-ramp studies.b Diameter of particles by DLS mass distribution.c Diameter of particles by DLS number distribution.d DLS and zeta potential studies carried out at 15 °C. | ||||
| Below LCSTd | 10 ± 3 | 7 ± 2 | 7 ± 3 | −11 ± 2 |
| 25 °C | 15 ± 5 | 14 ± 9 | 14 ± 11 | −20 ± 1 |
| 30 °C | 22 ± 10 | 16 ± 5 | 16 ± 8 | −21 ± 1 |
| 35 °C | 23 ± 8 | 20 ± 6 | 20 ± 3 | −24 ± 1 |
| 40 °C | 34 ± 14 | 24 ± 8/111 ± 20 | 24 ± 14 | −28 ± 1 |
Polymer–DNA conjugate response to competitive hybridisation
The second programmed response mode of the conjugates was based around the internal linking of the A–B polymer–DNA blocks via the DNA sequences with 5 base-pair overhangs into the AB–B*A structure (Fig. 1). Addition of a third DNA strand, oligo 3, complementary to one of the sequences holding the hybridised block co-polymers together, resulted in changes in the observed molar masses and hybridisation states as reported by gel electrophoresis (Fig. S2, ESI†).In order to probe the structures of the conjugates in further detail, AFM and DLS experiments were performed. At temperatures below the LCST of the pTriEGMA blocks AFM micrographs were dominated by preferential adsorption of the competing strands (added in excess to the conjugates) to the metal-ion doped mica surface. However, when oligo 3 was added to conjugate 1 at temperatures of 30 °C or above in the AFM sample chamber, grain size analysis indicated an overall reduction in mean diameters of particles present from 22 ± 6 nm to 18 ± 3 nm (Fig. 4 and Table 3).
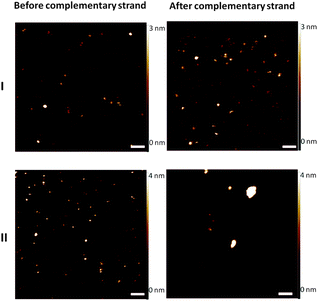 | ||
| Fig. 4 AFM topography images of conjugates before and after adding complementary group in situ at 30 °C (I); conjugate 1; (II); conjugate 2. (Scale bars: 100 nm for all images. Please see Fig. S8 and Table S5, ESI†) | ||
| Conjugate 1 before | Conjugate 1 after | ||||||
|---|---|---|---|---|---|---|---|
| DAFMa (nm) | Dhb (nm) | Dhc (nm) | DAFMa (nm) | Dhb (nm) | Dhc (nm) | ||
| a Diameter of particles by AFM grain size analysis following addition of oligo 3 in situ.b Diameter of particles by DLS mass distribution.c Diameter of particles by DLS number distribution. | |||||||
| 30 °C | Mean value | 22 ± 6 | 22 ± 5 | 19 ± 7 | 18 ± 6 | — | — |
| Population I | 15 ± 3 | 11 ± 3 | 11 ± 3 | ||||
| Population II | 26 ± 4 | — | — | ||||
| 40 °C | Mean value | 161 ± 22 | 161 ± 26 | 113 ± 35 | 50 ± 15 | — | — |
| Population I | 39 ± 5 | 41 ± 14 | 39 ± 16 | ||||
| Population II | 60 ± 14 | 227 ± 37 | — | ||||
| Conjugate 2 before | Conjugate 2 after | ||||||
|---|---|---|---|---|---|---|---|
| DAFMa (nm) | Dhb (nm) | Dhc (nm) | DAFMa (nm) | Dhb (nm) | Dhc (nm) | ||
| 30 °C | Mean value | 22 ± 10 | 16 ± 5 | 16 ± 8 | 34 ± 19 | — | — |
| Population I | 17 ± 3 | 12 ± 4 | 11 ± 6 | ||||
| Population II | 38 ± 19 | 51 ± 24 | — | ||||
| 40 °C | Mean value | 34 ± 14 | 24 ± 8 | 24 ± 14 | 60 ± 22 | — | — |
| Population I | 38 ± 7 | 34 ± 18 | 34 ± 11 | ||||
| Population II | 111 ± 20 | 74 ± 16 | 302 ± 26 | — | |||
Two populations of particles were discernible in AFM after addition of the competing DNA strand, with mean diameters of ∼15 nm and ∼26 nm, which we attribute to the presence of polymer–DNA ABC blocks as well as B*A and residual AB–B*A polymer–DNA conjugates. DLS studies confirmed the size reduction of one component of the sample but also the heterogeneity of the samples following competing strand addition. Having noted that conjugate 1 AB–B*A blocks had self-assembled to form larger structures at 40 °C than 30 °C, we assessed the sensitivity of the conjugates to complementary strand addition at the higher temperature. As is apparent from Table 3, the resultant species, although heterogeneous in overall diameter, were markedly smaller than those present before addition of the complementary oligo 3 strand.
The same experiments were carried out with conjugate 2 AB–B*A blocks, as it was expected that the longer pTriEGMA chains in these materials might sterically hinder the approach of the complementary strand to the linking B–B* hybridised sequence. The obtained particle size data were more complex for these conjugates, as heterogenous samples were obtained at both 30 °C and 40 °C, however, the change in overall diameters of the observed particulate species following addition of the competing strands suggested that some change in hybridisation state of the AB–B*A conjugates had likely occurred.
Response of polymer–DNA conjugates to a reducing environment
The conjugates 1 and 2 differed not only in chain length of the grown pTriEGMA blocks but also in the way these were attached to the DNA strands, with a reductively cleavable disulfide link in conjugate 1 but a noncleavable oligoethyleneoxide sequence in conjugate 2. In order to probe the response of the conjugates to a reducing environment we added the reducing agent TCEP, which has similar reductive potential to that occurring in vivo, but which has less tendency to precipitate in the AFM sample chamber than the biological reductant glutathione.Accordingly, conjugates 1 and 2 were imaged by AFM in fluid at 30 °C as a solution of TCEP was injected into the sample chamber. As apparent from AFM images, time dependent changes in size and morphology were apparent up to a duration of 77 minutes. The data show sizes and heights of observed structures were reduced over time and a number of elongated features formed which differed qualitatively from the mostly spherical starting components (Fig. 5). No changes were observed for conjugate 2 structures in the corresponding experiment (Fig. S11 and S12a, ESI†). In order to check that any new structural features occurring in conjugate 1 following reduction were not solely a consequence of anchorage to the mica substrate, TCEP was mixed with separate solutions of conjugates 1 and 2, and the mixtures injected onto magnesium coated mica after a 5 minute incubation time. For conjugate 1 it was observed that the size of the features reduced to 7 nm, i.e. of similar dimensions to those expected for dsDNA of 22 bases, and a number of elongated and ‘doughnut’ structures were again observed (Fig. 6). However, no change in size or shape occurred for conjugate 2 under the same reducing conditions. (Fig. S11b and c, ESI†).
 | ||
| Fig. 5 AFM topography images of conjugate 1 in in situ studies after addition of TCEP at various time points. Scale bar: 100 nm, vertical scale: 3 nm in all images. | ||
 | ||
| Fig. 6 AFM topography images of conjugate 1 after addition of reducing agent and the morphologies of the structures after addition of reducing agent in ex situ studies. TCEP was mixed with separate solutions of conjugate 1, and the mixtures injected onto magnesium-coated mica after a 5 minute incubation time. (Scale bar: 100 nm, vertical scales: 3 nm.) | ||
Evaluation of polymer–DNA conjugates as drug delivery systems
The possibility of using the multi-responsive polymer–DNA conjugates as drug delivery systems was investigated in preliminary experiments using doxorubicin as a drug capable of binding to double-stranded DNA, and A549 cells as a representative cancer cell line. Specifically we wanted to evaluate whether the conjugates might (a) self-assemble into structures of appropriate size for extended circulation (5–200 nm), (b) carry a cytotoxic dose of doxorubicin, and (c) alter conformation in response to addition of a complementary nucleotide sequence to release the cytotoxic. For these studies we aimed for proof-of-concept with a response mode designed around a DNA strand complementary to the B–B* link, in order to alter the AB–B*A structures extracellularly, as might be required for tumour tissue-localised doxorubicin delivery.We demonstrated that the native double stranded oligonucleotide had a very strong affinity towards doxorubicin (Fig. S12, ESI†). Initial assays established that the polymer–DNA conjugates could be loaded with doxorubicin and that weight ratios of up to 0.06 doxorubicin:conjugate could be achieved. The conjugate 1 could be loaded to a higher weight ratio with doxorubicin than conjugate 2, as expected based on the higher DNA:polymer ratio in conjugate 1.
Measurements of metabolic activity (MTT assay) indicated that both polymer–DNA conjugates were well tolerated by the A549 cell line with no loss in viability in the absence of doxorubicin (Fig. 7 and Fig. S14, ESI†). Polymer–DNA conjugates and their constituent oligonucleotides combined with doxorubicin were toxic at concentrations of 0.11 mM drug, and fluorescence due to doxorubicin was clearly apparent in cell images after 24 and 48 h (Fig. S15, ESI†). Perhaps surprisingly, the free doxorubicin was less toxic at the same dose than the polymer–DNA conjugates and the double-stranded DNA sequence with intercalated doxorubicin. The same cytotoxicity profile was apparent for conjugate 2.
 | ||
| Fig. 7 Cytotoxicity of free doxorubicin in A549 cells, doxorubicin bound to oligonucleotides and conjugate 1 (a) and doxorubicin bound to conjugate 2 (b). | ||
However, addition of the complementary oligonucleotide strand to oligo 1, which had been shown to compete effectively with the B–B* hybridisation in gel electrophoresis (Fig. S2, ESI†), AFM and DLS assays, did not result in overall enhanced cytotoxicity. Cell metabolic activity was not further reduced by addition of either complementary or scrambled DNA strands (Fig. S14, ESI†). It may have been the case that the complementary and scrambled single strand oligonucleotides may have been degraded by DNAses in the extracellular media before they could interact with the DNA sequences in the polymer conjugates, but this is unlikely based on the stabilities of the oligonucleotides observed in our prior assays. The fact that displacement of oligo 1 by oligo 3 was readily observed in gel electrophoresis, and also that DLS and AFM showed observable changes in conjugate structure with complementary strand addition, implies another mechanism for the lack of enhancement of doxorubicin-induced cytotoxicity expected from DNA hybrid disruption. Recent studies of ‘DNA origami’ systems,38–42 in which oligonucleotides were designed to transport and release doxorubicin to cancer cells, have indicated that conformational changes in double-stranded DNA sequences could be used to encode variable affinities for doxorubicin binding within the base pair complementary regions.43 These variable affinities arise from the way in which doxorubicin binds to different base-pair sequences in DNA,44 but it should also be noted that doxorubicin itself also alters the twist and pitch of double-stranded DNA when bound. Indeed, this phenomonenon has recently been exploited wherein specifically designed DNA sequences with varying degrees of twist have been shown to exhibit tuneable affinities for the drug.43 Although we were not able to probe in sufficient detail the structures of the doxorubicin-loaded polymer–DNA conjugates to assign changes in hybridised base pair sequence conformations, it is nevertheless likely that the attached polymer chains constrained the base pairs in the DNA blocks to some extent. This is turn may account for the lower loading of doxorubicin per oligonucleotide sequence in the responsive polymer–DNA conjugates compared to the DNA-only systems. Thus, while access to the oligonucleotide components of the conjugates by the added complementary strands was demonstrated to take place (Fig. 6 and Fig. S2, ESI†), the affinities of the original hybridised strands and the displaced strands for doxorubicin may not have been very different. Thus there may have been only a minimal difference in stability of doxorubicin bound to the B–C unit formed by addition of complementary strand oligo 3 to the conjugates compared to the starting A–B–B*–A polymer–DNA conjugates. This would mean that addition of the competing oligo 3 strand to the A–B-toehold overhangs was concurrent with displacement of the B* strand, and at such a rate that doxorubicin, intercalated initially into the double strand, did not leave the conjugate as one double strand unravelled and a second double strand formed. Support for such a mechanism was obtained in drug release studies (Fig. S16, ESI†) which indicated similar release rates for doxorubicin from the conjugates as compared with doxorubicin and added oligonucleotides.
These data, combined with the analogous studies on DNA origami systems, thus support our assertion that polymer chain length and attachment of the polymer blocks to DNA via a reducible linker were less important in delivery to A549 cells than the ability to bind doxorubicin in the DNA strands. However, the data suggests some design rules for future studies, in that polymer–DNA conjugates need to have controlled structure at multiple scales, i.e. including base pair twist, as well as base pair sequence and assembly into nanoscale objects, in order to function as effective cytotoxic delivery systems.
Overall, the combined biophysical analyses (AFM, DLS and PAGE) shows that the conjugates were able to alter their conformations and structures through a variety of stimuli (temperature, addition of DNA strands and for conjugate 1, reduction), and drug delivery experiments indicated that the polymer–DNA conjugates were good carriers for doxorubicin. Although other DNA carriers have recently been reported for enhanced delivery of doxorubicin,39,43 the in vitro cytotoxicity of doxorubicin was not enhanced by addition of a competing strand in our assays.
Conclusions
Two new polymer–DNA conjugate species were prepared by ATRP-‘grafting-from’ methodologies. Three different and experimentally orthogonal response mechanisms were encoded in the polymer structures and the resultant structural changes in the polymers were characterised by AFM and DLS studies across temperature ranges, before and after addition of competing and scrambled DNA sequences, and before and after addition of a reducing agent. These data provide useful information for the design of drug and gene delivery vehicles, cell entry/trafficking systems, and provide insight for enhancing polymer-based therapeutics. Our studies focused on extracellular responses of the conjugates to complementary DNA strands, but for intracellular release an uncharged morpholino sequence could be used in place of the charged DNA. Similarly, for sensing and diagnostic applications, linking oligonucleotide strands between the polymers could be complementary to a miRNA sequence indicative of disease. However, a key parameter for the use of these systems in any practical application is the ability to define precisely the molecular level structure, such that a binding/hybridisation/strand breaking stimulus is able to cause sufficient changes in architecture to effect sensing and/or release.This work was supported by the Engineering and Physical Sciences Research Council (Grant EP/H005625/1) and by a scholarship to GY from Marmara University. We also thank Christine Grainger-Boultby for technical help and Dr Francisco Fernandez-Trillo for helpful discussions.
Notes and references
- B. Chakraborty, R. J. Sha and N. C. Seeman, Proc. Natl. Acad. Sci. U. S. A., 2008, 105, 17245–17249 CrossRef CAS PubMed.
- C. X. Lin, S. Rinker, X. Wang, Y. Liu, N. C. Seeman and H. Yan, Proc. Natl. Acad. Sci. U. S. A., 2008, 105, 17626–17631 CrossRef CAS PubMed.
- N. Wu, X. Zhou, D. M. Czajkowsky, M. Ye, D. Zeng, Y. Fu, C. Fan, J. Hu and B. Li, Nanoscale, 2011, 3, 2481–2484 RSC.
- K. Numajiri, M. Kimura, A. Kuzuya and M. Komiyama, Chem. Commun., 2010, 46, 5127–5129 RSC.
- M. Gao, K. Gawel and B. T. Stokke, Soft Matter, 2011, 7, 1741–1746 RSC.
- R. P. Goodman, M. Heilemann, S. Doose, C. M. Erben, A. N. Kapanidis and A. J. Turberfield, Nat. Nanotechnol., 2008, 3, 93–96 CrossRef CAS PubMed.
- M. L. McKee, P. J. Milnes, J. Bath, E. Stulz, R. K. O'Reilly and A. J. Turberfield, J. Am. Chem. Soc., 2012, 134, 1446–1449 CrossRef CAS PubMed.
- P. Yin, H. M. T. Choi, C. R. Calvert and N. A. Pierce, Nature, 2008, 451, 318 CrossRef CAS PubMed.
- M. J. Campolongo, J. S. Kahn, W. Cheng, D. Yang, T. Gupton-Campolongo and D. Luo, J. Mater. Chem., 2011, 21, 6113–6121 RSC.
- S. Chatterjee, J. B. Lee, N. V. Valappil, D. Luo and V. M. Menon, Nanoscale, 2012, 4, 1568–1571 RSC.
- D. E. Owens and N. A. Peppas, Int. J. Pharm., 2006, 307, 93–102 CrossRef CAS PubMed.
- G. Pasparakis and M. Vamvakaki, Polym. Chem., 2011, 2, 1234–1248 RSC.
- J. Buller, A. Laschewsky, J.-F. Lutz and E. Wischerhoff, Polym. Chem., 2011, 2, 1486–1489 RSC.
- M. Soliman, R. Nasanit, S. R. Abulateefeh, S. Allen, M. C. Davies, S. S. Briggs, L. W. Seymour, J. A. Preece, A. M. Grabowska, S. A. Watson and C. Alexander, Mol. Pharmaceutics, 2012, 9, 1–13 CrossRef CAS PubMed.
- F. S. Du, Y. Wang, R. Zhang and Z. C. Li, Soft Matter, 2010, 6, 835–848 RSC.
- G. Gao, H. Heo, J. Lee and D. Lee, J. Mater. Chem., 2010, 20, 5454–5461 RSC.
- D. S. W. Benoit, S. M. Henry, A. D. Shubin, A. S. Hoffman and P. S. Stayton, Mol. Pharmaceutics, 2010, 7, 442–455 CrossRef CAS PubMed.
- J. F. Lutz, O. Akdemir and A. Hoth, J. Am. Chem. Soc., 2006, 128, 13046–13047 CrossRef CAS PubMed.
- J. F. Lutz and A. Hoth, Macromolecules, 2006, 39, 893–896 CrossRef CAS.
- J. P. Magnusson, A. Khan, G. Pasparakis, A. O. Saeed, W. Wang and C. Alexander, J. Am. Chem. Soc., 2008, 130, 10852–10853 CrossRef CAS PubMed.
- N. Feebler, N. Badi, K. Schade, S. Pfeifer and J. F. Lutz, Macromolecules, 2009, 42, 33–36 CrossRef.
- T. Traitel, R. Goldbart and J. Kost, J. Biomater. Sci., Polym. Ed., 2008, 19, 755–767 CrossRef CAS PubMed.
- E. Wagner, Expert Opin. Biol. Ther., 2007, 7, 587–593 CrossRef CAS PubMed.
- M. Nakayama and T. Okano, J. Drug Delivery Sci. Technol., 2006, 16, 35–44 CAS.
- Y. T. Li, Y. Q. Tang, R. Narain, A. L. Lewis and S. P. Armes, Langmuir, 2005, 21, 9946–9954 CrossRef CAS PubMed.
- M. S. Ayaz, M. Kwak, F. E. Alemdaroglu, J. Wang, R. Berger and A. Herrmann, Chem. Commun., 2011, 47, 2243–2245 RSC.
- F. E. Alemdaroglu, N. C. Alemdaroglu, P. Langguth and A. Herrmann, Adv. Mater., 2008, 20, 899–902 CrossRef CAS.
- F. E. Alemdaroglu, M. Safak, J. Wang, R. Berger and A. Herrmann, Chem. Commun., 2007, 1358–1359 RSC.
- F. E. Alemdaroglu and A. Herrmann, Org. Biomol. Chem., 2007, 5, 1311–1320 CAS.
- G. Li, G. Fei, H. Xia, J. Han and Y. Zhao, J. Mater. Chem., 2012, 22, 7692–7696 RSC.
- X. Chen, H. W. Liang, J. F. Zhang, K. Zen and C. Y. Zhang, Trends Cell Biol., 2012, 22, 125–132 CrossRef CAS PubMed.
- K. Zen and C. Y. Zhang, Med. Res. Rev., 2012, 32, 326–348 CrossRef PubMed.
- Z. Tyeklar, R. R. Jacobson, N. Wei, N. N. Murthy, J. Zubieta and K. D. Karlin, J. Am. Chem. Soc., 1993, 115, 2677–2689 CrossRef CAS.
- J. P. Magnusson, S. Bersani, S. Salmaso, C. Alexander and P. Caliceti, Bioconjugate Chem., 2010, 21, 671–678 CrossRef CAS PubMed.
- M. Kwak and A. Herrmann, Angew. Chem., Int. Ed., 2010, 49, 8574–8587 CrossRef CAS PubMed.
- K. Ding, F. E. Alemdaroglu, M. Boersch, R. Berger and A. Herrmann, Angew. Chem., Int. Ed., 2007, 46, 1172–1175 CrossRef CAS PubMed.
- S. Nagahara and T. Matsuda, Polym. Gels Networks, 1996, 4, 111–127 CrossRef CAS.
- M. Endo, Y. Yang and H. Sugiyama, Biomater. Sci., 2013, 1, 347–360 RSC.
- Q. Jiang, C. Song, J. Nangreave, X. Liu, L. Lin, D. Qiu, Z.-G. Wang, G. Zou, X. Liang, H. Yan and B. Ding, J. Am. Chem. Soc., 2012, 134, 13396–13403 CrossRef CAS PubMed.
- A. Kuzuya and M. Komiyama, Nanoscale, 2010, 2, 309–321 RSC.
- Y. Ke, G. Bellot, N. V. Voigt, E. Fradkov and W. M. Shih, Chem. Sci., 2012, 3, 2587–2597 RSC.
- S. M. Douglas, H. Dietz, T. Liedl, B. Hogberg, F. Graf and W. M. Shih, Nature, 2009, 459, 414–418 CrossRef CAS PubMed.
- Y.-X. Zhao, A. Shaw, X. Zeng, E. Benson, A. M. Nystrom and B. Hogberg, ACS Nano, 2012, 6, 8684–8691 CrossRef CAS PubMed.
- G. E. Kellogg, J. N. Scarsdale and F. A. Fornari, Nucleic Acids Res., 1998, 26, 4721–4732 CrossRef CAS PubMed.
Footnote |
| † Electronic supplementary information (ESI) available. See DOI: 10.1039/c3cp52243a |
| This journal is © the Owner Societies 2013 |