 Open Access Article
 This Open Access Article is licensed under a
 Creative Commons Attribution 3.0 Unported Licence
New interatomic potential parameters for molecular dynamics simulations of rare-earth (RE = La, Y, Lu, Sc) aluminosilicate glass structures: exploration of RE3+ field-strength effects†
Kirill
Okhotnikov
,
Baltzar
Stevensson
and
Mattias
Edén
*
Physical Chemistry Division, Department of Materials and Environmental Chemistry, Arrhenius Laboratory, Stockholm University, SE-106 91 Stockholm, Sweden. E-mail: mattias.eden@mmk.su.se
First published on 9th July 2013
Abstract
Sets of self-consistent oxygen-rare earth (RE = La, Y, Lu, Sc) interatomic potential parameters are derived using a force-matching procedure and utilized in molecular dynamics (MD) simulations for exploring the structures of RE2O3–Al2O3–SiO2 glasses that feature a fixed molar ratio nAl/nSi = 1 but variable RE contents. The structures of RE aluminosilicate (AS) glasses depend markedly on the RE3+ cation field strength (CFS) over both short and intermediate length-scales. We explore these dependencies for glasses incorporating the cations La3+, Y3+, Lu3+ and Sc3+, whose CFSs increase due to the concomitant shrinkage of the ionic radii: RLa > RY > RLu > RSc. This trend is mirrored in decreasing average RE3+ coordination numbers (![[Z with combining macron]](https://www.rsc.org/images/entities/i_char_005a_0304.gif) RE) from La = 6.4 to Sc = 5.4 in the MD-derived data. However, overall the effects from RE3+ CFS elevations on the local glass structures are most pronounced in the O and {Al[4], Al[5], Al[6]} speciations. The former display minor but growing populations of O[0] (“free oxygen ion”) and O[3] (“oxygen tricluster”) moieties. The abundance of AlO5 polyhedra increases significantly from ≈10% in La-based glasses to ≈30% in their Sc counterparts at the expense of the overall dominating AlO4 tetrahedra, whereas the amounts of AlO6 groups remain <5% throughout. We also discuss the Si[4]/Al[p] (p = 4, 5, 6) intermixing and the nature of their oxygen bridges, where the degree of edge-sharing increases together with the RE3+ CFS.
RE) from La = 6.4 to Sc = 5.4 in the MD-derived data. However, overall the effects from RE3+ CFS elevations on the local glass structures are most pronounced in the O and {Al[4], Al[5], Al[6]} speciations. The former display minor but growing populations of O[0] (“free oxygen ion”) and O[3] (“oxygen tricluster”) moieties. The abundance of AlO5 polyhedra increases significantly from ≈10% in La-based glasses to ≈30% in their Sc counterparts at the expense of the overall dominating AlO4 tetrahedra, whereas the amounts of AlO6 groups remain <5% throughout. We also discuss the Si[4]/Al[p] (p = 4, 5, 6) intermixing and the nature of their oxygen bridges, where the degree of edge-sharing increases together with the RE3+ CFS.
1 Introduction
Thanks to their beneficial (magneto)optical properties, rare-earth (RE) bearing silicate-based glasses have found applications as laser hosts and optical amplifiers in telecommunication. For optimal performance of such devices, it is desirable to introduce high amounts of uniformly dispersed RE3+ ions into silica melts. Unfortunately, the RE2O3–SiO2 system manifests liquid immiscibility, which leads to RE-clustering at low RE2O3 contents of a few mol% and to macroscopic phase-separations for RE3+-richer compositions.1,2 The solubility may be increased by introducing RE3+ ions into a M2O–SiO2 based glass,3–7 or by exploiting the ternary RE2O3–Al2O3–SiO2 aluminosilicate (AS) system8–18 that generally admits the formation of homogeneous amorphous phases by standard melt-quench procedures/conditions,8–11,15–17 unless their RE2O3 and/or Al2O3 contents are too low (typically ≲10 mol%, depending on the identity of the RE3+ ion11,15).Owing to their chemical inertness and favorable physical properties, e.g., high glass transition temperatures (Tg), high microhardness (HV) and low thermal expansion coefficients, lanthanide-bearing AS glasses are explored as model systems for storage of long-lived actinides,19 whereas Y–Al–Si–O glasses are exploited in radiotherapy for in situ cancer treatment.9,20 There is a strong correlation between many physical/mechanical features of RE2O3–Al2O3–SiO2 glasses and the RE3+ cation field-strength (CFS); the CFS is given by z/R2, where z and R denote the charge and radius of the ion, respectively. However, the detailed structure–property relationships of RE AS glasses are poorly understood, such as why the Tg-value of the glass strongly depends on the RE3+ CFS10,11,15–18 but is almost independent of its RE–Al–Si composition.9–11,16,17 While such peculiarities inarguably stem from the presence of RE3+ ions and most likely originate from their bearings on structural features over both short and intermediate length-scales ≲1 nm, the currently incomplete structural insight hampers unambiguous rationalizations of many structure–property correlations of RE2O3–Al2O3–SiO2 glasses. We have recently demonstrated that the RE3+ effects on such relationships may be subtle, for example that the well-known enhanced microhardness for increasing RE3+ CFS originates from the accompanying elevated amounts of high-coordination AlO5/AlO6 polyhedra,16,21 whose populations are in turn dictated by the RE3+ CFS.12–18
Hence, it is desirable to reach a more detailed structural picture that encompasses (i) the local RE3+ environments (coordination numbers and RE–O distances) and their distribution across the structure, as well as (ii) the speciations and intermixing of the various SiO4 and AlOp (p = 4, 5, 6) groups associated with the glass network. Data obtained from X-ray and neutron diffraction techniques18,22 constitute the primary information source for feature (i), whereas the hitherto most detailed insight into the network structures stem from 17O, 27Al, and 29Si solid-state nuclear magnetic resonance (NMR) spectroscopy applied to AS glasses incorporating the diamagnetic (and thereby accessible to NMR) La3+, Y3+, Lu3+ and Sc3+ ions12–18,23–25 that are listed in the order of decreasing ionic radii and thereby increasing CFS. Besides including both end-members of the lanthanide series, this ion-set features a large CFS-span from 2.8 Å−2 for La3+ to 5.4 Å−2 for Sc3+, thereby allowing for the probing of structural variations across a wide range of field-strengths.
As the experimentally derived structural understanding is insufficient, molecular dynamics (MD) simulation is an attractive method for gaining complementary insight. However, such reports of RE2O3–Al2O3–SiO2 glasses are hitherto limited to the Y system,16,26–28 except in our recent modeling work on Lu16 and La25 AS glasses. The present contribution serves the dual purpose of (i) outlining the approach for deriving the RE–O (RE = La, Y, Lu) interionic potential parameters utilized by us in ref. 16 and 25, as well as introducing new parameters for the Sc–O pair; (ii) exploring the relationships between the local structural features and the nature of the RE3+ ion (RE = La, Y, Lu, Sc) in two series of RE–Al–Si–O glasses; RE(2.21) and RE(2.45). Their members feature equal Al and Si molar contents but distinct glass network polymerization degrees29 of r = 2.21 and r = 2.45, respectively, with
| r = nO/(nAl + nSi), | (1) |
| xE = nE/(nSi + nAl + nRE), with E = Si, Al, or RE. | (2) |
This paper is organized as follows: Section 2 describes our general MD simulation procedures, whereas Section 3 outlines our implementation of the three-step force-matching procedure of Ercolessi and Adams,30 which was employed to derive new Born–Mayer RE–O interionic potential parameters for RE = La, Y, Lu, Sc. These are subsequently evaluated in Section 4, where the modeled short-range features of RE2O3–Al2O3–SiO2 glasses—as well as the energy-optimized lattice parameters of several RE-bearing oxide and aluminate structures—are compared with experimental literature data. Section 5 explores the dependence of local and intermediate-range structures of the RE(2.21) and RE(2.45) glass series on variations of each of the four RE3+ ions and their respective contents, where we examine the RE and O speciations, the cation constellations at the various O environments, as well as the Si–Al intermixing and the nature of their shared bridging oxygen (BO) sites.
2 Computational details
The classical MD simulations emulating a melt-quench procedure were performed for an NVT ensemble in a cubic box with periodic boundary conditions.31 The computations were carried out with the DLPOLY3 package32,33 for ≈3300 atoms and a cubic box-length in the range 3.33–3.54 nm. These parameters were adjusted slightly to match the experimental density and composition of each RE AS glass, using the previously reported values for the La,11,24 Y,16 Lu16 and Sc17 bearing samples. The experimental densities ranged between 2.93 g cm−3 for Sc(2.21) and 5.05 g cm−3 for Lu(2.45).15 The melt-quench simulation started from a structure equilibrated at 3500 K for 100 ps, followed by a 10 ps step-wise decrease of 10 K ps−1 down to 300 K, where equilibration was performed during 200 ps, of which the trajectory during the last 150 ps was used for the structural analysis. For each glass composition, this protocol was completed twelve times with distinct initial ion configurations, each generated by a random distribution subject to the constraint of a 50 pm minimum distance in any ion-pair. The average value and uncertainty of each reported modeled structural feature was derived from these distinct trajectories.For two ion species α and β with indices j and k separated at a distance Rjkα–β, the corresponding interaction energy included both long-range Coulombic (∼zαzβ/[4πε0Rjkα–β], where zα represents the ionic charge), and short-range Buckingham terms. The latter is given by
Ujkα–β(Rjkα–β) = Aα–β![[thin space (1/6-em)]](https://www.rsc.org/images/entities/char_2009.gif) exp{−Rjkα–β/ρα–β} − Cα–β(Rjkα–β)−6, exp{−Rjkα–β/ρα–β} − Cα–β(Rjkα–β)−6, | (3) |
| Ujkα–β(Rjkα–β) = Aα–βexp{−Rjkα–β/ρα–β}, | (4) |
| Paira | A/eV | ρ/Å | C/(eV Å6) |
|---|---|---|---|
| a Superscripts indicate values of the partial ionic charges according to van Beest et al.34 b Parameters from Du and Cormack.26,40,41 c The new parameters derived herein, corresponding to the set {A(3)RE–O,ρ(3)RE–O} of Section 3. | |||
| O1.2−–O1.2−b |
1844.7458 | 0.343645 | 192.58 |
| Al1.8+–O1.2− | 12201.417 |
0.195628 | 31.997 |
| Si2.4+–O1.2− | 13702.905 |
0.193817 | 54.681 |
| Y1.8+–O1.2− | 29526.977 |
0.211377 | 50.477 |
| La1.8+–O1.2−c |
9537.95 | 0.235917 | 0 |
| Y1.8+–O1.2− | 11019.6 |
0.224173 | 0 |
| Lu1.8+–O1.2− | 6657.09 | 0.230360 | 0 |
| Sc1.8+–O1.2− | 3095.04 | 0.244357 | 0 |
These parameters and methods were employed throughout all MD simulations, except for the optimization procedure of the new RE–O potential parameters in Section 3, which employed a smaller set of 113 atoms and box-lengths spanning 1.12–1.15 nm, whereas 0.53 nm and 0.55 nm cut-off radii were used for the Buckingham and Coulombic interactions, respectively. The restricted set of atoms originates from computer memory constraints in the ab initio calculations outlined below.
To verify that the sets of interionic potential parameters may also reproduce the experimental glass densities, we additionally performed NPT simulations for four distinct initial configurations of each composition. The modeled densities were consistently slightly lower than their experimental counterparts, but deviated only by ≲3% and ≲5% within each RE(2.21) and RE(2.45) series, respectively. The overall largest discrepancy (5.3%) was observed for the Y(2.45) composition, whereas essentially perfect matches resulted for the two La glass compositions (<1% relative error). The sets of simulations revealed a negligible spread within ±0.01 g cm−3 for each glass; incidentally, this value is equal to the experimental uncertainty.15–17
3 Optimization of RE–O interionic potential parameters
Current computer resources limit ab initio calculations to systems comprising less than a few hundred atoms over ≲10 ps, and simulations of larger ensembles over long timescales can only be achieved by classical MD approaches31 that require a set of parameters for approximating the interaction energy in each ion-pair of a targeted structure. An “ideal” interaction potential should reproduce the experimentally assessed properties of the system, as well as providing reliable predictions over widely spanning sample compositions. Several strategies exist for constructing interatomic potentials, such as the reverse Monte Carlo,36,37 electronic density,38 and effective medium39 options.We employed the iterative force-matching procedure of Ercolessi and Adams30 to obtain the parameters Aα–β and ρα–β of the Born–Mayer potential [eqn (4)]; their values were selected so as to provide the closest possible match to ab initio-derived forces. Such a protocol is convenient for applications to amorphous phases where elastic constants or lattice parameters cannot be defined. It was carried out for the RE(2.21) composition of each RE–Al–Si–O (RE = La, Y, Lu, and Sc) glass. Every iteration step (n) involves three stages:
(1) For a given set of Buckingham parameters {Aα–β,ρα–β,Cα–β} of Si–O, Al–O and O–O interionic pairs (using the values of Du et al.26,40,41) and Born–Mayer counterparts {A(n)RE–O,ρ(n)RE–O} for the RE–O pairs, a glass structure model was obtained using classical MD simulations (see Section 2) at the nth iteration stage. For the case of RE = Y, the initial set {A(0)Y–O,ρ(0)Y–O} was derived by mapping the Buckingham parameters of Du26 onto the Born–Mayer form [{AY–O,ρY–O,CY–O} → {A(0)Y–O,ρ(0)Y–O}] using a numerical fitting, whereas the A(0)RE–O starting values were scaled for the other RE–O contacts according to the ratios of their Shannon–Prewitt42 ionic radii (RRE/RY).
(2) The ion coordinates of each MD-derived glass structure were utilized in a density functional theory (DFT) full-potential linearized augmented plane wave (FP-LAPW)43,44 calculation to provide the interionic forces [![[F with combining macron]](https://www.rsc.org/images/entities/i_char_0046_0304.gif) (ab initio)]. The generalized gradient approximation of Perdew, Burke and Ernzerhof45 was used with the Wien2k package.46 One k-point of the irreducible Brillouin zone was computed by employing basis functions that obeyed the criterion KmaxRmin = 7.0, where Kmax represents the magnitude of the largest basis vector in the reciprocal space and Rmin is the smallest muffin-tin radius in the simulated cell. The latter values were fixed throughout all computations at 1.83 a.u., 1.66 a.u., 1.51 a.u., and 1.31 a.u. for the RE, Al, Si, and O species, respectively.46 We verified that the product KmaxRmin = 7.0 provides converged forces. The electronic band-states were separated by −8.1 Ry to include all contributions down to the 2p and 2s orbitals for Si and Al, respectively. The force convergence criteria for the self-consistent field (SCF) procedure were 0.5 mRy per a.u. During the last SCF-cycle, the total forces were calculated using Pulay's correction.47
(ab initio)]. The generalized gradient approximation of Perdew, Burke and Ernzerhof45 was used with the Wien2k package.46 One k-point of the irreducible Brillouin zone was computed by employing basis functions that obeyed the criterion KmaxRmin = 7.0, where Kmax represents the magnitude of the largest basis vector in the reciprocal space and Rmin is the smallest muffin-tin radius in the simulated cell. The latter values were fixed throughout all computations at 1.83 a.u., 1.66 a.u., 1.51 a.u., and 1.31 a.u. for the RE, Al, Si, and O species, respectively.46 We verified that the product KmaxRmin = 7.0 provides converged forces. The electronic band-states were separated by −8.1 Ry to include all contributions down to the 2p and 2s orbitals for Si and Al, respectively. The force convergence criteria for the self-consistent field (SCF) procedure were 0.5 mRy per a.u. During the last SCF-cycle, the total forces were calculated using Pulay's correction.47
(3) The DLPOLY3 package32,33 was employed to compute a set of forces {j(ARE–O,ρRE–O)}. A refined set of interionic potential parameters resulted from a least-square force-fitting procedure that minimized the function
 | (5) |
Steps (1)–(3) of the protocol were repeated three times, resulting in the sets {A(n)RE–O,ρ(n)RE–O} with n = 1, 2, and 3. Table 1 lists the {A(3)RE–O,ρ(3)RE–O} values that were employed in all remaining calculations, as well as in our recent work.16,25 The parameters obtained at each iteration stage were used to compute the potential energy [URE–O(RRE–O)] from eqn (4), as well as the respective radial distribution function [RDF; denoted gRE–O(RRE–O)]. The latter was evaluated for an ensemble of ≈3300 atoms, as described in Section 2. Fig. S1 of the ESI† shows the results for the RE(2.21) glass composition and RE = {La, Y, Lu, Sc}.
4 Validation of the interionic potential parameters
4.1 Short-range structures of RE2O3–Al2O3–SiO2 glasses
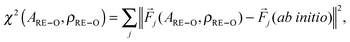
The general validity of the new potential parameters for reproducing short-range structural features of RE2O3–Al2O3–SiO2 glasses was previously confirmed over large RE–Al–Si compositional ranges within each La,25 Y16 and Lu16 system. Focussing on the structural dependency on the identity of the RE3+ ion, we evaluate here the predictions of the MD simulations for the series of RE(2.21) and RE(2.45) specimens against experimental results from either solid-state NMR16,17,25 (Si and Al coordinations) or diffraction18,22 techniques; the latter data on cation–oxygen distances were reported for Si-richer and RE-poorer compositions and may therefore only serve as general guides.Fourfold Al3+ coordinations dominate the three coexisting AlO4, AlO5 and AlO6 polyhedra. The amounts of higher-coordination species (mainly AlO5) grow primarily for increasing RE3+ CFS and secondly for decreasing xSi, in good agreement with experimental findings.13,14,16,17,25 These trends are witnessed in the average Al coordination number (Al) and fractional populations {x[p]Al} of the {AlOp} polyhedra listed in Table 2 for the two RE(2.21) and RE(2.45) series of specimens. As the CFS elevates between the La3+ and Sc3+ ions, the modeled Al values range over 4.14–4.43 for the RE(2.45) series, whereas its RE(2.21) counterpart displays nearly equal average Al coordination numbers ≈4.24 in the Y, Lu and Sc bearing structures. Minor variations are observed for each RE AS structure when xSi diminishes, i.e., for increasing the r-value of the glass. The elevation of Al stems primarily from a growth of the AlO5 population, whereas that for the AlO6 groups remains low throughout (x[6]Al < 0.05).
| Glass |
RE
|
Al
|
x [4]Al | x [5]Al | x [6]Al |
O
|
x [0]O | x [1]O | x [2]O | x [3]O |
|---|---|---|---|---|---|---|---|---|---|---|
|
a MD-derived RE3+ and Al3+ average coordination numbers (RE, Al) and fractional populations of AlOp groups (x[p]Al) obtained by MD simulations and NMR. The latter data are given within parentheses and are reproduced from our recent work.16,17,25 The populations are associated with uncertainties of ±0.010 (MD) and ±0.015 (NMR). The rightmost columns list the mean O coordination numbers (O) and the fractional population x[p]O of each O[p] (p = 0, 1, 2, 3) coordination, where only bonds to Si and Al are considered.
b Results obtained by using the Y–O potential parameters of Du.26
|
||||||||||
| La(2.21) | 6.39 | 4.13(4.14) | 0.872(0.877) | 0.123(0.091) | 0.005(0.022) | 1.84 | 0.009 | 0.229 | 0.677 | 0.085 |
| Y(2.21) | 6.18 | 4.24(4.25) | 0.773(0.776) | 0.209(0.195) | 0.018(0.029) | 1.86 | 0.010 | 0.226 | 0.655 | 0.109 |
| Lu(2.21) | 5.66 | 4.23(4.31) | 0.782(0.718) | 0.201(0.250) | 0.017(0.032) | 1.86 | 0.012 | 0.232 | 0.641 | 0.115 |
| Sc(2.21) | 5.13 | 4.25(4.40) | 0.767(0.649) | 0.217(0.307) | 0.016(0.044) | 1.86 | 0.017 | 0.231 | 0.629 | 0.123 |
| La(2.45) | 6.42 | 4.14(4.14) | 0.871(0.884) | 0.122(0.089) | 0.007(0.027) | 1.66 | 0.022 | 0.350 | 0.576 | 0.052 |
| Y(2.45) | 6.29 | 4.30(4.30) | 0.729(0.746) | 0.246(0.210) | 0.025(0.044) | 1.70 | 0.025 | 0.333 | 0.564 | 0.078 |
| Lu(2.45) | 5.77 | 4.29(4.34) | 0.739(0.698) | 0.237(0.260) | 0.024(0.042) | 1.69 | 0.031 | 0.329 | 0.559 | 0.081 |
| Sc(2.45) | 5.38 | 4.43 | 0.621 | 0.331 | 0.048 | 1.72 | 0.034 | 0.317 | 0.544 | 0.105 |
| Y(2.21)b | 6.51 | 4.22(4.25) | 0.795(0.776) | 0.191(0.195) | 0.014(0.029) | 1.86 | 0.006 | 0.227 | 0.669 | 0.098 |
| Y(2.45)b | 6.60 | 4.28(4.30) | 0.738(0.746) | 0.239(0.210) | 0.023(0.044) | 1.69 | 0.019 | 0.337 | 0.578 | 0.066 |
Table 2 compares the modeled Al and {x[p]Al} results with their experimental counterparts obtained from solid-state 27Al NMR in ref. 16, 17 and 25. The x[p]Al values are plotted against the RE3+ CFS in Fig. 1. While excellent agreement is observed for all La and Y AS glasses, for the cases of Lu and Sc the MD simulations underestimate the AlO5 populations (and thereby Al), notably so for the Sc(2.21) glass. Despite the largest relative discrepancy between the MD and NMR derived Al-values being only ≈4% [for Sc(2.21)], the pronounced experimental trend of a monotonic elevation of Al for increasing RE3+ CFS is not reproduced well by the simulations of the Lu and Sc members, particularly for the r = 2.21 branch. Given the significantly faster quench-rate in the calculations relative to the physical samples, one expects the modeled x[5]Al and x[6]Al populations to be comparable to, or even higher, than their NMR-derived counterparts, as explained in detail in ref. 25. Hence, the frequently observed underestimation of Al from the MD simulations is surprising (see Fig. 1). We have no explanation for these effects but refer to Jaworski et al.25 for further discussions.
 as obtained from MD simulations (black symbols) and
 ![[R with combining macron]](https://www.rsc.org/images/entities/i_char_0052_0304.gif) α–β), as well as the R-value where gα–β(Rα–β) is maximized (Rmaxα–β). Here we focus on the various cation–oxygen distances.
α–β), as well as the R-value where gα–β(Rα–β) is maximized (Rmaxα–β). Here we focus on the various cation–oxygen distances.
 | ||
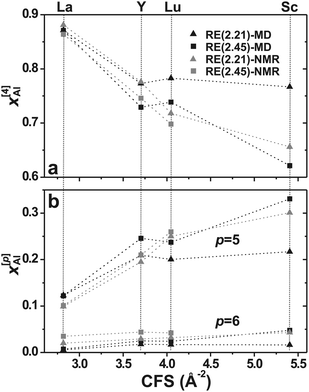
| Fig. 2 RDFs of the (a) Si–O, (b) Al–O, (c) RE–O, and (d) O–O pairs for each of the RE(2.21) glasses with RE = {La, Y, Lu, Sc}, the identity of which is identified by the legend in (a). | ||
| Pair α–β (R) |
R
cut/pmb |
RE(2.21) | RE(2.45) | ||||||||
|---|---|---|---|---|---|---|---|---|---|---|---|
| La | Y | Yc | Lu | Sc | La | Y | Yc | Lu | Sc | ||
a The distances Rmaxα–β (in pm) and bond angles θmaxα–β–γ (in degrees) were estimated from the maximum of the radial distribution function (RDF) and the angular distribution function (ADF), respectively. The corresponding average distance (α–β) or bond angle (![[small theta, Greek, macron]](https://www.rsc.org/images/entities/i_char_e0c9.gif) α–β–γ) over each respective distribution is given within parentheses.
b The cutoff distance Rcut corresponds to the first minimum of the RDF, which varied depending on the RE3+ cation identity {La, Y, Lu, Sc} as follows: {315, 303, 289, 275} pm for the RE–O pair; {434, 415, 405, 395} pm for Si–RE; {465, 434, 425, 400} pm for Al–RE and {495, 480, 465, 430} pm for RE–RE.
c Results obtained by the potential parameters of Du.26 α–β–γ) over each respective distribution is given within parentheses.
b The cutoff distance Rcut corresponds to the first minimum of the RDF, which varied depending on the RE3+ cation identity {La, Y, Lu, Sc} as follows: {315, 303, 289, 275} pm for the RE–O pair; {434, 415, 405, 395} pm for Si–RE; {465, 434, 425, 400} pm for Al–RE and {495, 480, 465, 430} pm for RE–RE.
c Results obtained by the potential parameters of Du.26
|
|||||||||||
| O–O | 395 | 260.3(310.0) | 260.7(309.1) | 261.1(308.9) | 260.5(309.1) | 260.9(309.0) | 260.3(312.0) | 261.1(310.1) | 262.1(309.7) | 261.1(309.9) | 261.3(308.5) |
| Si–O | 250 | 159.3(160.1) | 159.3(160.2) | 159.1(160.3) | 159.3(160.2) | 159.1(160.2) | 159.3(160.0) | 159.1(160.1) | 159.1(160.2) | 159.1(160.1) | 158.9(160.1) |
| Al–O | 250 | 176.7(180.3) | 176.9(181.9) | 176.9(181.8) | 176.9(181.9) | 176.9(182.1) | 176.5(180.5) | 177.1(182.3) | 176.9(182.6) | 176.9(182.4) | 177.5(183.6) |
| Al[4]–O | 250 | 175.9(178.3) | 175.9(178.3) | 175.6(178.6) | 175.9(178.4) | 175.6(178.5) | 176.1(178.0) | 176.1(178.0) | 175.9(178.2) | 175.9(178.1) | 175.6(178.1) |
| Al[5]–O | 250 | 179.9(190.9) | 179.9(190.3) | 179.6(190.8) | 179.9(190.5) | 179.6(190.4) | 180.9(190.6) | 180.9(190.0) | 180.9(190.2) | 179.6(190.0) | 180.1(189.6) |
| Al[6]–O | 250 | 185.6(199.5) | 181.9(198.8) | 186.1(199.4) | 182.4(198.4) | 182.9(198.5) | 181.6(200.2) | 184.9(198.3) | 185.9(198.7) | 185.4(198.3) | 185.4(197.7) |
| RE–O | 234.3(250.9) | 224.3(239.6) | 228.9(240.9) | 216.3(229.3) | 204.9(217.6) | 233.7(249.7) | 224.7(238.9) | 228.9(240.3) | 216.5(228.8) | 205.5(217.9) | |
| Si–Si | 338 | 312.9(309.3) | 312.5(308.9) | 312.9(308.8) | 312.7(308.7) | 313.1(308.7) | 313.5(309.5) | 311.3(308.3) | 312.9(308.5) | 312.7(308.4) | 312.1(308.8) |
| Si–Al | 352 | 320.3(316.2) | 318.9(315.6) | 318.1(315.8) | 320.3(315.5) | 321.1(315.6) | 315.9(316.0) | 315.9(315.3) | 318.1(315.6) | 314.9(315.3) | 316.7(315.1) |
| Si–RE | 363.5(366.2) | 352.9(355.1) | 354.1(353.1) | 349.5(349.5) | 342.1(343.0) | 360.9(365.2) | 351.7(354.1) | 351.9(353.0) | 346.9(348.6) | 338.7(342.1) | |
| Al–Al | 370 | 314.7(317.6) | 315.1(316.9) | 314.3(317.5) | 312.9(316.4) | 315.5(315.8) | 315.1(318.6) | 314.7(317.1) | 313.9(318.4) | 313.1(316.7) | 314.9(316.0) |
| Al–RE | 359.5(370.3) | 352.5(356.1) | 313.3(354.5) | 343.8(349.3) | 338.7(339.1) | 360.5(370.3) | 350.5(356.1) | 356.7(354.9) | 346.7(349.7) | 338.7(338.7) | |
| RE–RE | 370.7(405.9) | 352.3(390.3) | 352.3(391.5) | 337.9(378.0) | 360.9(360.0) | 369.5(405.2) | 353.5(389.4) | 352.9(390.6) | 340.3(377.8) | 355.1(359.3) | |
| Triplet α–β–γ (θ) | |||||||||||
| O–Si–O | 108(109) | 108(109) | 108(109) | 109(109) | 108(109) | 108(109) | 108(109) | 108(109) | 108(109) | 108(109) | |
| O–Al–O | 105(109) | 104(108) | 103(108) | 104(108) | 105(108) | 105(109) | 103(108) | 102(108) | 103(108) | 101(108) | |
| Si–O–Si | 149(150) | 148(150) | 149(150) | 150(150) | 151(150) | 151(150) | 148(149) | 147(149) | 148(149) | 146(149) | |
| Si–O–Al | 131(138) | 131(136) | 129(137) | 129(136) | 128(136) | 132(138) | 129(135) | 129(135) | 128(135) | 127(133) | |
| Al–O–Al | 120(121) | 120(119) | 120(120) | 120(118) | 120(118) | 121(123) | 119(119) | 120(120) | 120(118) | 121(116) | |
Si4+ exhibits the highest CFS of all cations: it arranges well-ordered SiO4 environments, reflected in a sharp peak of the gSi–O(RSi–O) function [see Fig. 2(a)] and consequently essentially equal values of RmaxSi–O and Si–O, amounting to 159 pm and 160 pm, respectively (Table 3). These Si–O distances are independent of the RE3+ identity and display good agreement with the value RSi–O = (162 ± 3) pm reported in ref. 18 and 22 by deconvolution of X-ray and neutron diffraction data into Gaussian peaks for Si-rich and RE-poor (RE = La, Y, Sc) AS glasses.
The Al3+ ion that features the second largest CFS also manifests essentially identical RDF peak maxima ≈177 pm among the various RE-bearing glasses; see Fig. 2(b) and Table 3. However, for a given RE AS glass, minor differences are now observed between RmaxAl–O and Al–O: the latter values (180–184 pm) are slightly larger than their RmaxAl–O counterparts, with the Al–O–RmaxAl–O separation increasing together with the RE3+ CFS along the series La3+ < Y3+ < Lu3+ < Sc3+. This trend is expected from the concomitant population-elevations of the high-coordination (AlO5, AlO6) polyhedra and the accompanying lengthened Al[p]–O distances for increasing p; compare the Al[4]–O, Al[5]–O and Al[6]–O bond-lengths with their aggregate “Al–O” value in Table 3. The values RmaxAl–O ≈ 177 pm and Al–O ≈ 182 pm accord well with the experimental diffraction data of ref. 18 and 22 that yielded Al–O distances in the range 180–184 pm (±3 pm) for La, Y and Sc glasses.
We next consider the oxygen distances to the RE3+ species, i.e., the lowest field-strength cation in each glass structure. The first peak-maximum of the respective gRE–O(RRE–O) function [Fig. 2(c)] becomes more diffuse as the CFS decreases along the series Sc3+ > Lu3+ ≳ Y3+ > La3+. This translates both into progressively lengthened RE–O distances [from 218 pm for the Sc(2.21) structure to 251 pm for La(2.21)] and RmaxRE–O [205 pm for Sc(2.21) to 234 pm for La(2.21)] in Table 3, as well as into steadily increased RE–O–RmaxRE–Odifferences [from 13 pm for Sc(2.21) to 17 pm for La(2.21)] as the RE3+ CFS diminishes. The RmaxRE–O-values of Table 3 compare very well with their corresponding diffraction-derived data,18,22 where the latter values are stated within parentheses (or ranges of values in the case of several data-points): 234 pm (234–238 pm)18,22 for La; 224 pm (220–226 pm)18,22 for Y, and 205 pm (212 pm)18 for Sc. The largest discrepancy (≈3%) is observed for Sc, although it may partially originate from widely differing cation compositions between our Sc(2.21) glass and that analyzed by Sadiki et al.;18 the latter corresponds to r = 1.87, xAl/xSi = 0.58 and xSc ≈ 0.03 in our sample nomenclature. While both the Y–O interionic parameters derived herein and those of Du26 provide RmaxY–O values in good accordance with experimental diffraction data, slightly better predictions are observed from the present {ARE–O,ρRE–O} set. Experimental Lu–O bond-lengths are not reported from Lu–Al–Si–O glasses. Yet, as shown below in Section 4.2, our interionic Lu–O potential parameters provide excellent predictions of Lu–O-values and lattice-parameters for some crystalline Lu-bearing phases.
4.2 Crystalline model structures
The new RE–O potentials were further evaluated by energy minimizations at zero absolute temperature by applying the GULP program48 to the set of crystalline structures shown in Table 4; they correspond to the La2O3, Y2O3, Lu2O3, and Sc2O3 oxides, some RE-bearing aluminates (LaAlO3, Y3Al5O12, Lu3Al5O12, ScAlO3) and scandium disilicate (Sc2Si2O7). Each representative XRD-derived structural parameter-set (obtained from the inorganic crystal structure database49) was used as the initial input to the minimization procedure with the interionic potentials evaluated up to 2.0 nm. The space-group symmetry of each structure was preserved throughout.| Oxide | a/pm | b/pm | c/pm | V/nm−3 |
RE–O/pmb |
|---|---|---|---|---|---|
|
a Results of using the interionic potential parameters of Table 1 in lattice-energy calculations that assumed fixed (α, β, γ) unit-cell angles, and leading to the calculated (Calc.) cell dimensions (a, b, c) and volume (V). Values within parentheses represent relative deviations from the XRD-derived experimental (Exp) data.
b Average RE–O distance, except for the data on α-quartz and α-Al2O3 that reports Si–O and Al–O, respectively.
c Obtained from the Y–O potential parameters of Du.26
d The β-value was optimized to β = 104.08°, which may be compared with the XRD-derived result of β = 102.77°.
e Obtained by using the Si–O or Al–O potential parameters of ref. 26, 40 and 41 (see Table 1).
|
|||||
| La2O3 (γ = 120°) | |||||
| Exp60 | 393.8 | — | 613.6 | 0.0824 | 253.5 |
| Calc. | 382.5 (−2.9%) | — | 603.2 (−1.7%) | 0.0764 (−7.3%) | 247.5 (−2.4%) |
| LaAlO3 (γ = 120°) | |||||
| Exp61 | 536.5 | — | 1311.0 | 0.3268 | 268.2 |
| Calc. | 537.0 (0.09%) | — | 1309.2 (−0.14%) | 0.3270 (0.05%) | 269.1 (0.34%) |
| Y2O3 | |||||
| Exp62 | 1060.7 | — | — | 1.1935 | 228.6 |
| Calc. | 1060.3 (−0.04%) | — | — | 1.1921 (−0.11%) | 228.4 (−0.09%) |
| Calc.c | 1059.3 (−0.13%) | — | — | 1.1887 (−0.40%) | 228.1 (−0.22%) |
| Y3Al5O12 | |||||
| Exp63 | 1200.6 | — | — | 1.7307 | 237.7 |
| Calc. | 1208.4 (0.65%) | — | — | 1.7645 (2.0%) | 239.7 (0.84%) |
| Calc.c | 1201.5 (0.07%) | — | — | 1.7344 (0.22%) | 237.8 (0.04%) |
| Lu2O3 | |||||
| Exp64 | 1039.1 | — | — | 1.1220 | 223.6 |
| Calc. | 1032.3 (−0.65%) | — | — | 1.1001 (−2.0%) | 222.5 (−0.49%) |
| Lu3Al5O12 | |||||
| Exp65 | 1190.6 | — | — | 1.6877 | 233.0 |
| Calc. | 1199.4 (0.74%) | — | — | 1.7256 (2.2%) | 236.8 (1.6%) |
| Sc2O3 | |||||
| Exp66 | 984.9 | — | — | 0.9554 | 212.1 |
| Calc. | 1002.7 (1.8%) | — | — | 1.0082 (5.5%) | 216.4 (2.0%) |
| ScAlO3 | |||||
| Exp67 | 493.7 | 523.2 | 720.5 | 0.1861 | 226.8 |
| Calc. | 504.0 (2.1%) | 526.0 (0.54%) | 742.7 (3.1%) | 0.1969 (5.8%) | 232.8 (2.7%) |
Sc2Si2O7![[thin space (1/6-em)]](https://www.rsc.org/images/entities/b_char_2009.gif)
|
|||||
| Exp68 | 650.3 | 849.8 | 468.2 | 0.2523 | 212.4 |
| Calc. | 658.2 (1.2%) | 851.1 (0.15%) | 482.1 (3.0%) | 0.2619 (3.8%) | 219.0 (3.1%) |
| α-SiO2 (γ = 120°) | |||||
| Exp69 | 490.2 | — | 540.0 | 0.1124 | 161.3 |
| Calc.e | 493.1 (0.59%) | — | 544.2 (0.78%) | 0.1146 (2.0%) | 158.9 (−1.5%) |
| BKS34 | 494.0 (0.78%) | — | 544.8 (0.89%) | 0.1151 (2.5%) | 160.1 (−0.74%) |
| CHIK51 | 504.5 (2.9%) | — | 552.0 (2.2%) | 0.1217 (8.3%) | 161.8 (0.31%) |
| α-Al2O3 (γ = 120°) | |||||
| Exp70 | 476.0 | — | 1299.6 | 0.2551 | 191.3 |
| Calc.e | 476.7 (0.15%) | — | 1316.2 (1.3%) | 0.2591 (1.6%) | 192.5 (0.63%) |
The resulting lattice parameters (a, b, c), cell volume (V) and average RE–O distance (RE–O) within the unit cell are listed in Table 4 and compared with their experimental counterparts obtained using single crystal XRD. An acceptable agreement is observed: the relative deviations among the (a, b, c) parameters and the volume of the unit cell generally stay below 2% and 4%, respectively. For both the RE2O3 and aluminate structures, the data derived from the new Y–O and Lu–O potential parameters accord very well with their experimental counterparts, where the largest discrepancies in the cell-lengths, volumes and average RE–O distances amount to 0.8%, 2.2% and 1.6%, respectively, while the agreement is overall significantly lower for La and Sc. Table 4 also compares the results of using the Y–O interionic potential parameters of Du et al.26 with those derived herein. Overall, the two options display comparable qualities in their structural predictions; the present {AY–O,ρY–O} parameters perform favorably for the case of Y2O3, whereas those of ref. 26 give better agreement with the experimental lattice parameters of Y3Al5O12.
The La–O and Sc–O interionic potentials offer the weakest predictability. While the LaAlO3 lattice parameters calculated by the new La–O potential give excellent agreement with the experimental data (Table 4), the globally largest discrepancy among all structures is observed for La2O3, for which the calculated values of V and La–O are underestimated by 7.3% and 2.4%, respectively. However, the three Sc-bearing structures manifest the overall weakest agreement between calculated and experimental lattice parameters, where discrepancies over the ranges of 1.2–2.1%, 3.8–5.8% and 2.0–3.1% are observed for the values of (a, b, c), V, and Sc–O, respectively.
Nevertheless, our new RE–O potential parameters that were optimized directly on amorphous phases, display a good transferability to crystalline structures, except for La2O3 and the Sc-based phases. For instance, the observed deviations between calculated and experimental data are not substantially larger than the analogous results of Pedone et al.50 obtained by a Morse-based potential that was optimized directly on crystalline oxides and subsequently evaluated on several multicomponent structures. Table 4 also verifies acceptable values of the energy-minimized lattice parameters of α-quartz and α-Al2O3, which originated from solely employing the O–O, Si–O, and Al–O interionic parameters of Du and Cormack26,40,41 (see Table 1); hence, the validity of our RE–O Born–Mayer parameters is confirmed by the comparable quality in the structural predictability observed both in their presence and absence. Moreover, the herein utilized Si–O and O–O parameters from ref. 40 and 41 compare favorably with the Beest–Kramer–Santen34 (BKS) and Carré–Horbach–Ispas–Kob51 (CHIK) potentials when evaluated for the case of α-SiO2 (see Table 4).
5 Cation field-strength effects on RE2O3–Al2O3–SiO2 glass structures
5.1 Rare-earth coordinations
Fig. 3(a) plots the average number of oxygen species coordinated by each RE3+ ion (RE) against its corresponding Shannon–Prewitt radius,42 the latter value relevant for REO6 groups. Indeed, all MD-derived mean coordination numbers scatter around RE ∼ 6; they elevate either for increasing RE3+ radius (i.e., decreasing CFS) or for growing r-value of the glass. The latter observation may be rationalized from the dependence of RE on the glass composition, where both RE and Al increases for decreasing silica content (i.e., increasing xRE), as demonstrated in ref. 16 and 25. Table 2 verifies our claimed correlation between RE and Al for the present glasses.
![(a) MD-derived average RE3+ coordination numbers (Z̄RE) plotted against the respective Shannon–Prewitt ionic radius (assuming sixfold coordinations) for each RE(2.21) and RE(2.45) series. (b and c) Fractional populations x[p]RE plotted versus the coordination number p for the (b) RE(2.21) and (c) RE(2.45) series of glasses.](/image/article/2013/CP/c3cp51726h/c3cp51726h-f3.gif) | ||
| Fig. 3 (a) MD-derived average RE3+ coordination numbers (RE) plotted against the respective Shannon–Prewitt ionic radius (assuming sixfold coordinations) for each RE(2.21) and RE(2.45) series. (b and c) Fractional populations x[p]RE plotted versus the coordination number p for the (b) RE(2.21) and (c) RE(2.45) series of glasses. | ||
The underlying distribution of RE[p] populations (x[p]RE) are conveyed by Fig. 3(b) and (c) for the RE(2.21) and RE(2.45) series. Coordination numbers are observed in the range 4 ≤ p ≤ 8, although the fourfold and eightfold populations are only significant for the smallest (Sc3+) and largest (La3+) cations, respectively. Except for Sc3+ ions that primarily form ScO5 polyhedra, p = 6 coordinations dominate the {RE[p]} distributions of the RE3+ cations, where REO7 polyhedra constitute the second most abundant species for La3+ and Y3+, whereas >30% of the (small) Lu3+ cations assume fivefold coordinations. The MD-modeled RE-values around six accord semi-quantitatively with the X-ray absorption spectroscopy results of RE = 6 ± 0.5 observed throughout the lanthanide-ion series when RE3+ is present in a low amount (5 wt% RE2O3) in a Na2Si2O5 based glass,52 as well as with several MD reports on RE-bearing (alumino)silicate glasses.6,7,26–28
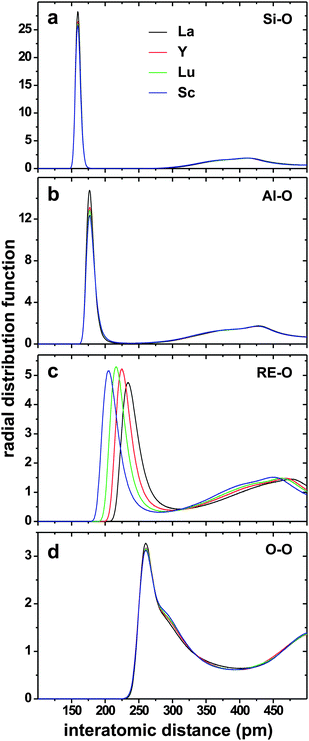
Interestingly, the calculations predict significant fractions 0.09 ≤ x[4]Sc ≤ 0.17, suggesting that Sc3+ might partially assume a glass-network forming role in the guise of ScO4 groups, as reported previously for the similarly-sized Mg2+ ion.53–55Fig. 4(a) displays a typical Sc[4] environment in the Sc(2.21) glass. The potential network-forming capability of Sc requires further experimental studies, but may constitute the origin of previously reported anomalies in 29Si NMR shifts and unexpectedly low glass transition temperatures observed from Sc AS glasses.15,17
 | ||
| Fig. 4 Some typical fragments in the MD-derived glass structures. (a) A ScO4 tetrahedron (O atoms of which are set in black) in relation to the aluminosilicate network. (b) A SiO4 tetrahedron accommodating one NBO ion and sharing corners with each of a SiO4, AlO4 and AlO5 group. (c) A “tricluster moiety” featuring an AlO6 polyhedron connected to SiO4 and AlO4 groups via corner and edge-sharing, respectively. | ||
5.2 Oxygen environments
The MD-predicted non-negligible amounts of O[0] (“free O2− ion”) and significant O[3] (“oxygen tricluster”) moieties in the present (as well as previously reported16,25–27) RE AS glasses that involve high-CFS trivalent modifier ions is the primary distinction between their corresponding O speciations in mono- or di-valent based glasses of otherwise comparable compositions; compare for instance our results with previous modeled data from Ca AS glasses.57,58 Whereas both the O[0] and O[3] populations grow slightly as the RE3+ CFS increases, they also depend on the RE3+content, with x[0]O increasing and x[3]O decreasing as the r-value of the glass elevates from 2.21 to 2.45, as revealed in Fig. 5. The minor growth of the O[0] populations for an increase in either the CFS or amount of the RE3+ ions suggests an enhanced RE–O–RE association.
![Fractional populations of O[p] species with (a) p = 0, (b) p = 3, and (c and d) p = 2, plotted against the RE3+ CFS for the as-indicated RE(2.21) and RE(2.45) series of glasses. Note that whereas the lower and upper values vary among the plots in (a–d), their spans of vertical ranges are equal throughout. Grey lines represent best fits.](/image/article/2013/CP/c3cp51726h/c3cp51726h-f5.gif) | ||
| Fig. 5 Fractional populations of O[p] species with (a) p = 0, (b) p = 3, and (c and d) p = 2, plotted against the RE3+ CFS for the as-indicated RE(2.21) and RE(2.45) series of glasses. Note that whereas the lower and upper values vary among the plots in (a–d), their spans of vertical ranges are equal throughout. Grey lines represent best fits. | ||
While the abundance of free O2− ions depends solely on the nature and amount of the glass modifiers, the O[3] population is additionally dictated by the nAl/nSi ratio of the glass composition.16,25 The O[3] sites predominantly connect Al-centered polyhedra, notably so high-coordination AlO5 and AlO6 groups (see Section 5.2.2). Because the latter populations grow together with both xAl and the RE3+ CFS,16,25 the highest x[3]O-values (≳0.15) are observed for high-CFS Al-rich glasses associated with relatively low values of r ≲ 2.21, whereas x[3]O stay consistently below 0.10 in La–Al–Si–O structures.25 These trends may be verified from our previous reports on glasses featuring variable RE:Al:Si contents within each La,25 Y,16 and Lu16 system. Fig. 5(b)–(d) reveal that the O[3] moieties grow largely at the expense of their O[2] counterparts. Further, for a fixed RE:Al:Si stoichiometric ratio, Table 2 verifies a strong correlation between (i) Al, which elevates concurrently with x[5]Al, as the AlO6 population remains low throughout all glass structures; (ii) O and (iii) x[3]O, all of which increase with the RE3+ CFS. However, whereas the Al/O/x[3]O correlations are evident within both RE AS r-branches, their concomitant elevations with the CFS is only transparent along the RE(2.45) series.
Si exhibits the least preference for any particular O[p] coordination, meaning that the relative number of Si–O[p] bonds roughly reflect each respective x[p]O-value in Table 2. Conversely, RE–O[1] contacts are strongly preferred over their RE–O[2] counterparts, approximately by a factor of 3 compared to the predictions from a statistical intermixing based on the x[1]O/x[2]O ratio. Fig. 6 plots the various RE–O[p] populations. The relative preferences among the various cations to coordinate the less abundant O[1] and O[3] species constitute their main distinctions: the affinity for X–O[1] bond formation decreases along the series
| RE(10) ≫ Si(4) > Al[4](2) > Al[5] ≳ Al[6](1), | (6) |
:3:5:7–10 for Si:Al[4]:Al[5]:Al[6]. As expected from bond-valence sums, O[3] moieties coordinate at most one Si atom and up to three Al[p] species, where generally at least one is a high-coordination AlO5/AlO6 polyhedron, as illustrated in Fig. 4(c). The strong preference for Al[p]–O[3] linkages implies a slight Al–Al self-association across the structure, as also noted previously by Christie and Tilocca.27
![Variation of the RE–O[p] fractional populations associated with (a) p = 0 or (b) p = 1 and p = 2 for each as-indicated series of RE(2.21) and RE(2.45) glasses. Solid and open symbols in (b) represent data for RE–O[1] and RE–O[2] contacts, respectively. Grey lines represent best-fit data.](/image/article/2013/CP/c3cp51726h/c3cp51726h-f6.gif) | ||
| Fig. 6 Variation of the RE–O[p] fractional populations associated with (a) p = 0 or (b) p = 1 and p = 2 for each as-indicated series of RE(2.21) and RE(2.45) glasses. Solid and open symbols in (b) represent data for RE–O[1] and RE–O[2] contacts, respectively. Grey lines represent best-fit data. | ||
Despite the ability of Si and Al[p] to accommodate each O[p] species being independent of the nature of the RE element in the glass, the corresponding abundance of each cation–oxygen contact scales with the relative {x[1]O, x[2]O, x[3]O} values, where the x[2]O/x[3]O ratio is dictated both by the RE3+ CFS and content, as highlighted above.
We next focus on the various Si, Al, and RE cation constellations around each O[p] site, denoted here as O[p][q], where q represents the total coordination number when also accounting for the q–p RE–O contacts. For both the O[1][q] and O[2][q] environments, the net coordination number q ranges between 2 and 4, implying that each O atom coordinates 0, 1, or 2 RE3+ cations. In contrast, the free O2− anions predominantly coordinate 3 (major contribution; 50–80%) or 4 (minor; 10–50%) RE species, where the abundance of the latter grows for increasing RE3+ content (xRE), but diminishes markedly across each RE(r) series as the CFS increases. For instance, O[0][4] groups constitute ≈50% and ≈20% of the O[0] speciation in the La(2.45) and Sc(2.45) structures, respectively. The O[3] moieties predominantly constitute O[3][3] groups devoid of linkages to any RE3+ species, with the O[3][4] population amounting to 5–12% and 10–18% for the RE(2.21) and RE(2.45) series, respectively.
The NBO environments are dominated by O[1][2] constellations involving Si and RE, as well as O[1][3] sites where O coordinates two RE cations together with either of Si or Al[p]. The O[1][3] species represent altogether 60–70% of the entire O[1] population. The relative abundance of each O[1][3]–Si/Al[p] moiety is reflected by the relevant fractional population of the cation species (see Table 2), weighted by the respective affinity for X–NBO bond formation given by eqn (6). Furthermore, there are minor contributions from numerous distinct O[1][4] structural fragments, in total representing 3–18% of the total O[1] speciation. For increasing RE3+ CFS, the q = 2 populations grow and those of q = 4 diminish, while the reverse trends are observed when the RE3+ content elevates from xRE = 0.24 [RE(2.21)] to xRE = 0.32 [RE(2.45)].
The same general CFS/xRE trends are observed in the number of O[2]–RE contacts; the O[2][4] moieties remain ≲10% throughout all structures, whereas the lower formal charge of the O[2] atoms relative to their O[1] counterparts implies overall higher O[2][2] contributions, dominated by Si–O[2]–Si and Si–O[2]–Al[4] fragments. Most Si–O[2]–Si bridges constitute O[2][2] groups devoid of contacts with RE3+. Conversely, roughly equal amounts of O[2][2] and O[2][3] motifs contribute to the overall dominating Si–O[2]–Al[4] linkages. The O[2][3] species involve O[2] coordinated by one RE3+ cation together with any two members of the set {Si, Al[4], Al[5], Al[6]}. As expected from the accumulated negative charges associated with Al[4]–O[2]–Al[4] bridges,56 all such motifs require one RE3+ cation for stabilization, reflected in their sole presence as O[2][3] (as opposed to O[2][2]) groups. O[2][3] moieties are also encountered for the majority of all interpolyhedral bonds involving either of AlO5 or AlO6, such as Si–O[2]–Al[5]/Al[6] and Al[4]–O[2]–Al[5]/Al[6] bridges. Generally, the amounts of the various O[2][3] groups involving Si–O–Al[p] and Al[p]–O–Al[q] linkages with (p, q) = (4, 5, 6) roughly obey a statistical partitioning based on the products between the relative fractions {xSi, xAlx[p]Al} associated with each pair of Si/Al[p] species, as discussed in detail below. Throughout all glass structures, ≈75–80% of all O[2] sites constitute O[2][2](Si, Si), O[2][2](Si, Al[4]), O[2][3](Si, Al[4]), O[2][3](Al[4], Al[4]) and O[2][3](Si, Al[5]) moieties, where the two interlinked cations are indicated within parentheses.
5.3 SiO4–AlOp and AlOp–AlOq interpolyhedral connectivities
The various SiO4/AlOp polyhedra manifest a non-preferential intermixing, leading to an MD-derived fractional population x(X–Y) of an XOp–YOq pair that is well-approximated by its corresponding product
 | (7) |
![Fractional populations of the SiO4–SiO4, SiO4–AlO4, SiO4–AlO5, AlO4–AlO4, AlO4–AlO5, and AlO5–AlO5 interpolyhedral pairs encountered in each (a) RE(2.21) and (b) RE(2.45) glass structure. Each Al[p] coordination is for brevity labeled by its respective integer “p”. Data are not shown for pairs involving AlO6 groups as their populations remain <5% throughout.](/image/article/2013/CP/c3cp51726h/c3cp51726h-f7.gif) | ||
| Fig. 7 Fractional populations of the SiO4–SiO4, SiO4–AlO4, SiO4–AlO5, AlO4–AlO4, AlO4–AlO5, and AlO5–AlO5 interpolyhedral pairs encountered in each (a) RE(2.21) and (b) RE(2.45) glass structure. Each Al[p] coordination is for brevity labeled by its respective integer “p”. Data are not shown for pairs involving AlO6 groups as their populations remain <5% throughout. | ||
We verified that the modeled x(X–Y) fractions closely obey a statistical intermixing, where the deviations between the MD-derived values and the predictions from eqn (7) are readily explained by the relative preference of each {SiO4, AlOp} polyhedral type to accommodate NBO ions [see eqn (6)]: the comparatively most abundant Si–NBO bond formation leads consistently to somewhat lower x(Si–Si) populations relative to those predicted by eqn (7), whereas the reluctance of the AlOp groups to accommodate NBO ions implies the opposite trend for the x(Al[p]–Al[q]) values. In the context of La2O3–Al2O3–SiO2 glasses, a pronounced Si–Al disorder was verified experimentally for SiO4–AlO4 [ref. 24] and AlOp–AlOq [ref. 25] contacts, in the latter case by a direct connectivity-probing of the various AlOp–AlOq pairs by double-quantum 27Al NMR spectroscopy.59
![Fraction of bridging oxygen species participating in edge-shared SiO4/AlOp polyhedra, plotted against the RE3+ CFS and considering (a) the total BO speciation (i.e., sum over O[2] and O[3]), or solely each individual (b) O[2] and (c) O[3] population.](/image/article/2013/CP/c3cp51726h/c3cp51726h-f8.gif) | ||
| Fig. 8 Fraction of bridging oxygen species participating in edge-shared SiO4/AlOp polyhedra, plotted against the RE3+ CFS and considering (a) the total BO speciation (i.e., sum over O[2] and O[3]), or solely each individual (b) O[2] and (c) O[3] population. | ||
Striking differences further emerge when comparing the preferences among the various {SiO4, AlO4, AlO5, AlO6} groups to connect through corners or edges: the strong tendency of O[3] moieties to interlink the cations by edge-sharing, coupled with the inherently distinct affinities of the cations to form X–O[3] bonds, implies that the participation in edge-shared polyhedra grows along the series Si ≲ Al[4] ≪ Al[5] < Al[6]. Altogether, the net abundance of edge-shared XOp–YOq polyhedra scales roughly as
| Si–Si(0%) ≈ Si–Al[4](<1%) < Al[4]–Al[4](<3%) < Si–Al[5](≈5%) < Si–Al[6](≈10%) < Al[4]–Al[5](10–20%) < Al[4]–Al[6](20–25%) ≪ Al[5]–Al[5](≈50%) < Al[5]–Al[6](60–70%) < Al[6]–Al[6](≳75%), | (8) |
Edge-shared XOp–YOq polyhedra translate into bond-angles θX–O–Y ≈ 90° that may be compared with their wider corner-shared analogs peaking in the ranges of 110–130° for Al–O–Al/Si and 140–160° for Si–O–Si linkages (see Table 3). Hence, the abundance of edge-shared polyhedra may also be inspected from the plots of the MD-derived angle-distribution functions (ADFs) shown in Fig. 9 for each type of Si–O[p]–Si, Si–O[p]–Al and Al–O[p]–Al contact. The ADF amplitudes of the latter indeed increases markedly around θAl–O–Al = 90°, which is most transparent for the structures involving Sc (and Lu; not shown) that exhibit the largest AlO5/AlO6 populations and thereby the highest extent of edge-sharing.
![(a) Si–O–Si, (b) Si–O–Al and (c) Al–O–Al bond-angle (θX–O–Y) distributions for the La(2.45) (left panel) and Sc(2.45) (right) glass structures. “Al” represents the entire {Al[4], Al[5], Al[6]} speciation. Grey and dotted traces reveal the respective θ(X–O[3]–Y) and θ(X–O[2]–Y) contributions (where {X, Y} = {Si, Al}) to the total ADF (black trace).](/image/article/2013/CP/c3cp51726h/c3cp51726h-f9.gif) | ||
| Fig. 9 (a) Si–O–Si, (b) Si–O–Al and (c) Al–O–Al bond-angle (θX–O–Y) distributions for the La(2.45) (left panel) and Sc(2.45) (right) glass structures. “Al” represents the entire {Al[4], Al[5], Al[6]} speciation. Grey and dotted traces reveal the respective θ(X–O[3]–Y) and θ(X–O[2]–Y) contributions (where {X, Y} = {Si, Al}) to the total ADF (black trace). | ||
6 Concluding remarks
New RE–O interatomic potential parameters were optimized for RE = {La, Y, Lu, Sc} by a force-matching procedure30 involving ab initio derived forces in MD-generated RE–Al–Si–O glass structures. Overall they performed well both for reproducing diffraction-derived lattice parameters of crystalline RE-bearing oxide/aluminate structures, as well as short-range features in RE AS glasses, such as previously reported RE–O distances18,22 and {Al[4], Al[5], Al[6]} speciations.16,17,25 These self-consistent RE–O potential parameters are expected to be useful for exploring the structures of other amorphous as well as well-ordered RE-bearing oxide-based structures.The MD-derived average Al coordination numbers (Al) typically reproduce their experimental counterparts within <2% deviation, with the largest discrepancy (3.5%) observed for the Sc(2.21) glass. Whereas Sc3+ mainly assumes Sc[5] coordinations and non-negligible amounts of Sc[4] species (up to ≈20%), all other (larger) RE3+ ions reveal {RE[p]} speciations peaked at p = 6, with La[7] and Lu[5] constituting the second most abundant coordinations for La3+ and Lu3+, respectively. The simulated structures exhibit essentially randomized connectivities among the various SiO4 and AlOp (p = 4, 5, 6) network (associated) polyhedra, a feature attributed to the high charge of the trivalent RE3+ ions, whose comparatively strong RE3+–O bonds (relative to their M+–O and M2+–O counterparts) perturb any Si/Al ordering and also promote otherwise energetically disfavored structural motifs,56 such as free O2− ions, Al[4]–O–Al[4] bridges, and Al–O[1] contacts. These trends are primarily reflected by the following structural alterations when the RE3+ CFS increases along the series La3+ < Y3+ < Lu3+ < Sc3+:
(i) An increase in the minor but non-negligible populations of free O2− ions (<3.5%) is observed, suggesting a stronger RE–O–RE self-association, where each O[0] site coordinates 3 or 4 RE3+ cations. The x[0]O values also increase with the RE3+ content.
(ii) Each of Al and O increases by elevating Al[5] and O[3] populations, respectively, at the expense of the dominating Al[4] and O[2] counterparts.
(iii) Whereas >85% of all SiO4 and AlOp polyhedra connect through corners, the degree of edge-sharing increases steadily from ≈5% in the La-based glasses to ≈15% in the Sc analogs. Owing to the strong affinity for Al[5]–O[3] and Al[6]–O[3] bond formation combined with the pronounced tendency of O[3] moieties to create edge-sharing, large fractions of all AlO5 and AlO6 linkages to other groups occur via edge-sharing.
Altogether, the structures of RE2O3–Al2O3–SiO2 glasses exhibit a pronounced disorder both in their distributions of O[p], Al[p] and RE[p] coordinations and how the various structural motifs combine. Effectively, (i) and (ii) imply partial O[1] → O[0] and O[2] → O[3] net conversions as the RE3+ CFS grows, thereby amounting in more complex O[p] speciations compared with the sole presence of O[1] and O[2] moieties expected from traditional theories of glass structures.56
The present study corroborates and reinforces previous experimental and computational findings that the structures of RE2O3–Al2O3–SiO2 glasses are strongly influenced by the RE3+ CFS over both short and medium ranges.12–18,24–28 The large CFS-span across the set {La3+, Y3+, Lu3+, Sc3+}, coupled with the overall monotonic (and occasionally approximately linear; see Fig. 5 and 6) trends of several structural features against the field-strength, suggest the possibility of roughly assessing the corresponding feature in another RE–Al–Si–O glass that exhibits a similar cation composition but a distinct RE3+ ion, based on its CFS-value relative to those considered herein.
Acknowledgements
This work was supported by the Swedish Research Council (contract VR-NT 2010-4943) and the Faculty of Sciences at Stockholm University. We thank Jekabs Grins and Alexander Lyubartsev for discussions.References
- V. McGahay and M. Tomozawa, J. Non-Cryst. Solids, 1993, 159, 246–252 CrossRef CAS.
- N. D. Afify and G. Mountjoy, Phys. Rev. B: Condens. Matter Mater. Phys., 2009, 79, 024202 CrossRef.
- J. Coon and J. E. Shelby, Phys. Chem. Glasses, 1994, 35, 47–51 CAS.
- J. E. Shelby, Key Eng. Mater., 1994, 94–95, 43–80 CrossRef CAS.
- T. Schaller, J. F. Stebbins and M. C. Wilding, J. Non-Cryst. Solids, 1999, 243, 146–157 CrossRef CAS.
- B. Park, H. Li and L. R. Corrales, J. Non-Cryst. Solids, 2002, 297, 220–238 CrossRef CAS.
- J. A. Johnson, C. J. Benmore, D. Holland, J. Du, B. Beuneu and A. Mekki, J. Phys.: Condens. Matter, 2011, 23, 065404 CrossRef CAS.
- A. Makishima, M. Kobayashi, T. Shimohria and T. Nagata, J. Am. Ceram. Soc., 1982, 65, C210–C211 CrossRef CAS.
- M. J. Hyatt and D. E. Day, J. Am. Ceram. Soc., 1987, 70, C283–C287 CrossRef.
- J. T. Kohli and J. E. Shelby, Phys. Chem. Glasses, 1991, 32, 67–71 CAS.
- S. Iftekhar, J. Grins and M. Edén, J. Non-Cryst. Solids, 2010, 356, 1043–1048 CrossRef CAS.
- J. T. Kohli, J. E. Shelby and J. S. Frye, Phys. Chem. Glasses, 1992, 33, 73–78 CAS.
- T. Schaller and J. F. Stebbins, J. Phys. Chem. B, 1998, 102, 10690–10697 CrossRef CAS.
- P. Florian, N. Sadiki, D. Massiot and J. P. Coutures, J. Phys. Chem. B, 2007, 111, 9747–9757 CrossRef CAS.
- S. Iftekhar, J. Grins, P. N. Gunawidjaja and M. Edén, J. Am. Ceram. Soc., 2011, 94, 2429–2435 CrossRef CAS.
- S. Iftekhar, B. Pahari, K. Okhotnikov, A. Jaworski, B. Stevensson, J. Grins and M. Edén, J. Phys. Chem. C, 2012, 116, 18394–18406 CAS.
- B. Pahari, S. Iftekhar, A. Jaworski, K. Okhotnikov, K. Jansson, B. Stevensson, J. Grins and M. Edén, J. Am. Ceram. Soc., 2012, 95, 2545–2553 CrossRef CAS.
- N. Sadiki, L. Hennet, P. Florian, Y. Vaills, D. Massiot and J.-P. Coutures, Mater. Tech., 2010, 98, 409–421 CrossRef CAS.
- P. J. Hayward, Radioactive Waste Forms for the Future, North-Holland, Amsterdam, 1988 Search PubMed.
- S. D. Chen, J. F. Hsieh, S. C. Tsai, W. Y. Lin, K. Y. Cheng and S. J. Wang, Nucl. Med. Commun., 2001, 22, 121–125 CrossRef CAS.
- B. Stevensson and M. Edén, J. Non-Cryst. Solids, 2013, 378, 163–167, DOI:10.1016/j.jnoncrystsol.2013.06.013.
- I. Pozdnyakova, N. Sadiki, L. Hennet, V. Cristiglio, A. Bytchkov, G. J. Cuello, J. P. Coutures and D. L. Price, J. Non-Cryst. Solids, 2008, 354, 2038–2044 CrossRef CAS.
- E. Leonova, A. S. Hakeem, K. Jansson, B. Stevensson, Z. Shen, J. Grins, S. Esmaeilzadeh and M. Edén, J. Non-Cryst. Solids, 2008, 354, 49–60 CrossRef CAS.
- S. Iftekhar, E. Leonova and M. Edén, J. Non-Cryst. Solids, 2009, 355, 2165–2174 CrossRef CAS.
- A. Jaworski, B. Stevensson, B. Pahari, K. Okhotnikov and M. Edén, Phys. Chem. Chem. Phys., 2012, 14, 15866–15878 RSC.
- J. Du, J. Am. Ceram. Soc., 2009, 92, 87–95 CrossRef CAS.
- J. K. Christie and A. Tilocca, Chem. Mater., 2010, 22, 3725–3734 CrossRef CAS.
- J. K. Christie and A. Tilocca, J. Phys. Chem. B, 2012, 116, 12614–12620 CrossRef CAS.
- M. Edén, J. Non-Cryst. Solids, 2011, 357, 1595–1602 CrossRef.
- F. Ercolessi and J. B. Adams, Europhys. Lett., 1994, 26, 583–588 CrossRef CAS.
- M. P. Allen and D. J. Tildesley, Computer Simulation of Liquids, Oxford, Clarendon, 1989 Search PubMed.
- W. Smith and T. R. Forester, J. Mol. Graphics, 1996, 14, 136–141 CrossRef CAS.
- I. T. Todorov, W. Smith, K. Trachenko and M. T. Dove, J. Mater. Chem., 2006, 16, 1911–1918 RSC.
- B. W. H. van Beest, H. J. Kramer and R. A. van Santen, Phys. Rev. Lett., 1990, 64, 1955–1958 CrossRef CAS.
- V. A. Bakaev and W. A. Steele, J. Chem. Phys., 1999, 111, 9803–9812 CrossRef CAS.
- R. H. Swendsen, Phys. Rev. Lett., 1979, 42, 859–861 CrossRef CAS.
- A. Lyubartsev and A. Laaksonen, Phys. Rev. E: Stat. Phys., Plasmas, Fluids, Relat. Interdiscip. Top., 1995, 52, 3730–3737 CrossRef CAS.
- E. Lomba and J. L. Lòpez-Martín, J. Chem. Phys., 1996, 104, 5244–5250 CrossRef CAS.
- K. W. Jacobsen, J. K. Nørskov and M. J. Puska, Phys. Rev. B: Condens. Matter Mater. Phys., 1987, 35, 7423–7442 CrossRef CAS.
- J. Du and A. N. Cormack, J. Am. Ceram. Soc., 2005, 88, 2532–2539 CrossRef CAS.
- J. Du and L. R. Corrales, J. Non-Cryst. Solids, 2007, 353, 210–214 CrossRef CAS.
- R. D. Shannon, Acta Crystallogr., Sect. A: Cryst. Phys., Diffr., Theor. Gen. Cryst., 1976, 32, 751–767 CrossRef.
- M. Petersen, Comput. Phys. Commun., 2000, 126, 294–309 CrossRef CAS.
- D. J. Singh and L. Nordstrom, Planewaves, Pseudopotentials and the LAPW Method, Springer-Verlag, Berlin, 2006 Search PubMed.
- J. P. Perdew, K. Burke and M. Ernzerhof, Phys. Rev. Lett., 1996, 77, 3865–3868 CrossRef CAS.
- P. Blaha, K. Schwarz, G. K. H. Madsen, D. Kvasnicka and J. Luitz, WIEN2k, An Augmented Plane Wave + Local Orbitals Program for Calculating Crystal Properties, Karlheinz Schwarz, Techn. Universität Wien, Wien, Austria, 2001.
- P. Pulay, Mol. Phys., 1969, 17, 197–204 CrossRef CAS.
- J. D. Gale and A. L. Rohl, Mol. Simul., 2003, 29, 291–341 CrossRef CAS.
- G. Bergerhoff and I. D. Brown, Crystallographic Databases, International Union of Crystallography, Chester, 1987 Search PubMed.
- A. Pedone, G. Malavasi, M. C. Menziani, A. N. Cormack and U. Segre, J. Phys. Chem. B, 2006, 110, 11780–11795 CrossRef CAS.
- A. Carré, J. Horbach, S. Ispas and W. Kob, Europhys. Lett., 2008, 82, 17001 CrossRef.
- M. R. Cicconi, G. Giuli, E. Paris, P. Courtial and D. B. Dingwell, J. Non-Cryst. Solids, 2013, 362, 162–168 CrossRef CAS.
- C. A. Angell, P. A. Cheeseman and R. R. Kadiyala, Chem. Geol., 1987, 62, 83–92 CrossRef CAS.
- M. Guignard and L. Cormier, Chem. Geol., 2008, 256, 111–118 CrossRef CAS.
- D. R. Neuville, L. Cormier, V. Montouillout, P. Florian, F. Millot, J.-C. Rifflet and D. Massiot, Am. Mineral., 2008, 93, 1721–1731 CrossRef CAS.
- M. Edén, Annu. Rep. Prog. Chem., Sect. C, 2012, 108, 177–221 RSC.
- L. Cormier, D. Ghaleb, D. R. Neuville, J.-M. Delaye and G. Calas, J. Non-Cryst. Solids, 2003, 332, 255–270 CrossRef CAS.
- A. Pedone, E. Gambuzzi, G. Malavasi and M. C. Menziani, Theor. Chem. Acc., 2012, 131, 1147 CrossRef.
- A. Y. H. Lo and M. Edén, Phys. Chem. Chem. Phys., 2008, 10, 6635–6644 RSC.
- P. Aldebert and J. P. Traverse, Mater. Res. Bull., 1979, 14, 303–323 CrossRef CAS.
- B. C. Chakoumakos, D. G. Schlom, M. Urbanik and J. Luine, J. Appl. Phys., 1998, 83, 1979–1982 CrossRef CAS.
- M. M Faucher and J. Pannetier, Acta Crystallogr., Sect. B: Struct. Crystallogr. Cryst. Chem., 1980, 36, 3209–3211 CrossRef.
- A. Nakatsuka, A. Yoshiasa and T. Yamanaka, Acta Crystallogr., Sect. B: Struct. Sci., 1999, 55, 266–272 CrossRef.
- F. Hanic, M. Hartmanová, G. G. Knab, A. A. Urusovskaya and K. S. Bagdasarov, Acta Crystallogr., Sect. B: Struct. Sci., 1984, 40, 76–82 CrossRef.
- F. Euler and J. A. Bruce, Acta Crystallogr., 1965, 19, 971–978 CrossRef CAS.
- A. Bartos, K. P. Lieb, M. Uhrmacher and D. Wiarda, Acta Crystallogr., Sect. B: Struct. Sci., 1993, 49, 165–169 CrossRef.
- R. J. Hill and I. Jackson, Phys. Chem. Miner., 1990, 17, 89–96 CrossRef CAS.
- Y. I. Smolin, Y. F. Shepelev and A. P. Titov, Kristallografiya, 1972, 17, 857–858 CAS.
- G. A. Lager, J. D. Jorgensen and F. J. Rotella, J. Appl. Phys., 1982, 53, 6751–6756 CrossRef CAS.
- L. Lutterotti and P. Scardi, J. Appl. Crystallogr., 1990, 23, 246–252 CrossRef CAS.
Footnote |
| † Electronic supplementary information (ESI) available. See DOI: 10.1039/c3cp51726h |
| This journal is © the Owner Societies 2013 |