 Open Access Article
 This Open Access Article is licensed under a
 Creative Commons Attribution 3.0 Unported Licence
Unraveling the internal dynamics of the benzene dimer: a combined theoretical and microwave spectroscopy study
Melanie
Schnell
*ab,
Undine
Erlekam
c,
P. R.
Bunker
cd,
Gert
von Helden
c,
Jens-Uwe
Grabow
e,
Gerard
Meijer
c and
Ad
van der Avoird
*cf
aCenter for Free-Electron Laser Science, Luruper Chaussee 149, D-22761 Hamburg, Germany
bMax-Planck-Institut für Kernphysik, Saupfercheckweg 1, D-69117 Heidelberg, Germany
cFritz-Haber-Institut der Max-Planck-Gesellschaft, Faradayweg 4-6, D-14195 Berlin, Germany
dNational Research Council of Canada, Ottawa, Ontario K1A 0R6, Canada
eInstitut für Physikalische Chemie und Elektrochemie, Gottfried Wilhelm Leibniz Universität Hannover, Callinstrasse 3-3a, D-30167 Hannover, Germany
fTheoretical Chemistry, Institute for Molecules and Materials, Radboud University Nijmegen, Heyendaalseweg 135, 6525 AJ Nijmegen, The Netherlands. E-mail: A.vanderAvoird@theochem.ru.nl
First published on 16th May 2013
Abstract
We report a combined theoretical and microwave spectroscopy study of the internal dynamics of the benzene dimer, a benchmark system for dispersion forces. Although the extensive ab initio calculations and experimental work on the equilibrium geometry of this dimer have converged to a tilted T-shaped structure, the rich internal dynamics due to low barriers for internal rotation have remained largely unexplored. We present new microwave spectroscopy data for both the normal (C6H6)2 and partially deuterated (C6D6)(C6H6) dimers. The splitting patterns obtained for both species are unraveled and understood using a reduced-dimensionality theoretical approach. The hindered sixfold rotation of the stem can explain the observed characteristic 1![[thin space (1/6-em)]](https://www.rsc.org/images/entities/char_2009.gif) :2:1 tunneling splitting pattern, but only the concerted stem rotation and tilt tunneling motion, accompanied by overall rotation of the dimer, yield the correct magnitude of the splittings and their strong dependence on the dimer angular momentum J that is essential to explain the experimental data. Also the surprising observation that the splittings are reduced by 30% for the mixed (C6D6)C(C6H6)S dimer in which only the cap (C) in the T-shaped structure is deuterated, while the rotating stem (S) monomer is the same as in the homodimer, is understood using this approach. Stark shift measurements allowed us to determine the dipole moment of the benzene dimer, μ = 0.58 ± 0.051 D. The assumption that this dipole moment is the vector sum of the dipole moments induced in the monomers by the electric field of the quadrupole on the other monomer yields a calculated value of μ = 0.63 D. Furthermore, the observed Stark behavior is typical for a symmetric top, another confirmation of our analysis.
:2:1 tunneling splitting pattern, but only the concerted stem rotation and tilt tunneling motion, accompanied by overall rotation of the dimer, yield the correct magnitude of the splittings and their strong dependence on the dimer angular momentum J that is essential to explain the experimental data. Also the surprising observation that the splittings are reduced by 30% for the mixed (C6D6)C(C6H6)S dimer in which only the cap (C) in the T-shaped structure is deuterated, while the rotating stem (S) monomer is the same as in the homodimer, is understood using this approach. Stark shift measurements allowed us to determine the dipole moment of the benzene dimer, μ = 0.58 ± 0.051 D. The assumption that this dipole moment is the vector sum of the dipole moments induced in the monomers by the electric field of the quadrupole on the other monomer yields a calculated value of μ = 0.63 D. Furthermore, the observed Stark behavior is typical for a symmetric top, another confirmation of our analysis.
I. Introduction
The benzene dimer, bound by dispersion forces, is a prototypical system in the study of the interactions between aromatic species that play an important role in biomolecular systems.1–6 It exhibits two competing equilibrium structures, a T-shaped one (edge-to-face arrangement) and a parallel-displaced one (stacked arrangement). The relative stability of such arrangements is important, for example, in determining the folding of proteins with aromatic residues and in protein–DNA interactions. Experimentally it was found in 1975 that the benzene dimer is polar,7 which suggests that its structure is T-shaped. Henson et al. concluded in 1992 based on their Raman spectroscopic study that the benzene dimer consists of two inequivalent monomers, one with low and the other with higher symmetry.8 Their findings are consistent with a T-shaped equilibrium geometry in which the benzene moiety at the top of the T, i.e., the cap, is more or less freely rotating about its C6 axis. In 1993, Arunan and Gutowsky investigated the rotational spectrum of the benzene dimer using Fourier transform microwave (FTMW) spectroscopy.9 Surprisingly, they observed the rotational spectrum of a prolate symmetric top with a quartet substructure that was tentatively ascribed to two independent internal motions, such as two opposed interconversion pathways. However, both the unexpected symmetric-top spectrum and the substructure are not understood to date.The benzene dimer is a floppy system with low barriers to internal rotation. Quantum mechanical tunneling can occur between various equivalent minima in the potential surface that are separated by these low barriers. Therefore, if one wants to understand the properties of the benzene dimer, compare with experimental data, and draw conclusions about related biomolecular systems,1–6 it is not sufficient to know only the equilibrium structure and the binding energy; its internal dynamics must be understood as well. The usual vibrational harmonic normal mode analysis fails in this case. Instead, one should use a treatment that properly accounts for the large amplitude internal motions. Moreover, the system is delocalized over many equivalent equilibrium structures (minima in the potential surface) and the point symmetry group that is commonly used for semi-rigid molecules refers only to a single equilibrium geometry. One-dimensional (1D) model studies of tunneling processes in the benzene dimer and a harmonic normal mode calculation of the intermolecular vibrations have been made by Špirko et al.10 Their 1D model invoked to explain the tunneling splittings observed in the FTMW spectrum9 suggests that these splittings must be assigned to the hindered rotation of the stem about its C6 axis, but cannot explain the observed magnitude of the splittings and their dependence on the total dimer angular momentum J.
In recent years, an ab initio global six-dimensional intermolecular potential surface has been developed for the benzene dimer.11,12 This potential was based on calculations using symmetry-adapted perturbation theory combined with density-functional theory for the monomers [SAPT(DFT)] and on coupled-cluster calculations including singles and doubles and perturbative triples [CCSD(T)]. The potential was used in computations of the bound levels12 with a quantum mechanical method suitable to treat large amplitude motions in weakly bound dimers.13–16 The method, successfully applied earlier to the ammonia dimer13 and the water dimer,16–22 includes all six fully coupled intermolecular degrees of freedom. The benzene dimer potential has 288 equivalent minima for a tilted T-shaped (TT) structure and 144 equivalent (slightly less deep) minima for a parallel-displaced (PD) geometry. Allowing for all internal rotation tunnelings, the permutation-inversion (PI) symmetry group that describes the symmetry of the bound states has 576 elements in this case; it is called G576.23,24 What made the calculations on the benzene dimer particularly demanding is that some of the barriers between the minima are very low and allow delocalization by tunneling between equivalent minima, whereas the barriers in other degrees of freedom are much higher so that the internal states are localized in these directions. This implies that the internal rotor basis used in the calculations had to be extremely large, in order to allow sufficient localization and converge the tunneling splittings.
The vibration–rotation–tunneling (VRT) levels of the benzene dimer were computed12 for all the 54 irreducible representations (irreps) of the group G576. Furthermore, to understand the nature of the calculated VRT states, we computed some of their properties and plotted various two-dimensional cuts of the six-dimensional global wave functions. A symmetry analysis provided the selection rules for allowed transitions and showed how the different VRT levels are related to different tunneling mechanisms and to the intermolecular vibrations. It was found, in agreement with all experimental evidence, that for all of the 54 G576 symmetry species (with different nuclear spin statistical weights) the lower VRT states correspond to the TT structure; states with the PD structure are higher in energy than the ground state of A1+ symmetry by at least 30 cm−1. The dissociation energy D0 equals 870 cm−1, while the depth De of the TT minimum in the potential is 975 cm−1. It was established that at least two large-amplitude motions occur: sixfold hindered rotation of the cap in the TT structure and tilt tunneling. Both tunneling mechanisms produce level splittings on the order of 1 cm−1. Also intermolecular vibrations with excitation energies starting at a few cm−1 were identified. Other motions, such as sixfold hindered stem rotation, cap turnover, and cap–stem interchange are hindered by much higher barriers in the potential. The tunneling splittings associated with these motions are so small that they could not be converged in the six-dimensional calculations, even with the largest basis sets that could be handled.
Here, we present new measurements of the microwave spectrum of the benzene dimer, first measured by Arunan and Gutowsky,9 with higher resolution and extended to the mixed (C6D6)C(C6H6)S dimer. The observed tunneling splittings are on the order of 60 kHz, which indeed is several orders of magnitude too small to be converged in the six-dimensional calculations of the VRT states. We construct a reduced dimensionality approach based on a two-dimensional (2D) cut of the same ab initio potential as used in the full six-dimensional (6D) calculations. This approach involves only the sixfold hindered stem rotation and tilt tunneling, and accounts for the coupling between these internal motions. Also the overall rotation of the complex is considered. As discussed below, Coriolis coupling between the overall rotation and the internal motions leads to an unexpectedly strong dependence of the tunneling splittings on the overall angular momentum J and its projection K on the intermolecular axis, which was crucial in explaining the observed spectrum. Furthermore, we performed Stark effect measurements to determine the dipole moment of the benzene dimer. A brief report of our results is given in ref. 25; the present paper gives a more complete description of the experiments and of our theoretical approach.
II. Experimental
The rotational spectra of (C6H6)2 and (C6D6)C(C6H6)S were recorded using the high-resolution FTMW spectrometer at the Leibniz-Universität Hannover26 (2 to 26.5 GHz) utilizing the coaxially oriented beam-resonator arrangement (COBRA).27 The experimental setup of the Hannover COBRA FTMW spectrometer is described in detail elsewhere.26,27 This spectrometer was specially developed to provide high sensitivity and resolution in the low-frequency region below 6 GHz, where the pure rotational transitions of larger and heavier molecules are located. It achieves line widths of about 1.5 kHz (HWHM) for neon as carrier gas, resulting in a resolution of about 4 kHz.C6H6 and C6D6 have been purchased from Sigma-Aldrich and used without further purification. Both are liquids at room temperature with boiling points of around 80 °C and melting points of around 6 °C. Because of their high vapor pressures, neon as carrier gas was directly flowed through a reservoir filled with pure C6H6 or with a 1:1 mixture of C6H6 and C6D6 followed by supersonic expansion through a pulsed nozzle (General Valve Series 9) with a 0.8 mm orifice into the microwave resonator. To reduce the partial pressure of benzene, the reservoir was cooled to −15 °C with a salt–ice mixture.
It was observed recently that by using neon as a carrier gas in a supersonic expansion of C6H6 and C6D6, only the mixed dimer (C6D6)C(C6H6)S is formed with C6D6 in the cap and C6H6 in the stem.28 This can be explained by a small difference of about 2 cm−1 between the zero point energies of (C6D6)C(C6H6)S and (C6H6)C(C6D6)S. With helium as carrier gas, however, both dimers are formed, since the binding energy of helium with benzene in the course of the supersonic expansion is not sufficient to overcome the interconversion barriers.28 We can use this to our advantage to selectively study the rotational spectrum of (C6D6)C(C6H6)S by using neon as carrier gas.
Stark shift measurements of (C6H6)2 to determine its dipole moment were performed with the CAESAR setup (coaxially aligned electrodes for the Stark effect applied in resonators).29 It provides a homogeneous electric field over the entire mode volume of the resonator, from which molecules are effectively contributing to the emission signal. We calibrated the field strength using the J + 1 ← J = 1 ← 0 transition of OC36S (0.02% natural abundance) using a documented dipole moment of 0.71519(3) D,30 also see Appendix A of ref. 31 for details. Stark shifts of several rotational transitions of (C6H6)2 were determined for different electric field strengths up to 172.2 V cm−1.
III. Theory
A. Reduced-dimensionality approach
All the assigned rotational lines observed in the FTMW spectra split into quartets with a characteristic 1:2:1 ratio of the separations between consecutive lines. The magnitude of the splittings is typically about 60, 120, and 60 kHz. Since a similar level splitting pattern is obtained for sixfold hindered rotation tunneling in the high-barrier limit, it is expected that the observed splittings originate from the hindered rotation of one of the benzene monomers about its sixfold axis. The barrier in the ab initio potential12 for rotation of the cap in the TT structure is only 6 cm−1 and the six-dimensional calculations of the VRT levels produce cap hindered rotation levels separated by about 1 cm−1 ≈ 30 GHz, see Fig. 5 of ref. 12. Therefore, it seems unlikely that the much smaller splittings observed in the FTMW spectra are caused by hindered rotation of the cap; they probably originate from hindered rotation of the stem. There were some observations, however, which seemed to contradict this assumption. The sixfold barrier in the ab initio potential for stem rotation in the TT structure is about 118 cm−1. One-dimensional (1D) calculations for hindered stem rotation presented in ref. 12 show that the corresponding level splittings are on the order of 3 × 10⁻⁸ cm−1 ≈ 1 kHz, i.e., much smaller than the observed splittings. The discrepancy becomes even worse, however, if one realizes that the observed line splittings correspond to ΔJ = 1, ΔK = 0 transitions and that the selection rules only allow transitions from the lowest lower state tunneling level to the lowest upper state tunneling level, from the second lower state tunneling level to the second upper state tunneling level, etc., see Fig. 1. Consequently, the splittings of about 60, 120, and 60 kHz in the rotational transition frequencies correspond to differences in the splittings of the lower (J) state levels and the upper (J + 1) state levels. This implies that the tunneling splittings of the energy levels involved in the transitions, see Fig. 1, should be strongly J dependent and much larger than the observed line splittings. Results from the 1D model seem to indicate that such large splittings can only occur if the stem-rotation barrier is very much smaller than given by the ab initio calculations: so small, in fact, that one would no longer be in the high-barrier tunneling limit and the characteristic 1:2:1 splitting pattern would be lost. Moreover, it was not clear from the 1D model why the splittings would be strongly J dependent.
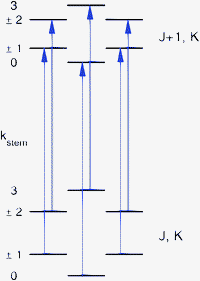 | ||
| Fig. 1 Allowed ΔJ = 1, ΔK = 0 transitions, with kstemlabeling the different stem-rotation tunneling levels of the lower and upper rotational states. | ||
Also Špirko et al.10 assigned the 1:2:1 splittings observed in the FTMW spectrum of Arunan and Gutowsky9 to hindered stem rotation tunneling and they performed 1D calculations of the splittings for various stem rotation barrier heights. In CCSD(T) calculations with a small basis they had found the height of this barrier to be 46 cm−1; their corresponding splittings were 1.24, 2.49, and 1.25 MHz. From the size of the splittings observed in the FTMW spectrum they estimated that this barrier must be about 90 cm−1, twice their calculated value. However, they did not realize that the splittings observed for ΔJ = 1, ΔK = 0 transitions in the FTMW spectrum must correspond to differences in the splittings of the tunneling levels calculated for J and J + 1, which can only be explained if the splittings of the levels for each J are much larger than the splittings in the transition frequencies and, moreover, strongly J dependent.
Hence, in order to reproduce our experimental splittings, an extended tunneling mechanism beyond 1D stem rotation has to be considered. Tilt tunneling is the process in which the dimer in the TT equilibrium structure with Cs symmetry (Fig. 2) tunnels through a C2v symmetric T-shaped structure to an equivalent TT equilibrium structure of Cs symmetry. The barrier in the ab initio potential12 at the C2v symmetric T-shaped structure is about 27 cm−1. A set of Euler angles describing the orientations of the benzene monomers in the dimer was defined in ref. 12. The TT equilibrium structure in Fig. 2 has βA = 9°, γA = 30°, α = 90°, βB = 90° and γB = −12° (subscript A denotes the cap and subscript B the stem). In our 2D reduced-dimensionality approach we fix the angles γA, α, βB at their equilibrium values and we also fix the distance R between the monomer centers of mass. We vary the polar angle βA, i.e., the angle between the cap C6 axis and the vector R that connects the centers of mass of the cap and the stem, and the angle γB that describes the rotation of the stem about its own C6 axis (see Fig. 2). At the C2v symmetric T-shaped structure both βA and γB are zero. The tilt-tunneling process involves not only a change of βA from +9° to −9°, but also a change of γB from −12° to +12°. This shows already that tilt tunneling and stem C6 rotation are correlated. The reason for this correlation can be understood from a 2D plot of the 6D potential surface as a function of the angles βA and γB, see Fig. 3. In this plot the other Euler angles are fixed at their equilibrium values and R = 9.42a0, which is the average distance in the vibrational ground state.12 This figure illustrates that the barrier for stem rotation is as high as 320 cm−1 if the cap tilt angle βA is fixed at its equilibrium value of 9°. If βA is fixed at 0° the minimum (at the T-shaped structure with γB = 0°) is higher by 24 cm−1 (for R = 9.42a0) and the barrier (relative to that minimum) is only 92 cm−1. That is, if βA is allowed to relax, the barrier for stem rotation through the T-shaped structure is 116 cm−1. This value is not very different from the value of 118 cm−1 obtained if one starts from the TT equilibrium structure with R = 9.34a0 and also R is allowed to relax. Thus, stem rotation is strongly facilitated if the cap is allowed to rotate away from its equilibrium orientation.
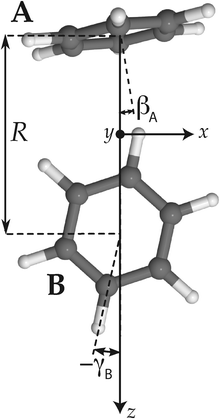 | ||
| Fig. 2 Tilted T-shaped (TT) equilibrium structure. βA describing the cap tilt and γB describing the stem rotation are the internal angles varied in the 2D model. Also the overall rotation of the dimer about the y axis is included in this model. | ||
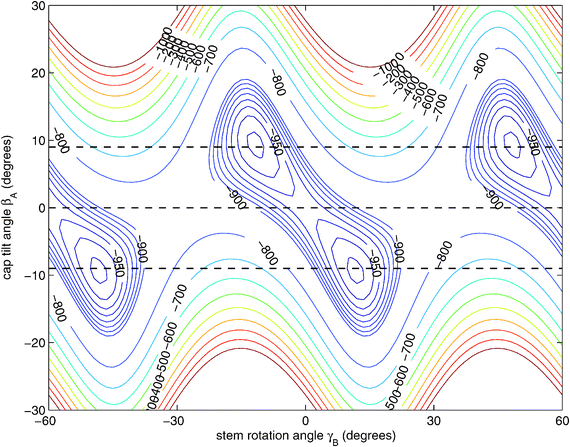 | ||
| Fig. 3 Two-dimensional cut of the ab initio potential12 with the angles γA = 30°, α = 90°, and βB = 90° fixed to their values at the potential minimum and R = 9.42a0 chosen as the average distance in the 6D vibrational ground state.12 The angle γB actually ranges over 360° and the potential is invariant under changes of γB by 60°. 1D cuts of the potential for βA = 9°, 0°, and −9° are marked with dashed lines. | ||
Since a 1D model for stem hindered rotation could not explain the splittings observed in the FTMW spectrum, while a full 6D calculation could not be converged sufficiently well to extract the observed small tunneling splittings, we constructed a 2D model that involves only the two internal coordinates βA and γB. The potential surface used in this model is a 2D cut of the ab initio potential, as shown in Fig. 3; we also studied the effect of choosing different values of R. The Hamiltonian in our model is a restricted version of the Hamiltonian in body-fixed (BF) dimer coordinates used in the 6D calculation of the VRT states in ref. 12. The restriction implies that each of the monomers is only allowed to rotate about a single axis, which is parallel to the y axis of the dimer. The z axis of the BF frame was already defined12 to be along the intermolecular vector R, and the y axis is the axis perpendicular to the plane of the stem molecule in the TT structure (as well as in all other structures described by the 2D model). With this restriction the Hamiltonian of eqn (5) in ref. 12 becomes
 | (1) |
 and
and  represent the internal angular momenta associated with cap tilt and stem rotation, respectively, and
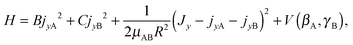
  is the total angular momentum operator for overall rotation of the dimer about the y axis, with rotation angle χ′. The value of R is fixed and μAB is the reduced mass of the dimer. Note that this kinetic operator includes a coupling term 2jyAjyB/(2μABR2) between the monomer angular momenta, as well as Coriolis coupling terms −2(jyA + jyB)Jy/(2μABR2) between the monomer rotations and the overall rotation. As will be discussed below, these terms are essential to let the model explain the experimental data.
The eigenstates of this Hamiltonian are obtained by diagonalization of its matrix in the product basis
| |nA〉 |kB〉 |Ky〉. | (2) |
 for the hindered stem rotation, and |Ky〉 are free rotor functions
  for the overall rotation of the dimer about its y axis. The quantum number Ky is an exact quantum number of the Hamiltonian in eqn (1). The symmetry group of this Hamiltonian with the potential of Fig. 3 that has a sixfold barrier in the angle γB is the dihedral group D6. The irreps of this group are labeled with kstem = kB (mod 6) and the parity ptilt under the sign change (βA,γB) → (−βA, −γB), which we will call the tilt parity. The levels with stem rotation quantum numbers kstem = 0 and 3 and even tilt parity correspond to the irreps A1 and B2, those with odd tilt parity to the irreps A2 and B1.35 The levels of E1 and E2 symmetry with kstem = ±1 and ±2 are twofold degenerate.
The sinc DVR basis covered the range of −45° ≤ βA ≤ 45° with a step size of 1.5°. The free rotor basis for stem rotation that converged the tunneling splittings to better than 1 Hz had kB ranging from −96 to 96. We note here that the Wigner function bases for the monomer rotations in the 6D calculations12 had to be truncated at jmax = |kmax| = 24. Matrix elements of the kinetic energy operators jyA and jyA2 were obtained with the formulae in ref. 33 and 34, the potential is diagonal in the sinc DVR basis. The kinetic energy operators jyB and jyB2 are diagonal in the free rotor basis |kB〉, the potential matrix elements in this basis are calculated numerically on a Fourier grid with step size 1.5° for 0° ≤ γB ≤ 360°. The operator Jy is diagonal in the basis |Ky〉, with eigenvalues Ky.
The levels calculated as described above correspond to overall rotation of the dimer about the y axis, with quantum number Ky. Considering the T-shaped dimer as a rigid rotor in three-dimensional space, this quantum number Ky corresponds to the asymmetric rotor quantum number Kc. In the FTMW spectrum transitions are measured between rotational levels of the dimer with quantum numbers J and K ≡ Ka, the total dimer angular momentum and its projection on the dimer z axis. In order to compare the calculated level splittings with the measured data we define two BF frames on the dimer, one with the usual definition in which the dimer rotation quantum number K ≡ Ka is the projection of J on the z axis – we call this the “z axis frame” – and one called the “y axis frame” for which the rotations are quantized with respect to the dimer y axis and the projection quantum number K is replaced by Ky ≡ Kc. Let us then assume that the rotation of the usual dimer “z axis frame” with respect to a space-fixed frame is described by the Euler angles ϕ, θ, χ, with the symmetric rotor basis D(J)MK (ϕ, θ, χ)*, and the rotation of the “y axis frame” by the angles ϕ′, θ′, χ′, with the symmetric rotor basis  . The transformation from one frame to the other involves the same Euler rotation over (90°, 90°, 0°) as used to fix the stem C6 axis at (α, βB) = (90°, 90°). This rotation has the following effect on the symmetric rotor bases36
 | (3) |
 | (4) |
The eigenstates were calculated separately for each of the D6 irreps. The irrep label kstem refers to the stem hindered rotation. The A1, B2 levels with kstem = 0, 3 and ptilt = + correspond to the tilt tunneling ground state, the A2 and B1 levels with ptilt = − to the tilt tunneling excited state. The tilt parity of the E1 and E2 levels with kstem = ±1 and ±2 is not strictly defined. However, the calculated wavefunctions for the lowest two levels of each of these irreps, which correspond to the tilt tunneling ground and first excited states, are almost perfectly symmetric and antisymmetric combinations. Thus, we will label also the E1 and E2 levels with ptilt = ±, but one should realize that it is not an exact symmetry in this case. Higher tilt levels are vibrationally excited, but these have considerably higher energies and will not be discussed here. Also for the strongly hindered stem rotation we find vibrationally excited levels much higher in energy, but we restrict ourselves to the lower levels that may be regarded as tunneling levels of the vibrational ground state. The stem rotation tunneling levels with kstem = 0, ±1, ±2, 3 form quartets, with splittings that are the differences between the energy levels belonging to the same ptilt and different kstem. The tilt tunneling splittings are the differences between the levels with ptilt = − and ptilt = + and the same kstem. Only transitions between levels belonging to the same kstem are allowed by the selection rules, see Fig. 1. All we need to do then, to compare with the line splittings measured in the FTMW spectrum, is to subtract the stem rotation tunneling splittings obtained for J, K from those for J + 1, K.
B. Intensities, dipole functions
Also the intensities of the lines in each tunneling quartet in the FTMW spectrum show a characteristic pattern. In order to calculate these intensities, we constructed a dipole function that was used in our model to compute transition line strengths. The main contribution to the dipole moment function in a dimer of quadrupolar molecules as we have here, is the quadrupole induced dipole moment. This is a long range contribution, proportional to R−4. General formulae for multipole moments induced on the monomers in a molecular dimer by the field of the multipole moments of the other monomer are given in ref. 37, eqn (35), (36), and (40). These formulae contain the spherical components of the monomer multipole moments and polarizabilities. If we rewrite them in terms of Cartesian components and substitute the fixed equilibrium values of γA, α, βB we obtain for the dipole induced in the stem B by the quadrupole QA2,0 of the cap A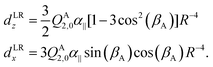 | (5) |
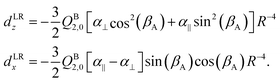 | (6) |
Both dLRz and dLRx depend on the cap tilt angle βA, but not on the stem rotation angle γB, since both the quadrupole moment and the dipole polarizability of the benzene molecule have axial symmetry. Therefore, we also modeled a short range contribution that depends on γB as well, of the following form
| dSRz = deven(βA) + cos[6(γB − βA)] |
| d SR x = dodd(βA) + sin[6(γB − βA)]. | (7) |
The components dz and dx of the two-dimensional dipole moment functions are defined with respect to a BF frame fixed on the dimer. We also define components with respect to a space-fixed (SF) frame that depend on the overall rotation angle χ′ of the dimer about its y axis. First we define BF two-dimensional spherical components
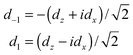 | (8) |
| dSFm = dmexp(imχ′) | (9) |
IV. Experimental results
A. Rotational spectrum and internal dynamics of (C6H6)2
Although the rotational spectrum of the tilted T-shaped structure of the benzene dimer is expected to be that of a near-prolate asymmetric top with A ≫ B > C, we unambiguously observed the rotational spectrum of a prolate symmetric top for (C6H6)2, in agreement with the findings of Arunan and Gutowsky in 1993.9 As also stated in ref. 9, several more transitions having singlet and doublet structures have been observed, which we did not attempt to assign yet. For (C6H6)2, we detected 16 symmetric-top transitions, ranging from J + 1, K ← J, K = 4, 1 ← 3, 1 at 3413.6 MHz to 10, 2 ← 9, 2 at 8476.5 MHz. As mentioned before, each J + 1, K ← J, K transition is split into four components that exhibit a very characteristic splitting pattern with lines at frequencies −2Δ, −Δ, +Δ, +2Δ with respect to the average frequency. That is, the separations between consecutive lines have a ratio of 1:2:1, the size Δ of the splittings depends on J and K. Fig. 4 shows the 6, 0 ← 5, 0 transition as an example for a typical rotational transition of (C6H6)2. Each component of this transition is further split by 28 kHz due to the Doppler effect that is typical for the COBRA implementation. The Doppler splittings depend on the carrier gas (i.e., on the velocity of the molecular beam) and on the respective excitation frequency and are indicated by bars. The actual transition frequencies are the arithmetic mean of the Doppler split lines. For the 6, 0 ← 5, 0 transition, the larger tunneling splitting amounts to 125 kHz, the two smaller splittings are 62–63 kHz, which results in the characteristic 1:2:1 splitting pattern. As mentioned in Section IIIA, this 1:2:1 splitting pattern perfectly resembles the fingerprint of tunneling in a high-barrier V6 potential. A more detailed discussion follows in Section V. The four components of all J + 1, K ← J, K rotational transitions are listed in Table 1, along with the residuals from individual fits for each component using a symmetric-top Hamiltonian (vide infra). The assignment of the four components to specific values of the tunneling quantum number kstem is discussed in Section VA.
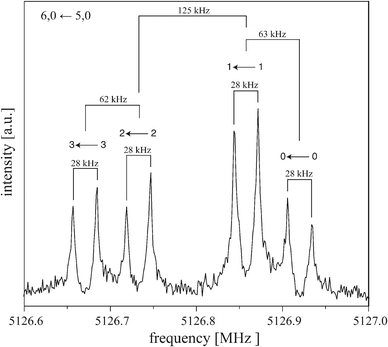 | ||
| Fig. 4 Typical symmetric-top transition (6, 0 ← 5, 0) of (C6H6)2 measured with neon as carrier gas. The polarization frequency of the microwave excitation pulse is 5126.8 MHz. Each component is split (here by 28 kHz, as indicated with bars) due to the Doppler effect typical for the coaxially oriented beam resonator arrangement (COBRA) FTMW spectrometer. Above each component it is indicated to which kstem transition this line is assigned, see Fig. 1. | ||
| Transition | k stem Tunneling components [MHz] | Residuals [kHz] | ||||||
|---|---|---|---|---|---|---|---|---|
| J′, K′ ← J, K | 3 ← 3 | 2 ← 2 | 1 ← 1 | 0 ← 0 | 3 ← 3 | 2 ← 2 | 1 ← 1 | 0 ← 0 |
| 4, 1 ← 3, 1 | 3413.6036 | 3413.6476 | 3413.7337 | 3413.7778 | 0.930 | 1.812 | 2.155 | −0.505 |
| 5, 0 ← 4, 0 | 4273.7754 | 4273.8272 | 4273.9307 | 4273.9815 | 1.190 | 0.560 | −0.730 | −2.510 |
| 5, 1 ← 4, 1 | 4265.9261 | 4265.9806 | 4266.0894 | 4266.1441 | −0.520 | 1.240 | 0.580 | −4.090 |
| 5, 2 ← 4, 2 | 4242.2571 | 4242.3193 | 4242.4435 | 4242.5061 | 115.480 | 124.530 | 126.500 | 116.880 |
| 5, 3 ← 4, 3 | 4206.1185 | 4206.1898 | 4206.3314 | 4206.4016 | −3000.860 | −2975.970 | −2961.450 | −2973.660 |
| 6, 0 ← 5, 0 | 5126.6702 | 5126.7319 | 5126.8570 | 5126.9201 | 2.029 | 1.980 | −0.299 | −4.559 |
| 6, 1 ← 5, 1 | 5117.5218 | 5117.5871 | 5117.7174 | 5117.7822 | −1.501 | 0.880 | 0.590 | −6.869 |
| 6, 2 ← 5, 2 | 5090.0919 | 5090.1652 | 5090.3120 | 5090.3853 | −27.411 | −15.050 | −10.119 | −30.440 |
| 7, 0 ← 6, 0 | 5978.5387 | 5978.6124 | 5978.7591 | 5978.8335 | 4.002 | 2.758 | −0.187 | −5.907 |
| 7, 1 ← 6, 1 | 5968.2379 | 5968.3139 | 5968.4663 | 5968.5426 | −1.118 | 2.258 | 2.242 | −10.897 |
| 7, 2 ← 6, 2 | 5937.5399 | 5937.6239 | 5937.7924 | 5937.8759 | −220.988 | −204.562 | −195.707 | −231.877 |
| 8, 1 ← 7, 1 | 6817.9194 | 6818.0063 | 6818.1789 | 6818.2659 | 0.568 | 5.204 | 7.370 | −12.079 |
| 9, 1 ← 8, 1 | 7666.4083 | 7666.5055 | 7666.7009 | 7666.7985 | 2.101 | 9.328 | 11.836 | −15.954 |
| 9, 2 ← 8, 2 | 7630.8530 | 7630.9579 | 7631.1647 | 7631.2688 | −669.049 | −642.572 | −618.954 | −708.334 |
| 10, 1 ← 9, 1 | 8513.5432 | 8513.6521 | 8513.8701 | 8513.9779 | 1.090 | 10.280 | 14.340 | −23.530 |
| 10, 2 ← 9, 2 | 8476.4752 | 8476.5892 | 8476.8138 | 8476.9273 | −856.850 | −822.820 | −789.380 | −916.870 |
We determined the transition intensities for all tunneling components of the J + 1, K ← J, K = 5, 0 ← 4, 0; 5, 1 ← 4, 1; 7, 0 ← 6, 0 and the 7, 1 ← 6, 1 transitions by carefully remeasuring each component with two different polarization powers to exclude overpolarization effects. The intensity pattern follows a 3:2:2:1 behavior, with an error of about 20%, with the lowest-frequency component of each quartet having the largest intensity. We obtain very similar results for rotational transitions involving even or odd K values.
Table 2 summarizes the spectroscopic parameters of the benzene dimer resulting from four individual fits for each quartet component using a symmetric-top Hamiltonian including centrifugal distortion. For a J + 1, K ← J, K transition of a prolate symmetric top the transition frequency is given by
| ν(J, K) = 2B(J + 1) − 4DJ(J + 1)3 − 2DJK(J + 1)K2 |
| + 2HJ(J + 1)3(3J2 + 6J + 4) + 4HJK(J + 1)3K2 + 2HKJ(J + 1)K4, | (10) |
| Parameter | k stem Tunneling components | |||
|---|---|---|---|---|
| 3 ← 3 | 2 ← 2 | 1 ← 1 | 0 ← 0 | |
| a Σ corresponds to DJK − HKJ. | ||||
| B [MHz] | 427.7277 ± 0.0002 | 427.7328 ± 0.0003 | 427.7430 ± 0.0003 | 427.7479 ± 0.0003 |
| D J [kHz] | 6.970 ± 0.003 | 6.970 ± 0.004 | 6.970 ± 0.005 | 6.970 ± 0.004 |
| Σ [MHz] | 0.8361 ± 0.0003 | 0.8356 ± 0.0003 | 0.8350 ± 0.0004 | 0.8344 ± 0.0003 |
| H J [Hz] | −0.81 ± 0.02 | −0.80 ± 0.02 | −0.79 ± 0.02 | −0.79 ± 0.02 |
| H JK [kHz] | 1.020 ± 0.003 | 1.020 ± 0.003 | 1.020 ± 0.004 | 1.010 ± 0.004 |
| rms [kHz] | 1.79 | 4.92 | 6.41 | 10.95 |
The tilted T-shaped equilibrium structure corresponds to a near-prolate asymmetric top with rotational constants A = 1914.5 MHz, (B + C)/2 = 430.0 MHz and B − C = 31.5 MHz (see Table 9 in ref. 12). Also the rotational constants of different vibration–rotation–tunneling (VRT) states of the benzene dimer obtained from 6D calculations are given in this table. The value of (B + C)/2 calculated for the ground vibrational state is 423.9 MHz, in good agreement with our measured symmetric-top spectrum which yields rotational constants B ranging from 427.7277 MHz to 427.7479 MHz (Table 2) for the four tunneling components. The value of B − C is a direct measure of the asymmetry of the complex. As already suggested by Henson et al.8 and as can be understood from the calculated low barrier of only 6 cm−1 ≈ 0.07 kJ mol−1, the 6D calculations show that the benzene cap in the T-shaped dimer structure is nearly freely rotating about its C6 axis. One can observe in Table 9 of ref. 12 that the rigid rotor value of B − C = 31.5 MHz is reduced to 11.2 MHz for the vibrational ground state of A1+/A2+ symmetry and, hence, that some dynamical averaging of the asymmetry occurs. Still, the calculated asymmetry seems to disagree with the experimental observation that the benzene dimer is a symmetric top (B = C). One should realize, however, that only the rotational constants of VRT states of A type symmetry in the G576 group could be obtained from the 6D calculations.12 A group-theoretical analysis shows that in the states of G and K type symmetry (see Table 4 in ref. 12) the benzene dimer with nearly free internal cap rotation behaves as a symmetric top. The observation of a symmetric-top spectrum for the benzene dimer in our experiments is a strong indication that we observed transitions between such G and K type states. Also for other benzene complexes with low barriers to internal rotation, such as benzene–H2O, benzene–H2S, and benzene–CO the rotational spectra exhibit symmetric-top structures.41,42
B. Rotational spectrum of (C6D6)C(C6H6)S
To gain a more detailed picture of the internal dynamics of the highly floppy benzene dimer, we also recorded the rotational spectrum of the mixed dimer (C6D6)C(C6H6)S. Similarly to (C6H6)2, the rotational spectrum of (C6D6)C(C6H6)S follows that of a prolate symmetric top, with each rotational transition being split into four components. Fig. 5 shows the rotational transition 7, 2 ← 6, 2 of (C6D6)C(C6H6)S measured with neon as carrier gas (right). For comparison, the same transition is also shown for (C6H6)2 (left). The (C6D6)C(C6H6)S rotational transitions are significantly broadened and thus less intense. This drastic difference results from the quadrupole coupling of the six deuterium nuclei (ID = 1). No attempts have been undertaken here to analyze the deuterium quadrupole hyperfine splitting pattern, since the splittings are only barely resolved.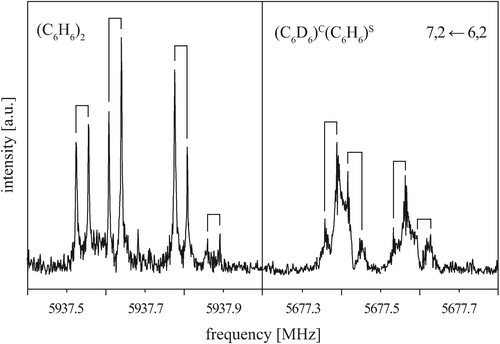 | ||
| Fig. 5 Rotational transition 7, 2 ← 6, 2 of (C6H6)2 (left) and (C6D6)C(C6H6)S (right) measured with neon as a carrier gas. Note that the additional line broadening from the deuterium nuclear quadrupole coupling in (C6D6)C(C6H6)S obscures the 1:2:1 splitting pattern to some extent. | ||
Again, the observed tunneling splittings exhibit a 1:2:1 ratio. Due to the large broadening of the observed lines, however, the precision in determining the line frequencies is lower for (C6D6)C(C6H6)S than for (C6H6)2. Furthermore, no attempt was made to determine the intensities of the four tunneling components. The transitions with a well-resolved quartet structure are listed in Table 3. Due to the broadened lines, only the center frequencies of the quartets for transitions with K = 0 and K = 1 have been considered in the fitting of the rotational parameters. Due to the lower resolution and precision, the fit parameters are limited to the rotational constant B and the quartic centrifugal distortion terms DJ and DJK − HKJ, see Table 4. Comparison of the symmetric-top rotational transitions of (C6D6)C(C6H6)S with the corresponding transitions of (C6H6)2 shows that the (C6D6)C(C6H6)S quartet splittings are reduced to about 70% of the (C6H6)2 splittings. This will be discussed in more detail in Section VA.
| Transition | Line centera [MHz] | k stem Tunneling components [MHz] | Residualb [kHz] | |||
|---|---|---|---|---|---|---|
| J′, K′ ← J, K | 3 ← 3 | 2 ← 2 | 1 ← 1 | 0 ← 0 | ||
| a The frequencies of the four components are averaged to give the line center. b Residue between the experimental line center and the fitted frequencies. | ||||||
| 5, 0 ← 4, 0 | 4087.1480 | 4087.0897 | 4087.1192 | 4087.1777 | 4087.2054 | 1.79 |
| 5, 1 ← 4, 1 | 4079.3956 | 4079.3281 | 4079.3604 | 4079.4309 | 4079.4628 | 0.23 |
| 6, 2 ← 5, 2 | 4866.8521 | 4866.7501 | 4866.8022 | 4866.9033 | 4866.9527 | 21.75 |
| 7, 0 ← 6, 0 | 5718.0182 | 5717.9193 | 5717.9701 | 5718.0662 | 5718.1172 | 0.36 |
| 7, 1 ← 6, 1 | 5707.8468 | 5707.7438 | 5707.7953 | 5707.8984 | 5707.9496 | 1.63 |
| 7, 2 ← 6, 2 | 5677.4893 | 5677.3720 | 5677.4304 | 5677.5469 | 5677.6078 | −151.32 |
| 8, 1 ← 7, 1 | 6520.8669 | 6520.7488 | 6520.8082 | 6520.9249 | 6520.9859 | 4.71 |
| 9, 1 ← 8, 1 | 7332.9137 | 7332.7739 | 7332.8526 | 7332.9745 | 7333.0537 | 4.25 |
C. Stark effect measurements
Using the CAESAR setup as implemented in the Hannover COBRA FTMW spectrometer,29 we measured the Stark shifts of five symmetric-top transitions (J + 1, K ← J, K = 5, 0 ← 4, 0; 5, 1 ← 4, 1; 7, 0 ← 6, 0; 7, 1 ← 6, 1; 9, 1 ← 8, 1) of (C6H6)2 for different electric field strengths up to 172.2 V cm−1. The Stark shift of a particular molecular level is directly dependent on the molecular dipole moment. Consequently, the combination of Stark effect measurements with high-resolution spectroscopy is ideal for precisely determining molecular dipole moments and thus gaining further information about the molecular structure. For (C6H6)2, K = 1 transitions exhibit a linear Stark effect, i.e., a linear frequency shift as a function of the electric field strength, while transitions involving K = 0 show a quadratic Stark effect at moderate electric field strengths. This is usual for a symmetric top.Table 5 summarizes the results for the two K = 0 rotational transitions used to quantitatively determine the dipole moment of (C6H6)2. The linear Stark shifts of K = 1 transitions have not been quantitatively analyzed due to their already enormous shifts at low electric field strengths.
| U [kV] | k stem Tunneling components | ||||
|---|---|---|---|---|---|
| 3 ← 3 | 2 ← 2 | 1 ← 1 | 0 ← 0 | ||
| n.d.: not determined. | |||||
| 5, 0 ← 4, 0 | |||||
| 0 | 4273.7753 | 4273.8267 | 4273.9305 | 4273.9821 | |
| 2.5 | 4273.7750 | 4273.8268 | 4273.9305 | 4273.9829 | |
| 5 | 4273.7750 | 4273.8252 | 4273.9295 | 4273.9806 | |
| 7.5 | 4273.7701 | n.d. | 4273.927 | n.d. | |
| 10 | 4273.8175 | 4273.8262 | 4273.9240 | 4273.9375 | |
| 7, 0 ← 6, 0 | |||||
| 0 | 5978.5391 | 5978.6130 | n.d. | n.d. | |
| 2.5 | 5978.5391 | 5978.6118 | n.d. | n.d. | |
| 5 | 5978.5388 | 5978.6121 | n.d. | n.d. | |
| 7.5 | 5978.5381 | 5978.6108 | n.d. | n.d. | |
| 10 | 5978.5361 | 5978.6092 | n.d. | n.d. | |
| 12 | 5978.5352 | 5978.6074 | n.d. | n.d. | |
Fig. 6 shows the behavior of the four components of the 5, 0 ← 4, 0 transition (left) and of the first and second component of the 7, 0 ← 6, 0 transition (right) measured in the presence of an external electric field for different field strengths. Again, each component is split by the Doppler effect. To make it easier to compare different measurements, the individual lines of the Doppler doublets of the zero-field transitions are indicated by dashed lines. The given voltages U (applied to the rear parabolic reflector, as described in more detail in ref. 29) correlate with the electric field strength according to U/d, with d being an effective distance between the two microwave reflectors (d5,0←4,0 = 0.59644 m and d7,0←6,0 = 0.58746 m, respectively).
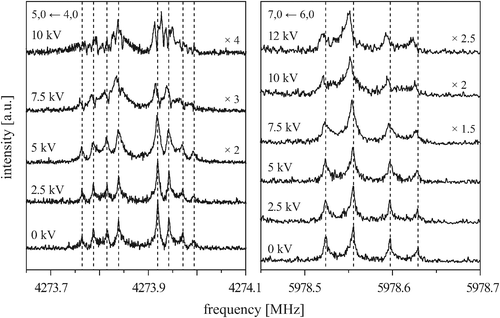 | ||
| Fig. 6 The 5, 0 ← 4, 0 transition (left) and the kstem = 3 ← 3 and 2 ← 2 components of the 7, 0 ← 6, 0 transition (right) measured in the presence of an external electric field with various field strengths, as indicated by the applied voltage. Each component is split by the Doppler effect. The spectra without electric field are shown for comparison. | ||
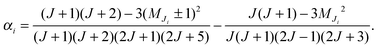
At low electric field strengths, the tunneling components of the rotational transitions are hardly shifted, and any Stark splitting is too small to be observed (Fig. 6). At higher electric field strengths the lines are slightly broadened and a small shift is observed, which increases with increasing field strength. The detailed Stark splitting pattern cannot be determined precisely enough since the signal-to-noise ratio is strongly reduced with increasing electric field strength. Therefore, an unambiguous assignment of the individual MJ components is not possible for the transitions 5, 0 ← 4, 0 and 7, 0 ← 6, 0. Instead a value, say α, is determined that corresponds to the average frequency shift (relative to the frequency of the transition in zero electric field) of all possible MJ+1 ← MJ transitions between two specific rotational levels J + 1, K = 0 and J, K = 0.43 In this analysis, all possible transitions are weighted by their relative intensities fi according to
 | (11) |
 | (12) |
 | (13) |
Based on the components listed in Table 5, the dipole moment of (C6H6)2 is determined to be μ = 0.580 ± 0.051 D. This value is in good agreement with μ = 0.51 D calculated for the T-shaped structure by Hobza et al.44 As we wrote in Section IIIB, the main contributions to the dipole moment of the benzene dimer are the dipole moments induced on each of the monomers by the electric field of the quadrupole on the other monomer. If we use the expressions for these induced dipole moments in eqn (5) and (6), substitute the values of the benzene quadrupole moment and polarizability given in Section III B, fix the monomers in the orientations that they have in the TT equilibrium structure, and use the vibrationally averaged distance R = 9.42a0, the dipole moment is found to be μ = 0.63 D. This value is in agreement with our measured value, so the assumption that the quadrupole-induced dipole moments are the dominant dipole contributions is indeed justified.
V. Calculated results, discussion
A. Energy levels, tunneling splittings
Table 6 lists the lower energy levels calculated for |Ky| = 0, 1, and 2 with the 2D potential of Fig. 3, while Fig. 7 shows some of the corresponding wave functions for Ky = 0. We plotted only the wave functions for the A1,2 and B1,2 levels with kstem = 0 and 3, because these levels are nondegenerate and the wave functions are real-valued. The E1 and E2 levels are twofold degenerate; obtaining real-valued wave functions would require combining the functions with kstem = ±1 and those with kstem = ±2. For Ky ≠ 0 we had to use parity-adapted rotor states in our 2D model by combining −Ky and +Ky; otherwise the levels with kstem = ±1 and ±2 were not degenerate.| k stem | p tilt = + | p tilt = − | ||
|---|---|---|---|---|
| Energy (cm−1) | Splitting (kHz) | Energy (cm−1) | Splitting (kHz) | |
| K y = 0, E0 = −939.3911 cm−1, Δtilt = 0.1101 cm−1 | ||||
| 0 | −0.0000604 | 0.0000621 | ||
| ±1 | −0.0000302 | 905 | 0.0000311 | −931 |
| ±2 | 0.0000302 | 1812 | −0.0000311 | −1863 |
| 3 | 0.0000605 | 907 | −0.0000622 | −932 |
| |Ky| = 1, E0 = −939.3775 cm−1, Δtilt = 0.1101 cm−1 | ||||
| 0 | −0.0000598 | 0.0000614 | ||
| ±1 | −0.0000299 | 895 | 0.0000307 | −920 |
| ±2 | 0.0000299 | 1791 | −0.0000307 | −1842 |
| 3 | 0.0000598 | 896 | −0.0000615 | −922 |
| |Ky| = 2, E0 = −939.3366 cm−1, Δtilt = 0.1101 cm−1 | ||||
| 0 | −0.0000577 | 0.0000594 | ||
| ±1 | −0.0000289 | 865 | 0.0000297 | −889 |
| ±2 | 0.0000289 | 1730 | −0.0000297 | −1779 |
| 3 | 0.0000577 | 866 | −0.0000594 | −890 |
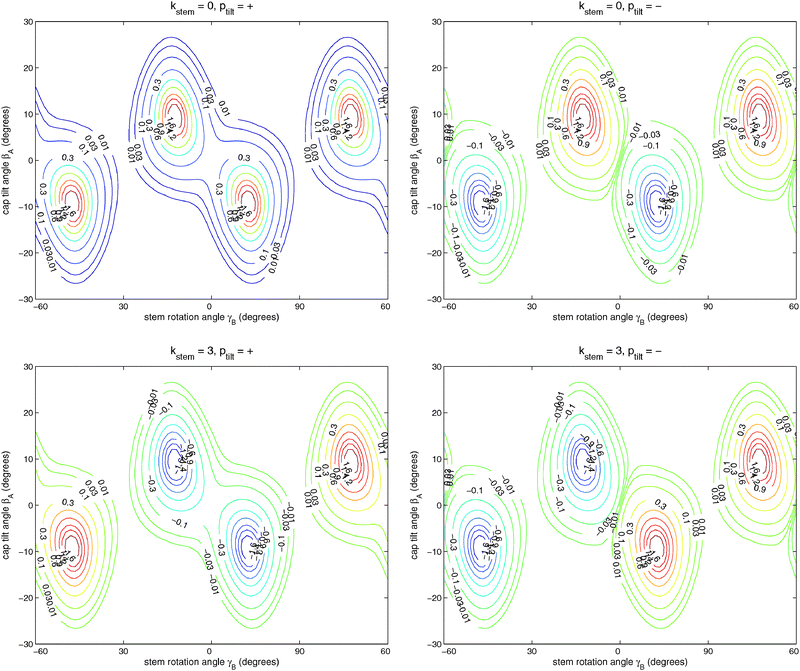 | ||
| Fig. 7 Wave functions of the ground (ptilt = +) and excited (ptilt = −) tilt tunneling states. The functions in the upper panels belong to the A1 and A2 irreps with kstem = 0 and the functions in the lower panels to the B2 and B1 irreps with kstem = 3. Note that the A1,2 functions are invariant and the B1,2 functions change sign when γB is changed by 60°. | ||
It is clear from Fig. 7 that (for given Ky) the lowest two levels for each kstem are the tilt tunneling ground and excited states. Table 6 shows a tilt tunneling splitting Δtilt of about 0.1 cm−1. The 6D calculations of ref. 12 gave a considerably larger tilt tunneling splitting of about 1 cm−1. This can be understood from the shape of the global 6D potential surface in the tilt tunneling region. As discussed in ref. 12, the saddle between two equivalent TT minima is rather wide and the lowest barrier (25 cm−1) occurs not even precisely at the T-shaped structure with C2v symmetry (the S3 geometry in ref. 12 with a barrier of 27 cm−1) but for a bent T-shaped geometry (called S3a in ref. 12). Hence, tilt tunneling is easier when all internal coordinates are included than when the bend angle is fixed at βB = 90° as we did here, so the larger splitting of 1 cm−1 in ref. 12 is more realistic.
The energy differences between the lowest levels with Ky = 0 for different irreps, A1, E1, E2, B2 with kstem = 0, ±1, ±2, 3 are the stem rotation tunneling splittings. The levels in Table 6 show the same [−2Δ, −Δ, +Δ, +2Δ] quartet splitting pattern as the lines in the FTMW spectrum and the separations between consecutive levels precisely have the ratio of 1:2:1. The excited tilt tunneling levels with ptilt = − show very similar splittings as the levels with ptilt = +, but their order is reversed. The energies of the tilt tunneling ground states increase with increasing kstem = 0, 1, 2, 3, those of the excited tilt tunneling states decrease.
If we compare the levels in Table 6 for |Ky| = 0, 1, and 2, it becomes clear that the tilt tunneling splitting Δtilt is nearly independent of Ky, whereas the splittings Δ, 2Δ, Δ in the stem rotation tunneling quartets decrease with increasing |Ky|. Levels were calculated for |Ky| as high as 11 and this decrease becomes steeper for higher |Ky|. This is essential to explain the splittings of the ΔJ = 1 transition frequencies observed in the FTMW spectrum. The dependence of the splittings on |Ky| originates from the Coriolis coupling terms −2(jyA + jyB)Jy/(2μABR2) in the Hamiltonian of eqn (1); without these terms the splittings do not depend on Ky. Also the cross term 2jyAjyB/(2μABR2) in the kinetic operator of eqn (1) plays a very important role; if we omit this term the splittings are reduced by nearly a factor of 2. Hence, we conclude that the hindered stem rotation is not only coupled to the tilt motion through the (2D) intermolecular potential, also the kinetic coupling between the internal angular momenta associated with these motions is important. These kinetic energy terms are proportional to the end-over-end rotational constant 1/(2μABR2), which is five to ten times smaller than the monomer rotational constants B and C. It seems surprising that such small kinetic energy terms have such an important effect on the tunneling splittings. One must remember, however, that the high-barrier tunneling limit applies in this case. In this limit the splittings depend exponentially on the height and width of the potential barrier, so it is plausible that they also depend sensitively on the terms in the kinetic energy operator (in simple cases the effective mass, here the effective angular moment of inertia).
It is also striking that the splittings from the 2D calculations are larger by two orders of magnitude than in a 1D model for sixfold hindered stem rotation with approximately the same barrier. For a barrier of 92 cm−1, which is the barrier for stem rotation in the T-shaped structure, the tunneling splittings from the 1D model introduced in ref. 12 would be 10, 20, and 10 kHz, instead of the splittings given in Table 6 for the 2D model. Tunneling becomes harder when the path is longer and the “motion” is restricted to a lower dimension. In the 2D case, the system can move from a minimum in the potential, see Fig. 3, to the nearest minimum in the next double well by rotating the stem over only 36°, instead of 60° in the 1D model. Of course, this involves a simultaneous reversal of the cap tilt angle, but that is a fast low barrier tunneling motion.
The levels for all dimer overall rotation quantum numbers J, K with J ≤ 11 were obtained from the levels calculated for |Ky| = 0 to 11 through the transformation of eqn (4). Subtraction of the energies of the levels with given J, K from those with J + 1, K produces transition frequencies that, in principle, could be directly compared with the frequencies of the ΔJ = 1, ΔK = 0 transitions observed in the FTMW spectrum of the benzene dimer. Our 2D model cannot reproduce the correct J, K dependence of the rotational levels, however, so we focus on the tunneling splittings in the comparison with the experimental data. Only transitions between levels with the same kstem are allowed, see Fig. 1, and since the measured transitions are purely rotational, we consider transitions between levels with the same tilt tunneling parity ptilt. Table 7 shows the quartet splittings calculated for such allowed transitions with ptilt = + ← + and − ← − and the splittings obtained from the experimental data in Table 1. First, we observe that the calculated splittings show the measured 1:2:1 ratio, and that they semi-quantitatively agree with the measured data. Moreover, our model predicts the increase of the splittings with J and the smaller increase with K, in qualitative agreement with the experimental observations. Hence, we conclude that our model has indeed uncovered the mechanism that causes these splittings.
| J′, K′ ← J, K | p tilt = + | p tilt = − | Measured | ||||||
|---|---|---|---|---|---|---|---|---|---|
| 4, 1 ← 3, 1 | 39.5 | 78.7 | 39.2 | 40.4 | 80.9 | 40.6 | 44.0 | 86.1 | 44.1 |
| 5, 0 ← 4, 0 | 47.9 | 95.6 | 47.7 | 49.0 | 98.3 | 49.3 | 51.8 | 103.5 | 50.8 |
| 5, 1 ← 4, 1 | 48.1 | 95.9 | 47.8 | 49.2 | 98.6 | 49.4 | 54.4 | 108.9 | 54.7 |
| 5, 2 ← 4, 2 | 48.5 | 96.7 | 48.2 | 49.6 | 99.4 | 49.9 | 62.1 | 124.2 | 62.6 |
| 5, 3 ← 4, 3 | 49.2 | 98.1 | 48.9 | 50.3 | 100.9 | 50.6 | 71.3 | 141.7 | 70.2 |
| 6, 0 ← 5, 0 | 55.7 | 111.1 | 55.4 | 57.0 | 114.2 | 57.2 | 61.7 | 125.2 | 63.1 |
| 6, 1 ← 5, 1 | 55.8 | 111.4 | 55.6 | 57.1 | 114.6 | 57.4 | 65.3 | 130.4 | 64.8 |
| 6, 2 ← 5, 2 | 56.3 | 112.4 | 56.1 | 57.6 | 115.6 | 57.9 | 73.3 | 146.7 | 73.4 |
| 7, 0 ← 6, 0 | 62.5 | 124.7 | 62.2 | 64.0 | 128.2 | 64.3 | 73.7 | 146.8 | 74.3 |
| 7, 1 ← 6, 1 | 62.7 | 125.1 | 62.4 | 64.2 | 128.6 | 64.4 | 76.0 | 152.2 | 76.4 |
| 7, 2 ← 6, 2 | 63.2 | 126.2 | 63.0 | 64.7 | 129.8 | 65.0 | 84.0 | 168.6 | 83.5 |
| 8, 1 ← 7, 1 | 68.5 | 136.7 | 68.2 | 70.2 | 140.5 | 70.4 | 86.9 | 172.6 | 87.0 |
| 9, 1 ← 8, 1 | 73.1 | 146.0 | 72.9 | 75.0 | 150.1 | 75.2 | 97.1 | 195.5 | 97.6 |
| 9, 2 ← 8, 2 | 73.8 | 147.4 | 73.6 | 75.7 | 151.5 | 75.9 | 104.8 | 206.7 | 104.1 |
| 10, 1 ← 9, 1 | 76.6 | 152.9 | 76.4 | 78.6 | 157.3 | 78.7 | 108.8 | 218.0 | 107.9 |
| 10, 2 ← 9, 2 | 77.3 | 154.4 | 77.1 | 79.3 | 158.8 | 79.5 | 114.0 | 224.6 | 113.5 |
Our calculations also allow us to assign the individual lines in the quartets observed in the FTMW spectrum. The energies of the tunneling levels calculated for ptilt = + increase with kstem = 0, 1, 2, 3, while the energies calculated for ptilt = − increase with kstem = 3, 2, 1, 0, see Table 6. If we assume that both tilt tunneling levels are thermally occupied in the molecular beam – an assumption that we will discuss below – the quartets in the FTMW spectrum correspond to a superposition of transitions with ptilt = + ← + and − ← −. Table 7 shows that the absolute values of the line splittings are practically the same for ptilt = + and −, so this does not lead to an additional line splitting. Table 6 shows that the level splittings decrease with increasing Ky and, therefore, with increasing J and since the FTMW spectrum corresponds to transitions from J to J + 1, this implies that the lines in the quartets in increasing frequency order correspond to kstem = 3, 2, 1, 0 for ptilt = + ← + transitions and to kstem = 0, 1, 2, 3 for ptilt = − ← − transitions.
In principle, it would be possible that the J dependence of the tunneling splittings essential to reproduce the quartet splittings in the FTMW spectrum is an effect of centrifugal distortion. We have investigated this in our 2D model by assuming that centrifugal distortion affects the fixed value of R that enters into the model. We used a 1D radial cut of the 6D ab initio potential with all angles fixed at their equilibrium values (see above) and computed the expectation value of R over the radial wave functions calculated on this 1D potential for different values of J. This expectation value changed only very slightly with J, by about 0.002a0 from J = 0 to J = 10. The value of R determines the 2D cut of the potential used in the model, and thereby the height of the barriers, and it occurs in the end-over-end rotational constant 1/(2μABR2). From calculations with our 2D model with R = 9.40, 9.41, 9.42, 9.45, and 9.50a0, it is clear that the J dependence of the tunneling splittings originating from centrifugal distortion is far too weak to explain the observed splittings. These calculations also demonstrated that if we had chosen R somewhat different from the value of 9.42a0, the splittings in Table 7 would still qualitatively and semi-quantitatively agree with the experimental data.
Finally, let us discuss the FTMW data measured for the mixed dimer and the corresponding results from our model calculations. In the molecular beam with neon as carrier gas only (C6D6)C(C6H6)S could be observed.28 The splittings measured are lower by about 30% than for the normal (C6H6)2 isotopologue. In the calculations we investigated both mixed dimers with C6D6 in the cap and with C6D6 in the stem. Since it is basically the sixfold hindered rotation of the stem that causes the observed 1:2:1 tunneling splitting pattern, one would expect the same splittings as in (C6H6)2 when C6D6 is in the cap. The only parameters we needed to change in our calculations are the reduced mass μAB and the monomer rotational constants, B for the cap and C for the stem. Another parameter that should possibly be changed is the fixed value of R used in the model. Practically no change in R is expected when C6D6 is in the cap, because the cap C–D groups are not involved in the intermolecular bond. A small reduction of R might occur when C6D6 is in the stem, because in that case one of the stem C–D groups sticks into the π-electron cloud of the cap and the C–D bond is slightly shorter than the C–H bond. In Tables 8 and 9 we present the results calculated with the same value R = 9.42a0 as used for the homodimer (C6H6)2; the effects of changes in R were estimated by comparison of these results with data calculated for other values of R. The splittings extracted from the experimental data in Table 3 are also included in Table 8.
| J′, K′ ← J, K | p tilt = + | p tilt = − | Measured | ||||||
|---|---|---|---|---|---|---|---|---|---|
| 5, 0 ← 4, 0 | 36.6 | 72.9 | 36.4 | 37.2 | 74.6 | 37.4 | 29.5 | 58.5 | 27.7 |
| 5, 1 ← 4, 1 | 36.7 | 73.1 | 36.5 | 37.3 | 74.8 | 37.5 | 32.3 | 70.5 | 32.0 |
| 6, 2 ← 5, 2 | 43.0 | 85.9 | 42.8 | 43.8 | 87.9 | 44.0 | 52.1 | 101.1 | 49.4 |
| 7, 0 ← 6, 0 | 48.0 | 95.7 | 47.7 | 48.9 | 97.9 | 49.1 | 50.8 | 96.1 | 50.9 |
| 7, 1 ← 6, 1 | 48.1 | 96.0 | 47.9 | 49.0 | 98.2 | 49.2 | 51.6 | 103.1 | 51.1 |
| 7, 2 ← 6, 2 | 48.5 | 96.7 | 48.3 | 49.4 | 99.0 | 49.6 | 58.4 | 116.6 | 60.8 |
| 8, 1 ← 7, 1 | 52.7 | 105.3 | 52.5 | 53.8 | 107.7 | 54.0 | 59.4 | 116.8 | 61.0 |
| 9, 1 ← 8, 1 | 56.6 | 113.0 | 56.4 | 57.7 | 115.6 | 57.9 | 78.6 | 121.9 | 79.2 |
| J′, K′ ← J, K | p tilt = + | p tilt = − | ||||
|---|---|---|---|---|---|---|
| 5, 0 ← 4, 0 | 21.5 | 43.0 | 21.5 | 21.9 | 43.8 | 21.9 |
| 5, 1 ← 4, 1 | 21.6 | 43.2 | 21.6 | 22.0 | 44.0 | 22.0 |
| 6, 2 ← 5, 2 | 25.2 | 50.3 | 25.1 | 25.6 | 51.2 | 25.6 |
| 7, 0 ← 6, 0 | 27.5 | 54.9 | 27.4 | 27.9 | 55.9 | 28.0 |
| 7, 1 ← 6, 1 | 27.6 | 55.1 | 27.5 | 28.0 | 56.1 | 28.1 |
| 7, 2 ← 6, 2 | 27.9 | 55.8 | 27.9 | 28.4 | 56.8 | 28.4 |
| 8, 1 ← 7, 1 | 29.7 | 59.3 | 29.6 | 30.2 | 60.5 | 30.3 |
| 9, 1 ← 8, 1 | 31.2 | 62.3 | 31.1 | 31.7 | 63.5 | 31.8 |
The results show, as expected, that the reduction of the quartet tunneling splittings is larger when C6D6 is the stem than when it is the cap. Also with C6D6 in the cap it is substantial, however, which implies that not only the stem hindered rotation is involved in the tunneling process but also the cap tilt motion. As discussed above, these motions are coupled through the potential energy surface as well as by kinetic coupling between the monomer angular momenta. The splittings in Table 8 calculated for the mixed dimer with C6D6 in the cap are reduced with respect to the (C6H6)2 data by about 25%, and those in Table 9 calculated for the mixed dimer with C6D6 in the stem by about a factor of 2. Since the corresponding reduction in the experimental splittings is about 30%, best agreement with the FTMW data is obtained for the dimer with C6D6 in the cap. This is another confirmation of the earlier observation28 that only the mixed dimer with C6D6 in the cap survives in the molecular beam with neon as the carrier gas.
A further reduction of the splittings may originate from the effect of isotope substitution on the intermolecular bond length R. As already mentioned, we expect that the average value of R in (C6H6)2 will practically not change when the C6H6 monomer in the cap is replaced by C6D6. A slight decrease of R will probably occur when the stem monomer is replaced. Such a small decrease of R will lead to higher barriers in the potential surface and further reduce the (already too small) tunneling splittings for the dimer with C6D6 in the stem.
B. Intensities
The four lines in the quartets for each of the rotational transitions in the FTMW spectrum show a nearly constant intensity ratio of 3:2:2:1, with deviations of about 20% and independent of K being even or odd. The lowest-frequency component of each quartet has the largest intensity. These intensities are determined by three factors: the nuclear spin statistical weights of the levels involved in the transitions, the populations of the initial levels, and the transition line strengths. Two ingredients are needed to calculate the relative line strengths of the transitions between the levels with kstem = 0, 1, 2, 3 that produce the four lines in the observed quartets: the wave functions of the initial and final states and the dipole function. The wave functions were computed in our 2D model with the inclusion of overall rotation. Two important contributions to the dipole function are given above. Eqn (5) and (6) describe the first and dominant contribution consisting of the dipole induced on each monomer by the quadrupole moment of the other monomer. This long range contribution, proportional to R−4, is independent of the stem rotation angle γB, so we also constructed a short range contribution described by eqn (9) that depends on both βA and γB.
Numerical results are not given, because the calculated line strengths depend on the parameters used in the dipole function and their absolute values are not very interesting. It is the relative intensities of the four lines in the tunneling quartets associated with kstem = 0, 1, 2, 3 that we are interested in. It follows from our calculations that the transition line strengths calculated for these four lines are practically equal, independently of the values of the parameters used in the long and short range dipole functions. So the intensity ratio of 3:2:2:1 of the lines in the quartets observed in the FTMW spectrum must be due to the nuclear spin statistical weights and/or the populations of the initial levels.
At higher temperature the Boltzmann factors of the different nuclear spin species of the benzene dimer are nearly equal and their relative populations are completely determined by the nuclear spin statistical weights. The spin weights of different levels follow directly from the irreps of the molecular symmetry (or permutation-inversion) group to which these levels belong.12,23,24 The molecular symmetry group of the TT equilibrium structure is Cs(M). Tunneling between equivalent minima increases the order of this group and the full cluster tunneling (FCT) group,45i.e., the molecular symmetry group of the benzene dimer in which all monomer rotations are “feasible”, is G576. Tunneling is called feasible when it produces measurable level splittings, which in the benzene dimer does probably not apply to cap turnover and cap–stem interchange tunneling. In ref. 12 and in the present paper it was shown that all other internal motions—cap rotation tunneling, tilt tunneling, and stem rotation tunneling—are feasible. This yields G144 as the molecular symmetry group. The rotational constants of benzene are rather small, so the temperature at which this statistical limit is reached is relatively low. Attempts to explain the observed intensity ratio by just using the G144 nuclear spin weights of the dimer levels with kstem = 0, 1, 2, 3 were not successful, however.
There are several indications that the populations of the levels of dimers in molecular beams are determined by the process of dimer formation and equilibration in the expansion region. It was found, for example, for the H2O–H2 complex46–48 that probably all four nuclear spin species with para/orthoH2O and para/ortho H2 are formed in first instance by H2O–H2 collisions, but that only the two dimer species with ortho H2 could be finally detected in the beam. This could be explained by the kinetics that takes place in the expansion part of the beam, where the complex is formed. This kinetics is determined by the dissociation energies D0 of the four different (p–p, p–o, o–p, o–o) dimer species, relative to the corresponding monomers. The D0 values of the two species with ortho H2 are larger by more than 20 cm−1 than the D0 values of the dimers with para H2.46 It was assumed that during the formation stage of the dimers they are first formed statistically, depending on the monomer densities in the beam and the monomer nuclear spin weights, but that additional collisions shift the populations more or less to the equilibrium of the pH2/oH2 exchange reaction. Since H2O–oH2 is more stable than H2O–pH2 by more than 20 cm−1 and the beam temperature was about 5 K; this strongly increases the populations of the (observed) H2O–oH2 complexes relative to the (not observed) H2O–pH2 complexes.
For the benzene dimer the energy differences between the different nuclear spin species are much smaller, but also the ultimate beam temperature is lower, about 2 K. There are strong indications that these small energy differences play an important role in determining the populations of the different species. It was found,28 for example, for the mixed C6D6–C6H6 dimer that (except in helium beams) only the species with C6D6 in the cap survives in the beam. The explanation28 was similar to the explanation for the H2O–H2 complex;46–48 it was also based on the assumption that both the dimers with C6D6 in the cap or C6D6 in the stem are initially formed in the collision region of the beam, and that an exchange reaction takes place which is driven by the small difference in D0 between these two species (estimated to be 2 cm−1 (ref. 28)).
Hence, it is probable that the differences in D0 values of (C6H6)2 for the different kstem and kcap levels will affect the populations of these levels in the dimer formation/equilibration stage. The C6H6 monomer has different species with k = 0, 1, 2, and 3, with ground state rotational energies of 0, 0.28, 0.76, and 1.42 cm−1. The D0 values that determine the stability of the different dimer species depend on both kstem and kcap. Actually, the value of kstem is much more relevant for dimer stability than the value of kcap, because the cap shows nearly unhindered rotation in the dimer, and the energy differences between dimer levels with different kcap12 almost compensate the energy differences between the corresponding free monomer rotational levels. The energy differences between the dimer stem rotation tunneling levels with different kstem = 0, 1, 2, 3 are only about 1 MHz, see Table 6, so the difference in the corresponding monomer energies is fully reflected in the D0 values. Hence, the states with kstem = 3 are more stable than the states with kstem = 0 by about 1.42 cm−1, and the states with kstem = 2 and 1 are more stable by about 0.76 and 0.28 cm−1. Therefore, the states with kstem = 3 are mostly populated, and the populations decrease for kstem = 2, 1, and 0. If the relative populations were given by Boltzmann factors at T = 2 K they would be 2.8, 1.7, 1.2, 1.0 for kstem = 3, 2, 1, 0. The populations of the tilt tunneling levels probably obey the same rule. Tilt levels with ptilt = − are higher than the levels with ptilt = + by about 1 cm−1,12 which will cause the lower levels with ptilt = + to be more populated by about a factor of 2.
The molecular symmetry group D6h(M) of the C6H6 monomer is given in Table A-11 of ref. 45. The nuclear spin weights are given in Table 10. The weights for the monomer levels with k (mod 6) = 0 and 3 alternate between the A1, A2 and B1, B2 values for even and odd rotational angular momentum j. If we assume that the monomer angular momenta are completely quenched in the dimer and average the weights over the values in Table 10 for even and odd j, the dimer levels with kstem = 0, 1, 2, 3 correspond to monomer levels with weights 5, 11, 9, 7, respectively. At this stage, let us remind the reader of our assignment of the lines in the quartets: for ptilt = + the four lines correspond in increasing frequency order to kstem = 3, 2, 1, 0, for ptilt = − to kstem = 0, 1, 2, 3. Would we assume that only the lower tilt levels with ptilt = + are occupied and that all cap levels with kcap = 0, 1, 2, 3 contribute equally, and neglect the preferential formation of the dimer in its levels with higher kstem, the intensity ratio of the four lines in the stem rotation tunneling quartets would be 7:9:11:5, i.e., 1.4:1.8:2.2:1. If we take into account that the dimer is preferentially formed in its levels with higher kstem and ptilt = +, the lower frequency lines in the quartets (especially the first line with kstem = 3) become more intense. Thus, the experimentally observed intensity ratio of about 3:2:2:1 is rationalized.
 ;
; VI. Summary and conclusions
In our combined theoretical and microwave spectroscopic study, we unravel the internal dynamics of the benzene dimer, a benchmark system for studying dispersion forces. We observe a characteristic quartet tunneling splitting pattern in our microwave spectra for two benzene dimer isotopologues, the homodimer (C6H6)2 and the mixed dimer (C6D6)C(C6H6)S. Through the use of a reduced-dimensionality approach that includes two of the six intermolecular coordinates and the overall rotation of the dimer, we can assign these splittings to a concerted tunneling motion that involves stem hindered rotation and tilt tunneling. The 2D potential surface used in this approach is a cut of the 6D ab initio intermolecular potential for the benzene dimer from ref. 12, so no fitting of the potential to the experimental data is involved. As in 1D model calculations for stem hindered rotation only10,12 the calculated levels occur in quartets with a 1:2:1 ratio of the splittings between consecutive levels typical for tunneling in a V6 potential. However, the 2D approach combining stem rotation with tilt tunneling and overall rotation of the complex is essential to obtain realistic splittings that are in semi-quantitative agreement with the measured data. Moreover, our model predicts the increase of the splittings with J and the smaller increase with K, in qualitative agreement with the experimental observations. Given the simplifications made in the reduced-dimensionality model, we could not have expected better.
For (C6H6)2, the experimentally determined intensities of the four quartet lines show a 3:2:2:1 ratio that does not agree with the 1.4:1.8:2.2:1 ratio obtained from dimer nuclear spin statistical weights only. The experimentally observed intensities can be explained if the populations of different dimer nuclear spin species in the beam are also taken into account. These populations are determined by the benzene monomer nuclear spin weights and by small differences in the dissociation energies D0 of different dimer nuclear spin species that play a role in the dimer formation and equilibration process in the molecular beam close to the nozzle. The same process has already been shown to explain the populations of different nuclear spin species for other weakly bound complexes46–48 and the preferential formation of mixed benzene dimers with the (C6D6)C(C6H6)S structure.28
The concerted stem rotation and tilt tunneling motion also explain the observed reduction of the tunneling splittings for the mixed dimer (C6D6)C(C6H6)S as compared to (C6H6)2. This reduction was surprising at first glance, since the splittings were assigned to be due to stem rotation tunneling and the C6D6 monomer forms the cap of the TT structure. However, the combined process of stem rotation and tilt tunneling is influenced by a change of the cap's moment of inertia. Our theoretical approach, in which the two internal motions are coupled both by the potential and by kinetic coupling, quantitatively reproduces the observed reduction of the tunneling splittings. Summarizing, we conclude that our model has indeed uncovered the mechanism that causes the tunneling splittings found in the FTMW spectra of the benzene dimer.
Acknowledgements
We thank Prof. Gerrit Groenenboom for his useful comments on the manuscript. Ad van der Avoird thanks the Alexander von Humboldt foundation for a Humboldt Senior Research Award. P. R. Bunker thanks the Fritz-Haber-Institut for continuing hospitality. Melanie Schnell thanks the Fonds der Chemischen Industrie for Financial Support via a Dozentenstipendium, and Jens-Uwe Grabow acknowledges financial support from the Land Niedersachsen and the Deutsche Forschungsgemeinschaft.References
- M. L. Waters, Curr. Opin. Chem. Biol., 2002, 6, 736–741 CrossRef CAS.
- L. Serrano, M. Bycroft and A. R. Fersht, J. Mol. Biol., 1991, 218, 465–475 CrossRef CAS.
- S. Burley and G. Petsko, Science, 1985, 229, 23–28 CrossRef CAS.
- V. R. Cooper, T. Thonhauser, A. Puzder, E. Schröder, B. I. Lundqvist and D. C. Langreth, J. Am. Chem. Soc., 2008, 130, 1304–1308 CrossRef CAS.
- X. Huang, D. Shullenberger and E. Long, Biochem. Biophys. Res. Commun., 1994, 198, 712–719 CrossRef CAS.
- L. R. Rutledge, L. S. Campbell-Verduyn and S. D. Wetmore, Chem. Phys. Lett., 2007, 444, 167–175 CrossRef CAS.
- K. C. Janda, J. C. Hemminger, J. S. Winn, S. E. Novick, S. J. Harris and W. Klemperer, J. Chem. Phys., 1975, 63, 1419–1421 CrossRef CAS.
- B. F. Henson, G. V. Hartland, V. A. Venturo and P. M. Felker, J. Chem. Phys., 1992, 97, 2189–2208 CrossRef CAS.
- E. Arunan and H. S. Gutowsky, J. Chem. Phys., 1993, 98, 4294–4296 CrossRef CAS.
- V. Špirko, O. Engkvist, P. Soldan, H. L. Selzle and E. W. Schlag, J. Chem. Phys., 1999, 111, 572 CrossRef CAS.
- R. Podeszwa, R. Bukowski and K. Szalewicz, J. Phys. Chem. A, 2006, 110, 10345–10354 CrossRef CAS.
- A. van der Avoird, R. Podeszwa, K. Szalewicz, C. Leforestier, R. van Harrevelt, P. R. Bunker, M. Schnell, G. von Helden and G. Meijer, Phys. Chem. Chem. Phys., 2010, 12, 8219–8240 RSC.
- E. H. T. Olthof, A. van der Avoird and P. E. S. Wormer, J. Chem. Phys., 1994, 101, 8430–8442 CrossRef.
- C. Leforestier, L. B. Braly, K. Liu, M. J. Elrod and R. J. Saykally, J. Chem. Phys., 1997, 106, 8527 CrossRef CAS.
- H. Chen, S. Liu and J. C. Light, J. Chem. Phys., 1999, 110, 168 CrossRef CAS.
- G. C. Groenenboom, P. E. S. Wormer, A. van der Avoird, E. M. Mas, R. Bukowski and K. Szalewicz, J. Chem. Phys., 2000, 113, 6702–6715 CrossRef CAS.
- R. S. Fellers, L. B. Braly, R. J. Saykally and C. Leforestier, J. Chem. Phys., 1999, 110, 6306 CrossRef CAS.
- R. S. Fellers, C. Leforestier, L. B. Braly, M. G. Brown and R. J. Saykally, Science, 1999, 284, 945–948 CrossRef CAS.
- N. Goldman, R. Fellers, M. Brown, L. Braly, C. Keoshian, C. Leforestier and R. Saykally, J. Chem. Phys., 2002, 116, 10148–10163 CrossRef CAS.
- R. Bukowski, K. Szalewicz, G. C. Groenenboom and A. van der Avoird, Science, 2007, 315, 1249–1252 CrossRef CAS.
- R. Bukowski, K. Szalewicz, G. C. Groenenboom and A. van der Avoird, J. Chem. Phys., 2008, 128, 094314 CrossRef.
- W. Cencek, K. Szalewicz, C. Leforestier, R. van Harrevelt and A. van der Avoird, Phys. Chem. Chem. Phys., 2008, 10, 4716 RSC.
- J. A. Odutola, D. L. Alvis, C. W. Curtis and T. R. Dyke, Mol. Phys., 1981, 42, 267 CrossRef CAS.
- R. Schmied and K. K. Lehmann, J. Mol. Spectrosc., 2004, 226, 201 CrossRef CAS.
- M. Schnell, U. Erlekam, P. R. Bunker, G. von Helden, J.-U. Grabow, G. Meijer and A. van der Avoird, Angew. Chem., Int. Ed., 2013, 52 DOI:10.1002/anie.201300653.
- D. Banser, M. Schnell, J.-U. Grabow, E. J. Cocinero, A. Lesarri and J. L. Alonso, Angew. Chem., Int. Ed., 2005, 44, 6311–6315 CrossRef CAS.
- J.-U. Grabow, W. Stahl and H. Dreizler, Rev. Sci. Instrum., 1996, 67, 4072–4084 CrossRef CAS.
- U. Erlekam, M. Frankowski, G. von Helden and G. Meijer, Phys. Chem. Chem. Phys., 2007, 9, 3786–3789 RSC.
- M. Schnell, D. Banser and J.-U. Grabow, Rev. Sci. Instrum., 2004, 75, 2111–2115 CrossRef CAS.
- J. M. L. J. Reinartz and A. Dymanus, Chem. Phys. Lett., 1974, 24, 346–351 CrossRef CAS.
- F. Filsinger, K. Wohlfart, M. Schnell, J.-U. Grabow and J. Küpper, Phys. Chem. Chem. Phys., 2008, 10, 666–673 RSC.
- W. Jarzeba, V. V. Matylitsky, C. Riehn and B. Brutschy, Chem. Phys. Lett., 2003, 368, 680–689 CrossRef CAS.
- D. T. Colbert and W. H. Miller, J. Chem. Phys., 1992, 96, 1982 CrossRef CAS.
- G. C. Groenenboom and D. T. Colbert, J. Chem. Phys., 1993, 99, 9681–9696 CrossRef CAS.
- Actually, there are levels with kstem = 3±; the wave functions with kstem = 3 ≡ 3+ are symmetric combinations of the basis functions with kB = ±3, ±9, etc.; they belong to the tunneling quartets. Wave functions with kstem = 3− are antisymmetric combinations of these basis functions; these states are vibrationally excited in the hindered stem rotation potential and much higher in energy.
- D. M. Brink and G. R. Satchler, Angular Momentum, Clarendon, Oxford, 3rd edn, 1993 Search PubMed.
- A. van der Avoird, P. E. S. Wormer and R. Moszynski, Chem. Rev., 1994, 94, 1931–1974 CrossRef CAS.
- M. R. Battaglia, A. D. Buckingham and J. Williams, Chem. Phys. Lett., 1981, 78, 421 CrossRef CAS.
- G. R. Alms, A. K. Burnham and W. H. Flygare, J. Chem. Phys., 1975, 63, 3321 CrossRef CAS.
- A. Proutiere and M. Camail, Mol. Phys., 1975, 29, 1473 Search PubMed.
- T. Brupbacher and A. Bauder, J. Chem. Phys., 1993, 99, 9394 CrossRef CAS.
- E. Arunan, T. Emilsson, H. S. Gutowsky, G. T. Fraser, G. de Olivera and C. E. Dykstra, J. Chem. Phys., 2002, 117, 9766 CrossRef CAS.
- C. H. Townes and A. L. Schawlow, Microwave Spectroscopy, Dover Publications, New York, 1975 Search PubMed.
- P. Hobza, H. L. Selzle and E. W. Schlag, J. Chem. Phys., 1990, 93, 5893–5897 CrossRef CAS.
- P. R. Bunker and P. Jensen, Molecular Symmetry and Spectroscopy, NRC Research Press, Ottawa, Ontario, Canada, 2nd edn, 1998 Search PubMed.
- A. van der Avoird and D. J. Nesbitt, J. Chem. Phys., 2011, 134, 044314 CrossRef.
- A. van der Avoird, Y. Scribano, A. Faure, M. J. Weida, J. R. Fair and D. J. Nesbitt, Chem. Phys., 2012, 399, 28–38 Search PubMed.
- M. P. Ziemkiewicz, C. Pluetzer, D. J. Nesbitt, Y. Scribano, A. Faure and A. van der Avoird, J. Chem. Phys., 2012, 137, 084301 Search PubMed.
| This journal is © the Owner Societies 2013 |