 Open Access Article
 This Open Access Article is licensed under a
 Creative Commons Attribution 3.0 Unported Licence
Time-resolved photoelectron spectroscopy of adenine and adenosine in aqueous solution
Franziska
Buchner
,
Hans-Hermann
Ritze
,
Jan
Lahl†
and
Andrea
Lübcke‡
*
Max-Born-Institut für nichtlineare Optik und Kurzzeitspektroskopie, Max-Born-Straße 2A, 12489 Berlin, Germany. E-mail: luebcke@mbi-berlin.de
First published on 7th May 2013
Abstract
Time-resolved photoelectron spectroscopy is applied to study the excited state dynamics of the DNA base adenine and its ribonucleoside adenosine in aqueous solution for pump and probe photon energies in the range between 4.66 eV and 5.21 eV. We follow the evolution of the prepared excited state on the potential energy surface and retrieve lifetimes of the S1 state under different excitation conditions.
1 Introduction
Interaction of ultraviolet light with DNA molecules may lead to photodamage and consequently may cause development of cancer. However, natural DNA bases are much less photoreactive than similar molecules.1 One reason for the high photostability of the DNA bases is their ultrafast electronic deactivation processes that prevent the molecules from severe changes such as bond breakage. The mechanisms of these ultrafast processes have been studied over the recent decade1–8 but are still not fully understood.Motivated by recent developments in fs-liquid jet photoelectron spectroscopy,9,10 we used this technique to study the ultrafast radiationless relaxation mechanism of the DNA base adenine and its ribonucleoside adenosine in aqueous solution. The fs-photoelectron spectroscopy provides direct access to the (time-dependent) binding energy of the excited state and maps the excited state potential energy hyper surface onto the ionization continuum. Furthermore, the time-dependent photoelectron signal yields conclusions on the excited state population dynamics.
As the other DNA bases, adenine may exist in different tautomeric forms. As evident from theory11–13 and experiment,14–17 adenine shows up in aqueous solution in two coexisting tautomers: the 7H-Ade and the 9H-Ade. Fig. 1 shows the structure of these two tautomers. The excited state lifetimes for 9H- and 7H-Ade in water are on the order of 0.2–0.6 ps and 9 ps, respectively.18–20 In the adenosine molecule, the ribose moiety replaces the hydrogen at the N9-atom and therefore prevents the formation of the 7H tautomer. Correspondingly, the value for the excited state lifetime of adenosine was determined to be 0.3–0.5 ps.18,20–22
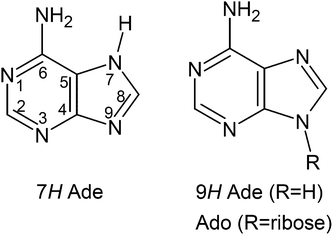 | ||
| Fig. 1 Structures of the 7H and 9H tautomer of adenine (Ade). In adenosine (Ado), the ribose replaces the hydrogen at position 9 and therefore prevents tautomerization. | ||
Theoretical studies of isolated adenine (especially the 9H tautomer) in the gas phase identified several conical intersections (CIs) relevant for the excited state relaxation (ππ*/nπ*, ππ*/πσ*, nπ*/S0, ππ*/S0, πσ*/S0)3–8,23–26 (and references therein). These CIs are connected with geometrical changes of the molecule including an envelope puckering at the C2-atom (2E, ππ*/S0), a pronounced out-of-plane distortion of the C6-atom and the amino group (1S6, nπ*/S0), stretch of the N9–H bond (πσ*/S0) and/or C8–N9 bond breaking. The type of conical intersections was classified according to the scheme outlined in Fig. 1 of ref. 27. For excitation energies of around 5.0 eV (the maximum of the absorption band in the gas phase), two mechanisms were found to explain the lifetimes observed in experiments: ππ* → S0via the 2E CI and ππ* → nπ* are responsible for the ultrafast decay below 200 fs, whereas nπ* → S0via the 1S6 CI explains the second, slightly slower lifetime below 1.0 ps. For excitation energies of around 4.7 eV and above 5.3 eV, another channel arises: ππ* → πσ* → S0 which is associated with hydrogen abstraction.
Theoretical studies of adenine in solution are rare because not only all the relevant electronic states have to be described realistically but also the effect of the surrounding molecules has to be included. There have been different approaches to include the effect of the environment on the relaxation of adenine.26,28–31 Mitrić et al. used the time-dependent density functional tight binding method combined with a surface hopping algorithm to calculate non-adiabatic relaxation of microsolvated adenine.31 After excitation with 260 nm light into S3, they found a 16 fs transition into S1 and a time constant of 200 fs for repopulation of the ground state. Lan et al. recently studied the non-adiabatic dynamics of 9H-Ade in aqueous solution using surface-hopping quantum mechanical-molecular mechanical (QM/MM) simulations.26 They found a relaxation mechanism that also appears for the gas phase (a two-step ππ* → nπ* → S0 pathway via the 1S6-CI). Due to a slight non-planarity of the molecule in solution (out-of-plane amino group), the molecule is preformed for the 1S6 conical intersection. Thus, this pathway is dynamically favored and dominates the relaxation. This also explains the faster relaxation in solution with respect to the gas phase.
Lan et al. also calculated the vertical excitation energies of the first three excited states and found S1 between 4.45 and 4.69 eV, whereas S2 and S3 lie within 0.1 eV at 4.69–4.95 eV. After excitation of S2, Lan et al. found an ultrafast population transfer into S1 with a time constant of 40 fs and a time constant of 410 fs for internal conversion from S1 into the ground state.
For the second tautomer (7H-Ade), there has been significantly less theoretical activity. Marian et al. found some higher potential barriers for the relaxation into the ground state for bare 7H-Ade compared to 9H-Ade.32 These barriers would explain the larger excited state lifetime assigned to 7H-Ade in solution.
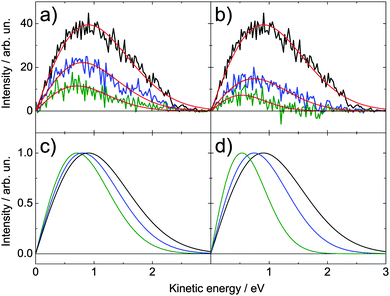
In Fig. 2, a schematic of the potential energy curves for the 9H tautomer of adenine in water is presented. To define the relative position of the curves, experimental and theoretical values (orange) are used:
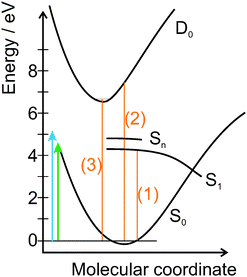 | ||
| Fig. 2 Schematic representation of the potential energy curves of 9H tautomer of adenine in water, where S0 is the ground state, S1 the lowest limit of the excited state and D0 the first ionic state. Higher excited states are referred to as Sn. The arrows indicate the photon energies of pump and probe pulses (4.66 eV and 5.21 eV). The relative positions of the curves are determined by (1) the onset of the absorption spectrum, (2) the vertical ionization energy,33 and (3) the adiabatic ionization potential.34 For details see the text. | ||
(1) UV/Vis spectra show that the absorption of adenine in water starts at about 4.3 eV. This is the lowest absorbable photon energy and therefore represents the 0–0 transition between the ground state S0 and the first excited state S1.
(2) The vertical ionization energy of adenine in aqueous solution was deduced experimentally to be 7.5 eV.33
(3) The adiabatic ionization potential of adenosine in water has been calculated using ab initio methods together with the equilibrium polarizable continuum model to be about 6.6 eV.34
The general shape of the excited state S1 is adapted from Blancafort et al., who calculated the excited-state potential energy surface for different relaxation paths:35 in the region of vertical excitation from the ground state, the excited state S1 is quite flat and bends downwards near the conical intersection (there are several conical intersections with the ground state; we did not pick any specific one). According to Lan et al., the higher excited states S2 and S3 lie very close together, directly above 4.7 eV.26 We indicated these by Sn.
2 Experiment
We perform time-resolved photoelectron spectroscopy of liquid samples using the liquid jet technology.36 A liquid jet with a diameter of about 10 μm is generated by pushing the sample solution through a thin fused silica nozzle into a vacuum using an HPLC pump. The jet velocity is about 50 m s−1. In the first few millimeters the jet flows laminarly before it breaks apart into droplets. The experiment is carried out at the laminar part of the jet.A Ti:sapphire laser system delivers 40 fs pulses at 800 nm. One part of the laser output is used to pump a parametric optical generator (light conversion, TOPAS) and to deliver pulses between 238 nm (5.21 eV) and 248 nm (5.00 eV). The remaining laser output is used to generate light at 266 nm (4.66 eV) by sum frequency generation in BBO crystals. The UV pulses have a duration of ∼80 fs and are attenuated to 40–50 nJ for the pump–probe experiment. With our pulse duration of about 80 fs, we will not resolve the fast transition from Sn to S1. Therefore, the observed dynamics should be dominated by the relaxation of S1 into the ground state.
Adenine and adenosine significantly absorb light at all wavelengths used in this experiment.37 We therefore expect to observe excited state dynamics initiated by either UV pulse.
The pulses are focused onto the liquid jet to focal spot sizes of about 100 μm. A chopper in each beam path allows us to separately measure and subtract the one-color multi-photon signals (pump-only and probe-only) from the two-color signal on a pulse-to-pulse basis.
The photoelectrons are guided into a time-of-flight spectrometer by a magnetic bottle and detected using a chevron-type MCP-detector. Calibration with nitric oxide gas transforms the measured TOF-spectra into electron kinetic energy. Further details on the experimental setup and calibration can be found elsewhere.38
The sample solution contains 1 mM of adenine or adenosine and 1 mM of a pH 8 buffer made of tris(hydroxymethyl)aminomethane (TRIS) and hydrochloric acid. Furthermore, we added 30 mM sodium chloride to prevent charging of the liquid jet.39 The sample solutions are prepared using demineralized water (residual conductivity = 0.25 μS). DNA bases, nucleosides, and TRIS were purchased from Sigma-Aldrich Co. and sodium chloride was purchased from Merck. All chemicals were used without further purification. At the given pulse intensities the sodium chloride does not contribute significantly to the photoelectron spectra as evident from spectra for a sample solution without base or nucleoside (cf.Fig. 4, 8a and 9a).
3 Results and discussion
Fig. 3 shows the time-resolved photoelectron spectra of adenine (a) and adenosine (b) in aqueous solution. These spectra reveal the time-dependent kinetic energy distribution of the photoelectrons and the time-dependent population of the excited state. At positive delays, molecules are excited by 266 nm light and photoionized by 238 nm light (at negative delays: vice versa). Around the temporal overlap (delay ∼0 ps), we observe a strong and short-lived photoelectron signal for both molecules. The kinetic energy distribution is very broad and covers a range larger than 2 eV. In the case of adenine (Fig. 3a), a significant fraction of the signal persists for several ps in the positive delay direction, i.e. after excitation with 266 nm light. This longer-lived signal is due to the 7H tautomeric form of adenine present in solution, while the short-lived signal is due to the 9H tautomer common to both molecules.19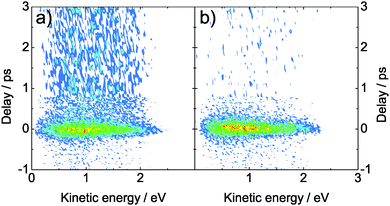 | ||
| Fig. 3 Time-resolved photoelectron spectra of (a) adenine and (b) adenosine. The molecules were excited with a 266 nm pulse (4.66 eV photon energy) and probed by 238 nm (5.21 eV photon energy). The one-color multi-photon signals have been subtracted. | ||
3.1 One-color two-photon photoionization of adenosine
For further analysis of the time-dependent spectra, it is very helpful, firstly to understand the one-color spectra. For simplicity, the examination of the one-color spectra will focus on adenosine because of the presence of only one tautomer. A vertical ionization energy of 7.5 eV for Ade and Ado in aqueous solution is inferred from EUV photoelectron spectroscopy.33 For a two-photon ionization process with 4.66 and 5.21 eV pulses, we would therefore expect the photoelectron band maximum at about 1.8 and 2.9 eV, respectively. In Fig. 4(a) we show the corresponding one-color two-photon photoelectron spectra of adenosine solution. The photoelectron band maximum is at 0.9 and 1.1 eV electron kinetic energy for two-photon ionization with 4.66 and 5.21 eV, respectively. This is significantly lower than the expected values. It is also remarkable that the positions of the band maxima do not differ by the difference in absorbed photon energy, i.e. 2 × (5.21 − 4.66) eV = 1.10 eV, but only by 0.2 eV. In Fig. 4(b), we show the one-color spectra on a logarithmic scale. It is evident that the photoelectron spectrum for the 5.21 eV pulse extends to significantly higher kinetic energies than the spectrum for the 4.66 eV pulse. We define the maximum kinetic energy as the intersection point between the high-energy tail of the spectrum and the noise level, and find 2.6 eV and 3.6 eV for the 4.66 eV and 5.21 eV pulses, respectively. In contrast to the position of the band maxima, the difference between the maximum kinetic energies agrees well with the difference in absorbed photon energy.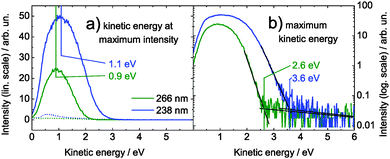 | ||
| Fig. 4 One-color, two-photon photoelectron spectra of 1 mM adenosine solution for 266 nm (green) and 238 nm (blue), corresponding to 4.66 and 5.21 eV, respectively. For each spectrum, the photoelectron band maximum (a) and the maximum kinetic energy (b) are identified. The dotted lines in (a) show the one-color photoelectron spectra of the buffer–NaCl solution for 266 nm and 248 nm (pulse energies were almost twice as high as for Ado). Note that the ordinate in (b) is shown on a logarithmic scale. | ||
We explain these observations by resonance enhanced 2-photon photoionization and initial dynamics of the excited state occurring within the pulse duration of ∼80 fs. The situation is sketched in Fig. 7(a) and (b). Absorption of a first photon prepares the excited state. The Franck–Condon region for the excitation step is indicated by a colored rectangle. For infinitely short pulses or negligible initial dynamics, we expect ionization from the Franck–Condon region. However, if the excited state evolves within the pulse duration, the second photon may ionize the molecule after nuclear reconfiguration has already started. This will result in lower photoelectron kinetic energies and photoelectron bands which are significantly broader than supported by the initial Franck–Condon region. As a result of the initial dynamics, the maximum of the photoelectron band cannot be related to the 1-photon ionization energy. The vertical ionization energy will be somewhat smaller than that derived from the band maximum. The maximum kinetic energy observed in the experiment can be assigned to the adiabatic (0–0) transition from the ground state S0 to the ionic state D0. We obtained an adiabatic (0–0) transition energy of (6.82 ± 0.15) eV with 5.21 eV pulses and (6.72 ± 0.15) eV with 4.66 eV pulses. Both values are in satisfactory agreement with the calculated value 6.6 eV.34 For the photoelectron spectrum obtained with 5.21 eV pulses (Fig. 7(b)), higher excited states Sn are populated by absorption of a first photon. These will decay to S1 within 40 fs.26 Along with the higher excess energy, this will significantly broaden the photoelectron band.
3.2 Time-dependent spectra of excited adenosine
Fig. 5 shows the pump–probe photoelectron spectrum of adenosine solution around the temporal overlap of the pulses, i.e. averaged over all spectra acquired at delays of (0 ± 100) fs. At the temporal overlap, we expect ionization after absorption of one photon from each pulse. Hence, the kinetic energy of the photoelectrons should be around (4.66 + 5.21 − 7.5) eV = 2.37 eV. As observed for the one-color spectra, the measured photoelectron band maximum (0.9 eV) is much lower than expected. From the maximum kinetic energy of 3.0 eV, we extract a value for the adiabatic (0–0) ionization potential of (6.87 ± 0.15) eV, again in reasonable agreement with the theoretical value of 6.6 eV.34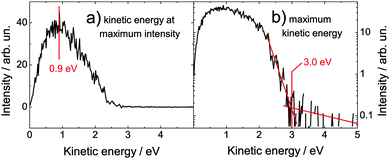 | ||
| Fig. 5 Time-resolved spectrum of adenosine solution at the temporal overlap (±0.1 ps) of both pulses (4.66 and 5.21 eV). The maximum kinetic energy is 3.0 eV. The one-color multi-photon signals have been subtracted. Note that the ordinate in (b) is scaled logarithmically. | ||
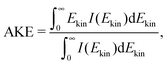
Fig. 6 shows the photoelectron spectrum at different delays for adenosine solution, (a), (c) excited with 4.66 eV and ionized with 5.21 eV, and (b), (d) vice versa. Fig. 6(a) and (b) show the raw spectra (each averaged over ±0.1 ps) with a fit to the function of type y = Axe(−Bx2). In Fig. 6(c) and (d) the fit maximum is scaled to 1 to illustrate the shift of the spectral weight and narrowing of the photoelectron band with increasing delay. The spectral shape of the photoelectron bands is intricate. Therefore, we describe spectral shifts in terms of the average kinetic energy (AKE)
 | (1) |
 | ||
| Fig. 6 Time-resolved spectra of adenosine (a) for excitation with 4.66 eV and ionization with 5.21 eV and (b) vice versa. In both cases, the spectra at delay times of 0 ps (black), 0.2 ps (blue) and 0.3 ps (green) are shown. Note that each spectrum is averaged over ±0.1 ps. These spectra were fitted with a function of the type y = Axe−Bx2. Sub-figures (c) and (d) show these fits scaled to the maximum of 1. | ||
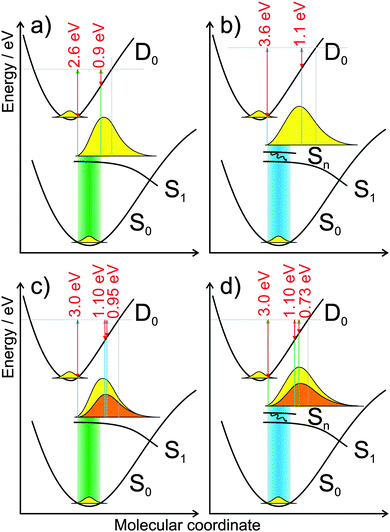 | ||
| Fig. 7 Potential energy curves from Fig. 2 adapted to the one-color two-photon ionization with (a) 4.66 eV and (b) 5.21 eV pulses and the pump probe processes (c and d). For the pump probe process: (c) excitation with 4.66 eV pulse and ionization with 5.21 eV, and (d) vice versa. Excitation is indicated by a broad colored area. The predicted 40 fs decay from Sn to S1 is indicated by a black arrow ((b) and (d)). The yellow shape symbolizes the excited moiety at the end of the pulse, when it is broadened and has started to relax. For the ionization step, the maximum kinetic energy and the photoelectron band maxima are shown by the red arrows (for the pump–probe process at delay times 0 ps and 0.3 ps). The yellow shape symbolizes the excited moiety at pump probe delay 0 ps, the orange shape at 0.3 ps. Grey horizontal lines mark the sum of the photon energies and grey vertical lines indicate the end of the Franck–Condon window for ionization. | ||
After excitation with 5.21 eV pulses, the AKE changes faster: 0.95 eV at 0.2 ps and 0.73 eV at 0.3 ps. This shift of 370 meV within 300 fs is illustrated in Fig. 7(d). Absorption of the first photon leads to an excited state higher than S1. Therefore, dynamics are accelerated by the initial Sn → S1 transition accompanied by a generation of vibrational excess energy reducing the average ionization energy.
3.3 Population dynamics of adenosine and adenine
For a quantitative analysis of the excited state lifetimes, the photoelectron signal is integrated over all kinetic energies and plotted versus delay time. In Fig. 8, such spectrally integrated signals at different probe wavelengths (248, 243 and 238 nm) are shown for adenosine. For each temporal direction, these time-dependent signals are fitted by a convolution of a sum of exponential decays and a Gaussian cross correlation function between pump and probe pulses. The cross correlation width was estimated to be 0.1 ps. The time traces are treated as a sum (red) of two components: one towards positive delays (green) and one towards negative delays (blue). The results of these fits are summarized in Table 1.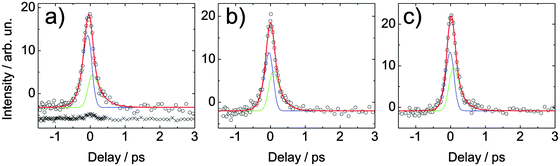 | ||
| Fig. 8 Spectrally integrated signal of adenosine in aqueous solution measured at different wavelengths. The solution was excited by a 266 nm (4.66 eV) pulse and probed by (a) 248 nm (5.00 eV), (b) 243 nm (5.10 eV) and (c) 238 nm (5.21 eV). Open circles are data points, the blue and green lines fit the population dynamics in the negative and the positive delay direction, respectively. The cumulative fit is shown in red. The lifetimes extracted from these fits are shown in Table 1. For comparison, also the signal of the buffer–NaCl solution is shown (crosses). It was measured at the same wavelength but at twice the pulse energy. For clarity, this signal is displaced vertically. | ||
| Photon energies/eV | Adenosine | Adenine | ||
|---|---|---|---|---|
| Pump | Probe | τ/fs | τ 1/fs | τ 2/ps |
| 4.66 | 5.00 | 250 ± 40 | 81 ± 7 | 2.8 ± 0.9 |
| 4.66 | 5.10 | 210 ± 20 | 76 ± 5 | 2.4 ± 0.8 |
| 4.66 | 5.21 | 210 ± 20 | 64 ± 2 | 8.5 ± 1.7 |
| 5.00 | 4.66 | 143 ± 6 | ||
| 5.10 | 4.66 | 125 ± 7 | ||
| 5.21 | 4.66 | 97 ± 5 | ||
For positive delays, the molecules are excited by the 266 nm pulse in each case. If the detected dynamics were limited by the accessibility of the Franck–Condon window of the ionization step, we would find longer lifetimes for larger probe photon energies. However, this is not true for adenosine. For 4.66 eV excitation, the extracted lifetimes τ are equal within the error bars (see Table 1). The averaged lifetime of (215 ± 20) fs is in the range of earlier results obtained from transient absorption by Pecourt et al.21 and fluorescence up-conversion by Onidas et al.,22 who found (290 ± 40) fs and (170 ± 10) fs, respectively. Pancur et al. found a somewhat larger value of (310 ± 50) fs for the excited state lifetime from their fluorescence up-conversion measurements.20
At negative delays, dynamics are initiated by pump pulses with photon energies between 5.00 and 5.21 eV and probed by 4.66 eV pulses. The excess energy introduced into the excited state rises when going from 5.00 eV in Fig. 8(a) to 5.21 eV in Fig. 8(c). With increasing excess energy in the S1 state the conical intersection to S0 can be reached in a shorter time; furthermore, also higher lying conical intersections may play an increasing role. Thus, a smaller time constant is expected. This effect is revealed by the extracted lifetimes τ: They decrease significantly from ∼140 fs for 5.00 eV excitation to ∼100 fs for 5.21 eV excitation. Similar behavior was found by Pancur et al.20 who measured fluorescence up-conversion of adenosine using tunable UV pump pulses. They found slightly shorter fluorescence lifetimes for excitation with <260 nm pulses compared to excitation with >260 nm pulses.
In Fig. 9, the time-dependent signal for adenine is shown for the same wavelength combinations. Compared to adenosine, a second time constant appears after excitation with 4.66 eV which is due to the 7H tautomer.19 This second lifetime seems to depend on the probe wavelength. With increasing probe photon energy the measured lifetime increases. As explained before, this behavior can be attributed to a longer residence within the Franck–Condon window for higher probe photon energies. It is interesting to note that our lifetime τ2 of (8.5 ± 1.7) ps obtained for the highest probe photon energy (5.21 eV) is in excellent agreement with the value of (8.4 ± 0.8) ps measured in time-resolved fluorescence up-conversion experiments.20 Thus, for the 5.21 eV probe photons, the Franck–Condon window for ionization is reached during the whole dynamics in the excited electronic state.
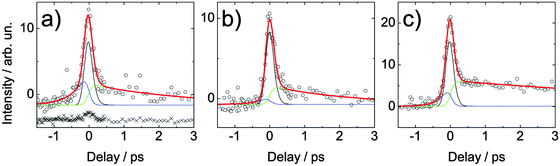 | ||
| Fig. 9 Spectrally integrated signal of adenine in aqueous solution. The solution was excited with a 266 nm (4.66 eV) pulse and probed by (a) 248 nm (5.00 eV), (b) 243 nm (5.10 eV) and (c) 238 nm (5.21 eV). The crosses in (a) depict the signal of the buffer–NaCl solution which is vertically offset for clarity. It was measured at the same wavelength but almost twice as high pulse energy. For clarity, the buffer signal is vertically displaced. | ||
At negative delays (for excitation with 5.0–5.2 eV pulses), we also expect to find this second lifetime for the 7H-adenine. The data, however, do not allow for a meaningful bi-exponential fit. Here, only a mono-exponential fit was applied yielding an average lifetime of (420 ± 160), (340 ± 650) and (270 ± 130) fs for excitation with 5.0, 5.1, and 5.2 eV pulses, respectively. The physical meaning of this single lifetime is very limited, since it represents two lifetimes and, additionally, it is afflicted with huge errors. Nevertheless, this average lifetime is much shorter than expected for the 7H-tautomer. We suppose that for a relatively low probe photon energy of 4.66 eV, the Franck–Condon window for photoionization is left already in the sub-picosecond region.
4 Conclusions
Using adenine and adenosine as examples, we have shown that time-resolved photoelectron spectroscopy using probe pulses in the UV range can be used to study the excited state dynamics of molecules in solution. The evolution of the excited state on the potential energy surface could be followed in time, even though significant nuclear rearrangement occurs already within our pulse duration of about 80 fs. Here, a significantly higher time-resolution would be desirable. However, different schemes for the UV generation would be required to achieve significantly shorter pulses in this spectral regime (i.e. non-collinear optical parametric amplification40 or four-wave mixing processes41).The excited state binding energy of adenosine, i.e. the energetic difference between the excited state and the ionic state strongly changes in time. Within 300 fs, the binding energy has increased by 150 meV and by 370 meV upon excitation with 266 nm and 238 nm pulses, respectively. This is in line with accelerated dynamics initiated by the higher excess energy introduced by the 238 nm pulses.
The time-dependent energy-integrated photoelectron signal describes the population of the excited state. Depending on the excitation conditions we observe lifetimes in the range of (100–215) fs for adenosine which is in agreement with transient absorption and fluorescence up-conversion data.18–22 However, in contrast to previous experiments, we do not probe the excited state in a small range of excited state geometries only. Our probe wavelength dependent measurement does not show any variation in the retrieved excited state lifetime for adenosine within experimental precision and therefore strongly indicates that we indeed observe the relevant features of the excited state evolution. The observed lifetimes are not limited by the accessibility of the Franck–Condon window in the ionization step.
We hope that our experimental work will trigger more theoretical investigations and will help to get deeper insight into the relevant relaxation pathways of the molecules in solution.
Acknowledgements
The authors thank F. Noack for his support by providing the laser system in the femtosecond application laboratory of the Max-Born-Institut Berlin. This work was financially supported by Deutsche Forschungsgemeinschaft, Project LU 1638/1-1.References
- C. E. Crespo-Hernández, B. Cohen, P. M. Hare and B. Kohler, Chem. Rev., 2004, 104, 1977 CrossRef.
- L. Serrano-Andrés and M. Merchán, J. Photochem. Photobiol., C, 2009, 10, 21 CrossRef.
- L. Serrano-Andrés, M. Merchán and A. C. Borin, Proc. Natl. Acad. Sci. U. S. A., 2006, 103, 8691 CrossRef.
- L. Blancafort, B. Cohen, P. M. Hare, B. Kohler and M. A. Robb, J. Phys. Chem. A, 2005, 109, 4431 CrossRef CAS.
- M. Barbatti and H. Lischka, J. Am. Chem. Soc., 2008, 6831, 130 Search PubMed.
- A. L. Sobolewski, W. Domcke, C. Dedonder-Lardeux and C. Jouvet, Phys. Chem. Chem. Phys., 2002, 4, 1093 RSC.
- S. Ullrich, T. Schultz, M. Z. Zgierski and A. Stolow, J. Am. Chem. Soc., 2004, 126, 2262 CrossRef CAS.
- M. Zierhut, W. Roth and I. Fischer, Phys. Chem. Chem. Phys., 2004, 6, 5178 RSC.
- A. Lübcke, F. Buchner, N. Heine, I. V. Hertel and T. Schultz, Phys. Chem. Chem. Phys., 2010, 12, 14629 RSC.
- Y. Tang, H. Shen, K. Sekiguchi, N. Kurahashi, T. Mizuno, Y.-I. Suzuki and T. Suzuki, Phys. Chem. Chem. Phys., 2010, 12, 3653 RSC.
- A. Holmén and A. Broo, Int. J. Quantum Chem., 1995, 22, 113 CrossRef.
- J. Gu and J. Leszczynski, J. Phys. Chem. A, 1999, 103, 2744 CrossRef CAS.
- A. Laxer, D. T. Major, H. E. Gottlieb and B. Fischer, J. Org. Chem., 2001, 66, 5463 CrossRef CAS.
- M. Dreyfus, G. Dodin, O. Bensaude and J. E. Dubois, J. Am. Chem. Soc., 1975, 97, 2369 CrossRef CAS.
- M. T. Chenon, R. J. Pugmire, D. M. Grant, R. P. Panzica and L. Townsend, J. Am. Chem. Soc., 1975, 97, 4636 CrossRef CAS.
- N. C. Gonnella, H. Nakanishi, J. B. Holtwick, D. S. Horowitz, K. Kanamori, N. J. Leonard and J. D. Roberts, J. Am. Chem. Soc., 1983, 105, 2050 CrossRef CAS.
- A. Holmén, J. Phys. Chem. A, 1997, 101, 4361 CrossRef.
- T. Gustavsson, A. Sharonov, D. Onidas and D. Markovitsi, Chem. Phys. Lett., 2002, 356, 49 CrossRef CAS.
- B. Cohen, P. M. Hare and B. Kohler, J. Am. Chem. Soc., 2003, 125, 13594 CrossRef CAS.
- T. Pancur, N. K. Schwalb, F. Renth and F. Temps, Chem. Phys., 2005, 313, 199 CrossRef CAS.
- J.-M. L. Pecourt, J. Peon and B. Kohler, J. Am. Chem. Soc., 2001, 123, 10370 CrossRef CAS.
- D. Onidas, D. Markovitsi, S. Marguet, A. Sharonov and T. Gustavsson, J. Phys. Chem. B, 2002, 106, 11367 CrossRef CAS.
- C. M. Marian, J. Chem. Phys., 2005, 122, 104314 CrossRef.
- S. Perun, A. L. Sobolewski and W. Domcke, J. Am. Chem. Soc., 2005, 127, 6257 CrossRef CAS.
- M. Barbatti, Z. Lan, R. Crespo-Otero, J. J. Szymczak, H. Lischka and W. Thiel, J. Chem. Phys., 2012, 137, 22A503 CrossRef.
- Z. Lan, Y. Lu, E. Fabiano and W. Thiel, ChemPhysChem, 2011, 12, 1989 CrossRef CAS.
- J. C. A. Boeyens, J. Cryst. Mol. Struct., 1978, 8, 317 CrossRef.
- B. Mennucci, A. Toniolo and J. Tomasi, J. Phys. Chem. A, 2001, 105, 4749 CrossRef CAS.
- S. Yamazaki and S. Kato, J. Am. Chem. Soc., 2007, 129, 2901 CrossRef CAS.
- V. Ludwig, Z. M. da Costa, M. S. do Amaral, A. C. Borin, S. Canuto and L. Serrano-Andrés, Chem. Phys. Lett., 2010, 492, 164 CrossRef CAS.
- R. Mitrić, U. Werner, M. Wohlgemuth, G. Seifert and V. Bonačić-Koutecký, J. Phys. Chem. A, 2009, 113, 12700 CrossRef.
- C. M. Marian, M. Kleinschmidt and J. Tatchen, Chem. Phys., 2008, 347, 346 CrossRef CAS.
- R. Seidel, PhD thesis, Technische Universitaet Berlin, 2011.
- E. Pluhařová, P. Jungwirth, S. E. Bradforth and P. Slaviček, J. Phys. Chem. B, 2011, 115, 1294 CrossRef , ESI†.
- L. Blancafort, J. Am. Chem. Soc., 2006, 128, 210 CrossRef CAS.
- M. Faubel, B. Steiner and J. P. Toennies, J. Chem. Phys., 1997, 106, 9013 CrossRef CAS.
- D. Voet, W. B. Gratzer, R. A. Cox and P. Doty, Biopolymers, 1963, 1, 193 CrossRef CAS.
- F. Buchner, A. Lübcke, N. Heine and T. Schultz, Rev. Sci. Instrum., 2010, 81, 113107 CrossRef.
- N. Preissler, F. Buchner, T. Schultz and A. Lübcke, J. Phys. Chem. B, 2013, 117, 2422 CrossRef CAS.
- L. Gundlach, R. Ernstorfer, E. Riedle, R. Eichberger and F. Willig, Appl. Phys. B: Lasers Opt., 2005, 80, 727 CrossRef CAS.
- T. Fuji, T. Horio and T. Suzuki, Opt. Lett., 2007, 32, 2481 CrossRef.
Footnotes |
| † Present address: TU Berlin, Institut für Optik und Atomare Physik, Hardenbergstraße 36, 10623 Berlin, Germany. |
| ‡ Present address: Laboratoire de Spectroscopie Ultrarapide, EPFL, 1015 Lausanne, Switzerland. |
| This journal is © the Owner Societies 2013 |