 Open Access Article
 This Open Access Article is licensed under a
 Creative Commons Attribution 3.0 Unported Licence
Synchrotron high energy X-ray methods coupled to phase sensitive analysis to characterize aging of solid catalysts with enhanced sensitivity
Davide
Ferri
*ab,
Mark A.
Newton
c,
Marco
Di Michiel
c,
Songhak
Yoon
b,
Gian Luca
Chiarello
b,
Valentina
Marchionni
ab,
Santhosh Kumar
Matam
b,
Myriam H.
Aguirre†
b,
Anke
Weidenkaff
b,
Fei
Wen
d and
Jürgen
Gieshoff
d
aPaul Scherrer Institute, CH-5232 Villigen PSI, Switzerland. E-mail: davide.ferri@psi.ch; Tel: +41 56 310 2781
bEmpa, Swiss Federal Laboratories for Materials Science and Technology, Laboratory for Solid State Chemistry and Catalysis, Ueberlandstrasse 129, CH-8600 Dübendorf, Switzerland
cEuropean Synchrotron Radiation Facility, 6 Rue Jules Horowitz, F-38043 Grenoble, France
dUmicore AG&Co. KG, Rodenbacher Chaussee 4, D-63457 Hanau, Germany
First published on 26th April 2013
Abstract
X-ray absorption spectroscopy and X-ray diffraction are suitable probes of the chemical state of a catalyst under working conditions but are limited to bulk information. Here we show in two case studies related to hydrothermal aging and chemical modification of model automotive catalysts that enhanced detailed information of structural changes can be obtained when the two methods are combined with a concentration modulated excitation (cME) approach and phase sensitive detection (PSD). The catalysts are subject to a modulation experiment consisting of the periodic variation of the gas feed composition to the catalyst and the time-resolved data are additionally treated by PSD. In the case of a 2 wt% Rh/Al2O3 catalyst, a very small fraction (ca. 2%) of Rh remaining exposed at the alumina surface after hydrothermal aging at 1273 K can be detected by PSD. This Rh is sensitive to the red-ox oscillations of the experiment and is likely responsible for the observed catalytic activity and selectivity during NO reduction by CO. In the case of a 1.6 wt% Pd/Al2O3-Ce1−xZrxO2 catalyst, preliminary results of cME-XRD demonstrate that access to the kinetics of the whole material at work can be obtained. Both the red-ox processes involving the oxygen storage support and the Pd component can be followed with great precision. PSD enables the differentiation between Pd deposited on Al2O3 or on Ce1−xZrxO2. Modification of the catalyst by phosphorous clearly induces loss of the structural dynamics required for oxygen storage capacity that is provided by the Ce4+/Ce3+ pair. The two case studies demonstrate that detailed kinetics of subtle changes can be uncovered by the combination of in situ X-ray absorption and high energy diffraction methods with PSD.
Introduction
Synchrotron based techniques such as X-ray absorption spectroscopy (XAS),1–3 X-ray diffraction (XRD),2,4 pair distribution function (PDF)5,6 and X-ray scattering7 are key tools in catalysis research because they provide access to structural information using relatively easy sample environments and under relevant reaction conditions.8,9 An important advantage of these methods, over e.g. vibrational spectroscopic techniques, is that relatively thick sample beds can be penetrated using high energy X-rays and therefore information can be obtained at more practically relevant reactor scales. XAS and XRD also probe very different, but complementary, length scales of the catalyst. XAS is element specific and sensitive to short range order and provides structural insight regardless of material crystallinity. XRD is ideally suited to follow structural changes of complex working catalysts because a snapshot of the catalyst can be obtained with simultaneous information on the support material and on supported nanostructures. However, it is only sensitive to long range order and is intrinsically limited to detection of particles larger than 2–3 nm even with a synchrotron source.10 As a result of the different length scales probed in the corresponding measurements, the information obtained from XAS and XRD in independent experiments is increasingly combined to obtain a global picture of the structure of the catalyst at the very moment it is performing the catalytic event.8,11 The two methods can be combined in the same reactor cell or are even coupled (quasi-)simultaneously with the advantage of obtaining structural information at different length scales on the same analysis spot.12,13 Finally, the technical progress made in the design of insertion devices, monochromators and detectors now permits sub-second time resolution. However, both techniques are substantially silent, and therefore limited, with respect to surface information as they both mainly probe the bulk structure. Typically, from a spectroscopic viewpoint the signal of the bulk dominates over the possible contribution of the surface thus complicating the interpretation of steady state data acquired in a conventional manner. It is only recently that a method borrowed from infrared spectroscopy, a surface sensitive method, has become increasingly used, which provides the opportunity to access the subtle information on surface reactivity. In order to reveal minute structural changes that are assumed to be associated with surface structural variations, a modulated excitation (ME) approach coupled to phase sensitive detection (PSD) has been shown to improve the S/N level by orders of magnitude14,15 and to emphasize those components of the system under examination that are changing as a result of an external stimulation.16–18 ME is complementary to steady state analysis of catalysts and facilitates obtaining information on the role of the various evolving species during the experiment. From an experimental viewpoint, ME consists of a repeated stimulation of the catalyst, for example by periodic variation of reactants concentration (concentration ME, cME) while data are collected continuously over the various modulation periods. PSD is then applied to separate the information of components responding to the external stimulus from that of the components that are not responding, e.g. the bulk of the material (if the process is genuinely confined to the surface area of the catalyst), thus potentially providing surface sensitive information. We have previously shown that application of PSD greatly improves the quality of energy dispersive and quick EXAFS data by considering the XANES region.15,19,20 Recently, König et al. demonstrated that the methodology can also provide quantitative EXAFS data with an enormous improvement of sensitivity.21 Van Beek et al.22 showed that variation of the X-ray energy can function as the external stimulus for the experiment and this can provide unprecedented insight into structural dynamics by XRD.Here, we briefly report two case studies using energy dispersive XAS to explore hydrothermal aging effects on the structure and reactivity of Rh/Al2O3 and high energy XRD to monitor the structural changes induced by chemical treatment of a model three-way catalyst, Pd/Al2O3-Ce1−xZrxO2. The two case studies should demonstrate the vast amount of information and the enhanced sensitivity that can be achieved by application of phase sensitive detection coupled with the two X-ray based methods.
Experimental
The fresh 2 wt% Rh/Al2O3 and 1.6 wt% Pd/Al2O3-Ce1−xZrxO2 (hereafter, Pd/ACZ) catalysts (70–90 μm sieve fraction) were kindly provided by Umicore. Hydrothermal aging of Rh/Al2O3 was performed by exposure of the fresh sample to 10 vol% H2O–10 vol% O2-bal. N2 at 973 K and 1273 K for 16 h. The fresh Pd/ACZ was impregnated with a solution of (NH4)3PO4 (resulting in 7.5 wt% phosphorous) and calcined at 973 K for 5 h in air.23 Similarly, fresh Pd/ACZ was also thermally aged in air at 973 K for comparison. The specific surface area (SSA) of the catalysts was determined using a BELmax 00030 instrument. Materials were outgassed in a vacuum at 150 °C for 1 h prior to the measurement. The total surface area of the samples was determined by the BET method (Table 1). Rh dispersion was obtained from pulse CO chemisorption using a Micromeritics AutoChem instrument. Prior to the measurements, all samples were dried overnight at 403 K and reduced under hydrogen at 473 K. Dispersion was determined by assuming a Rh/CO stoichiometry of 1. High angular annular dark-field images in scanning mode (HAADF-STEM) were taken by a JEOL FS2200-FEG at 200 kV and in column omega filter. The sample was dispersed in double-deionized water and dropped on carbon-film-coated copper grids and dried in air.Time-resolved energy dispersive EXAFS data were measured at the Rh K-edge (E0 = 23.22 keV) at beamline ID24 of ESRF (Grenoble, France) using a Si(311) polychromator crystal in Bragg configuration and FReLoN CCD camera as described earlier.15 The X-ray beam was vertically defocused (to ca. 300 μm at the detector). Fresh and aged (under identical conditions) 2 wt% Pd/Al2O3 (Umicore) was mounted at the same focal length as the sample but outside the sample environment and served as the reference to account for the scattering of the polychromatic beam by the majority material in the sample (i.e. the support).24 During a full modulation period, 504 spectra (0.26 s time resolution, 0.1 s actual exposure) were collected.15 Here, we will restrict our discussion to the XANES region of the spectra.
Time-resolved high energy XRD data were measured at beamline ID15B of ESRF (Grenoble, France). XRD measurements (86.8 keV, λ = 0.143 Å, ΔE/E ∼ 1.4 × 10⁻³) were collected with a digital flat 2D panel detector (Pixium 4700) at 900 mm from the sample position. During a full modulation period, 100 high energy XRD patterns (0.5 ms time resolution) were collected.
Both in ED-EXAFS and XRD, the sample bed provided an X-ray transmission path length through the sample of 5 mm. Details of the experimental setup and protocol have been provided earlier.2,15,25 Three pneumatic four-port switch valves enable a rapid switch of feedstock composition to the cell. The exhaust of the cell was connected to a mass spectrometer (Omnistar, Pfeiffer) for online detection of reactants and products. The following m/z signals were monitored online: 4 (He), 18 (H2O), 22 (CO2), 28 (CO and N2), 30 (NO), 32 (O2) and 44 (CO2 and N2O). The delay between the trigger signal of the valves located before the cell and the response of the MS placed after the cell to changes of gas phase composition was ca. 6 s.
A full concentration modulation period (T) is defined as the time required to conclude a 5 vol% NO/He vs. 5 vol% CO/He (T = 132 s) or 1 vol% CO/He vs. 1 vol% O2/He (T = 50 s) sequence for Rh- and Pd-based samples, respectively. The two gases are admitted to the cell consecutively for an equal time at a flow rate of 80 ml min−1 at 300 °C. In the case of Rh/Al2O3, the modulation experiment was started after reduction in flowing 5 vol% H2/He at 573 K for 30 min. In the case of Pd-based catalysts, identical modulation experiments were performed at room temperature and at 473 K prior to the concentration modulation experiment at 573 K. The samples were heated at the given temperature in 1 vol% O2/He. Then the flow was switched to He until the MS signals were stable and the modulation experiment was started.
The full sets of time-resolved data can be processed into sets of phase-resolved data by the phase sensitive detection procedure (PSD, hereafter demodulation):14
Three-way catalytic activity data were collected using a quartz tubular reactor (di = 7 mm) loaded with a mechanical mixture of the catalyst sample (70 mg, sieve fraction 300–500 μm) and SiC (200 mg) firmly packed between two plugs of quartz wool. The reactor was positioned horizontally in a programmable tube furnace. Prior to the light off tests, the catalysts were pre-treated in N2 at 773 K for 5 min. Then, the catalyst was heated from 348 K to 773 K at 1 K min−1 in 1000 ppm CO, 150 ppm C3H6, 500 ppm NOx and 825 O2 (bal. N2), corresponding to stoichiometric conditions, at GHSV = 200![[thin space (1/6-em)]](https://www.rsc.org/images/entities/char_2009.gif) 000 h−1. Products were analysed at the reactor outlet using a FTIR spectrometer (Nicolet Antaris IGS, ThermoFisher Scientific).
000 h−1. Products were analysed at the reactor outlet using a FTIR spectrometer (Nicolet Antaris IGS, ThermoFisher Scientific).
Results and discussion
Rh/Al2O3: energy dispersive X-ray absorption spectroscopy
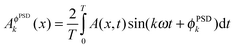
In the first example, we consider Rh/Al2O3 as a model three-way catalyst (TWC) used to clean the exhaust gases of stoichiometric engines of passenger vehicles.27 Rhodium is essential in the NO reduction by CO which is considered to be a key reaction in TWC technology.28,29 Al2O3 is sensitive to high temperature conditions that are encountered during engine operation and the associated well-known phase transformations promote the loss of precious metal surface area by particle sintering. In the case of Rh, exposure to high temperatures causes loss of active metal phase by diffusion of Rh into the Al2O3 support and supposedly formation of Rh aluminate species.30–32 At this point Rh is hardly recoverable to the original state. The phenomenon is clearly present in our Rh/Al2O3 catalysts. Whereas chemisorption data indicate very low dispersion for the catalyst aged at 1273 K, suggesting the presence of large Rh particles (Table 1), scanning transmission electron micrographs (STEM) confirm the disappearance of the Rh nano-particles observed in the fresh catalyst (Fig. 1), only EDX analysis demonstrates the presence of Rh. Therefore, Rh re-disperses and diffuses through the Al2O3 support after exposure to the high temperature hydrothermal conditions. Additionally, the catalysts exhibit decreasing surface area with increasing aging temperature that is associated with Al2O3 phase transitions (Table 1). The absence of any evident Rh particles in the sample aged at 1273 K contrasts with the still evident catalytic activity under stoichiometric conditions (Fig. 1) that cannot be attributed solely to the activity of Al2O3. It is evident from the activity data that NO reduction is increasingly more difficult as the aging temperature is increased. Therefore, concentration modulated excitation (cME) spectroscopy was used to follow the dynamics of structural changes of fresh and aged catalysts during periodic and alternate CO–NO pulses. The experimental conditions (CO and NOx concentrations, pulse frequency and gas composition) chosen for the modulation experiment are clearly far from the real TWC ones but are ideally suited to probe the structural changes of dispersed nano-sized catalysts at work.33–37 The cME experiment consisted of the alternate variation of CO and NO concentrations from 0 to 5 vol% in the He feed at 573 K.15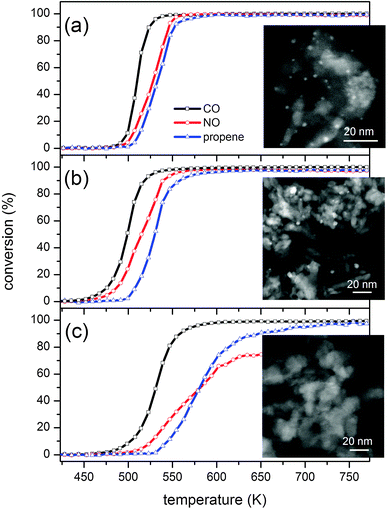 | ||
| Fig. 1 Three-way catalytic activity and HAADF-STEM images of 2 wt% Rh/Al2O3 (a) fresh, (b) aged at 973 K and (c) aged at 1273 K. | ||
Since the discussion will focus on the state of Rh and on the information contained in phase-resolved spectra obtained from time-resolved ED-EXAFS data according to eqn (1), it is useful to consider the boundary states that Rh encounters during reduction and re-oxidation. The XANES spectra of fresh Rh/Al2O3 and after in situ reduction in 5 vol% H2/He at 573 K are shown in Fig. 2. The difference spectrum between the oxidized and the metallic states of Rh/Al2O3 represents the maximum expected variation of the oxidation state during the red-ox pulses of the cMES study. The difference spectrum should be then featured with varying amplitude in the phase-resolved spectra, if the red-ox pulsing causes Rh to reversibly alternate between reduced and oxidized states. In first approximation, the fraction of Rh that responds to the red-ox stimulation of a cME experiment can be estimated assuming that the intensity of the signals of the difference spectrum is linear with extent of reduction and oxidation.
 | ||
| Fig. 2 XANES spectra of 2 wt% Rh/Al2O3, fresh (full symbol) and reduced at 573 K (open symbol) and of the difference between oxidized and reduced states. | ||
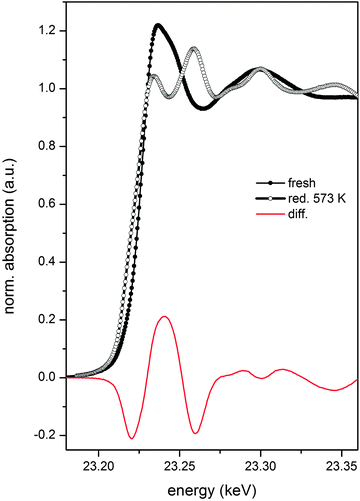
Fig. 3a–c shows the XANES region of the averaged time-resolved ED-EXAFS data recorded at the Rh K-edge at 573 K over the modulation period for fresh and hydrothermally aged catalysts. The data for the fresh catalyst have been already described in detail elsewhere15 and are reported here as a starting point for comparison with the data obtained for aged catalysts. The spectra show the three catalysts exhibit a different average oxidation state of Rh. Because the samples were reduced in situ at 573 K prior to the modulation experiment, the fresh sample (Fig. 3a) and the one aged at 973 K (Fig. 3b) exhibit mainly variations of the oxidation state around the reduced state. The fraction of reduced Rh at 573 K clearly decreases with increasing aging temperature and the time-resolved spectra of the catalyst aged at 1273 K show a persistent oxidized Rh state and no evidence of reduced Rh (Fig. 3c).38 The increasing fraction of oxidized Rh is typically understood as the result of diffusion of Rh into the Al2O3 support with the consequent loss of active phase and formation of irreducible Rh.32 This process seems to be already effective after aging at 973 K, though Rh nano-particles are still present (Fig. 1). Fig. 3 also shows that only minor changes are observed around the whiteline of fresh Rh/Al2O3 and of the catalyst aged at 973 K. In the case of the catalyst aged at 1273 K, there is no obvious indication of any spectral change apparently suggesting that the catalyst is not responding to the CO–NO modulation.
 | ||
| Fig. 3 XANES region of the average time-resolved ED-EXAFS spectra at the Rh K-edge during a CO/NO modulation experiment (T = 132 s) at 573 K over fresh 2 wt% Rh/Al2O3 (a), aged at 973 K (b) and aged at 1273 K (c). The inset in (c) is a magnification of the whiteline region. Corresponding phase-resolved spectra at φPSD = 0–120° (d), 0–150 °C (e) and 0–150° (f), respectively. The bold spectra are drawn to guide the eye. | ||
The corresponding phase-resolved spectra of Fig. 3d–f are able to capture subtle changes of the time-resolved spectra with high signal-to-noise ratio.15 Beside minor intensity differences, the phase-resolved spectra of fresh and aged at 973 K Rh/Al2O3 are rather similar. Small variations of the spectra of the sample aged at 973 K occur above 23.27 keV. The spectra obtained at 573 K match well the difference spectrum obtained from the two boundary states of Rh/Al2O3 presented in Fig. 2. This observation demonstrates that during the CO–NO modulation at 573 K the fresh catalyst undergoes periodic partial re-oxidation of Rh compared to the initial reduced state.15 In marked contrast, Rh/Al2O3 aged at 1273 K exhibits the least intensity variation, and above 23.27 keV the spectral oscillations are strongly damped. However, it is important to stress that the PSD reveals a fraction of Rh responding to the external stimulation to the experiment and provides features that in principle can be quantified.
The patterns of the phase-resolved spectra are associated with the change between reduced and oxidized states. As discussed, the Rh oxidation state of the fresh catalyst periodically increases and decreases. The average oxidation state is close to the metallic state as can be seen from the time-resolved spectra of Fig. 3. Semi-quantitative estimation of the amount of Rh that is reversibly responding to the CO–NO pulses from the comparison of the spectra of Fig. 3 with the reference states of Fig. 2 indicates that ca. 6% of Rh is involved in the changes observed at 573 K. In the case of Rh/Al2O3 aged at 973 K, changes occur to a similar extent. However, since the oxidation state of Rh is on average higher than that in the fresh catalyst, this Rh component is a fraction of the Rh effectively exposed at the Al2O3 surface. The catalyst aged at 1273 K remains oxidized during the experiment. Only ca. 2% of the total Rh responds to the CO–NO modulation and this fraction can be detected only by PSD. Hence, hydrothermal aging effectively caused a substantial change of Rh dispersion with possible effects on activity and selectivity.39–41
Once the set of phase-resolved spectra is obtained by PSD, it becomes easier to adequately select signals from the time-resolved spectra and to display their kinetics during the full modulation period. This is shown in Fig. 4 for the whiteline signal (ca. 23.24 keV) of the three catalysts. An increase of amplitude of the signal at 23.24 keV corresponds to an increase of the oxidic character (oxidation), whereas a decrease corresponds to increased metallic character. It is evident that reduction by CO of partially oxidized Rh formed in the NO half-period is faster than its re-oxidation by NO. Consumption of partially oxidized Rh species occurs within 6 s upon admittance of CO and does not proceed further till the conclusion of the pulse. Concurrent with the switch, the mass spectrometric data (Fig. 4) show a sharp maximum of production of species with m/z 44 (CO2 and N2O) that is clearly related to Rh reduction and CO oxidation (Rh–O + CO → Rh + CO2). However, the reactivity of undissociated NO species adsorbed in the NO pulse further contributes to the MS signal and explains the additional formation of N2O for the three catalysts visible in the inset of Fig. 4. The oxidation state of Rh changes again at the CO → NO switch. The onset of re-oxidation of Rh is delayed with respect to the switch by a time that decreases from ca. 13 s for fresh Rh/Al2O3 to 9 s and 7 s for the catalysts aged at 973 and 1273 K, respectively. These values are truly associated with the oxidation process because they are larger than the time required to achieve reduction in the CO pulse and the time needed to observe changes in the MS after the valve switch. The change of intensity of the whiteline signal of fresh Rh/Al2O3 can be fitted well by an exponential function in agreement with re-oxidation being dictated by NO dissociation. Only the synchronously measured infrared data were able to show that the process occurs stepwise through formation of Rh0–NO, Rh–NO− and Rh–NO+ species.15,42 Fitting of the temporal profiles becomes increasingly difficult with increasing aging temperature. In the catalyst aged at 1273 K, the signal at 23.24 keV clearly gains intensity at least in two stages, first fast and then slower, a process that can be tentatively associated with an alternative oxidation mechanism involving different adsorbed NO species. Within the time required to set re-oxidation, species with m/z 44 experience again a maximum with the exception of fresh Rh/Al2O3. N2O is also produced at a similar rate and in strong contrast to the NO → CO switch. The fresh catalyst exhibits only a very small m/z 44 signal and is therefore poorly active at the CO → NO switch. The aged catalysts are active but not selective. Therefore, in general, the change from reduced to partially oxidized Rh is not favorable to the reaction on particles of ca. 3 nm in diameter.15 In contrast, Fig. 4 reveals that activity is systematically higher at the NO → CO switch, i.e. when the oxidation state changes abruptly from partially oxidized to reduced. Fig. 4 also shows that hydrothermal aging causes differences in the kinetics of reduction and re-oxidation. In the presence of CO, the major difference between the catalysts is the extent of reduction that correlates with the mentioned average oxidation state observed in the time-resolved spectra. The higher the aging temperature, the lower the amount of Rh that is sensitive to the CO–NO modulation and the faster the reduction. The initial apparent reduction rate increased from −0.0017 a.u. s−1 for the fresh catalyst and the sample aged at 973 K to −0.00096 a.u. s−1 for the sample aged at 1273 K. However, it is especially in the oxidation sequence that structural changes become effective. The oxidation takes place faster with increasing aging temperature and with increasing Rh diffusion into the Al2O3. Therefore, the less Rh is exposed at the Al2O3 surface the faster the re-oxidation occurs. Oxidation by NO is concluded ca. 10 s after introducing NO to the catalyst aged at 1273 K.
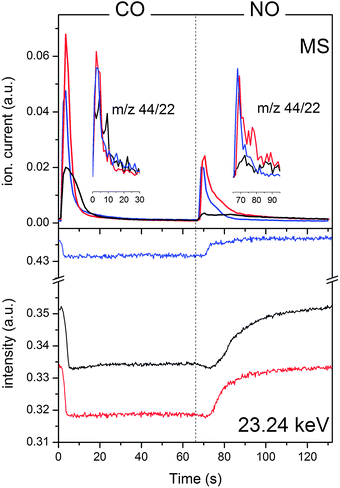 | ||
| Fig. 4 Top panel: temporal response of the MS signal corresponding to m/z = 44 (CO2) during a CO/NO modulation experiment (T = 132 s) at 573 K on 2 wt% Rh/Al2O3: fresh (black), aged at 973 K (red) and aged at 1273 K (blue). The insets show the ratio between m/z 44 and 22. Bottom panel: temporal response of the whiteline signal (23.24 keV) from the time-resolved spectra of the same experiment. The signal has been selected from the phase-resolved spectra of Fig. 3. | ||
Comparison of the three catalysts based on their activity is complicated by the different size and loading of the Rh entities involved in the catalytic process, the difference being caused by the hydrothermal aging. Despite the lower amount of Rh still available at the Al2O3 surface and the average oxidation and coordination state of Rh, activity of the catalyst aged at 1273 K in terms of MS signal is maintained at comparable levels to that of the fresh catalyst (Fig. 4). Since activity is higher when the state of Rh converts from partially oxidized to reduced (the NO → CO switch) and concomitantly the aged catalysts also display low selectivity to N2 (major contribution of N2O to MS signal m/z 44), the oxidation by NO produces oxidized Rh species in the aged catalysts that are prone to produce N2O.41 These species are likely not associated with well-defined Rh particles since the two aged catalysts behave very similarly despite the threefold contribution of Rh to the red-ox process in the catalyst aged at 973 K. In contrast, the data for the fresh catalyst indicate that a (thin) layer of RhOx on reduced particles may be effectively the active site environment required for both activity and selectivity. Since the NO → CO switch in this work also includes a CO oxidation step, wherein the Rh surface is covered by O and N atoms as a result of NO dissociation, the data are in agreement with the reported CO oxidation dependence on the Rh oxidation state.43–45 The size range of the Rh particles of fresh Rh/Al2O3 and the temperature at which the modulation experiment is performed make us confident that Rh particle disruption did not intervene, which was confirmed by the reversibility of the observed changes. This may not be correct for the catalyst aged at 1273 K given the susceptibility of small Rh clusters to re-dispersion.39,46
Finally, it is important to note that the experiments show that in the specific case of this Rh/Al2O3 example ME confers surface sensitivity to X-ray absorption spectroscopy. Given the fact that the fresh catalyst is composed of well-defined Rh particles and that the average oxidation state is close to the metallic state during experiment, the periodic reduction–oxidation that is captured by PSD needs to be associated with the surface re-oxidation of the particles.15 In the case of the catalyst aged at 1273 K, Rh is mainly re-dispersed within Al2O3 and thus difficult to reduce at 573 K. PSD is able to reveal that small fraction of Rh still available for reaction on the surface of the support. This Rh cannot be captured solely by examining the time-resolved data in a conventional manner. Spectral changes associated with the red-ox pulsing above the whiteline are especially difficult to be detected by eye. PSD also greatly enhances sensitivity in the region where structural information lies that cannot be obtained by conventional difference spectroscopy.15,21 We are currently elaborating a protocol for the conventional EXAFS analysis of these spectra that is alternative to the one proposed recently.21
Pd/Al2O3-Ce1−xZrxO2: high energy X-ray diffraction
A major cause for TWC aging is the deposition of chemical elements originating from oil and fuel additives, which predominantly localize at the entrance of the automotive catalytic converter.47 Phosphorus (P) can react with both Al2O3 and CeO2 components to form stable AlPO4 and CePO4, thereby severely diminishing the efficiency of the TWC. This is typically associated with the locking of the Ce4+/Ce3+ red-ox pair, which is responsible for the oxygen exchange properties of the TWC.48,49 Precious metal nano-particles, and therefore the whole associated chemistry, are also affected by the presence of P.50 Hence, the second case study presents data from another experiment carried out within the same sample environment, in which 1.6 wt% Pd/ACZ is subjected to short (25 s) alternate switches of diluted CO and O2 flows at 573 K while high energy XRD data are acquired at high time resolution (0.5 s per pattern). The aging issue is faced in this case by either thermal or chemical treatment with phosphorous as the chemical poison using a procedure reported earlier.23 The decreasing BET surface area from 119 m2 g−1 for the fresh catalyst to 96 m2 g−1 after thermal treatment and to 50 m2 g−1 for the P aged one demonstrates that P induces clogging of the metal oxide supports in agreement with similar observations on Pd/Al2O3.23 The presence of P induces a shift of the methane oxidation activity of Pd/Al2O3 under stoichiometric conditions to higher temperatures that is more severe than the effect of thermal aging.23For the sake of brevity we discuss here the diffraction data obtained at 573 K; however, the samples underwent the same experiment at 473 K followed by a temperature ramp in 5 vol% O2/He. Fig. 5 displays the two dimensional representation of the modulation XRD experiments on the three catalysts. The colour maps of fresh and thermally aged Pd/ACZ clearly show that the catalysts undergo similar structural changes to previous reports.51 This is visible from the periodic variation of the d spacing of some reflections and from the periodic appearance of other reflections (e.g. at ca. 2.8 Å–1). In the case of the P poisoned catalyst, it is clear that the dynamic changes are massively damped, which is attributed to the presence of P.
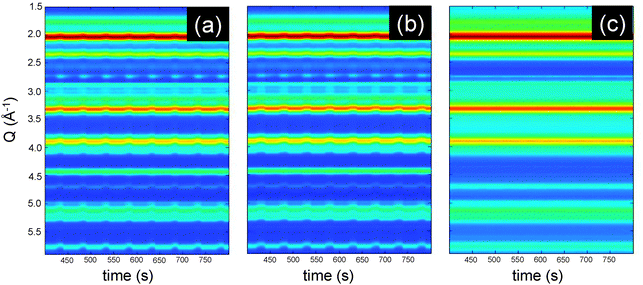 | ||
| Fig. 5 Colour map representation of (a) fresh, (b) thermally aged and (c) P-treated Pd/ACZ during a CO/O2 modulation experiment (T = 50 s) at 573 K. | ||
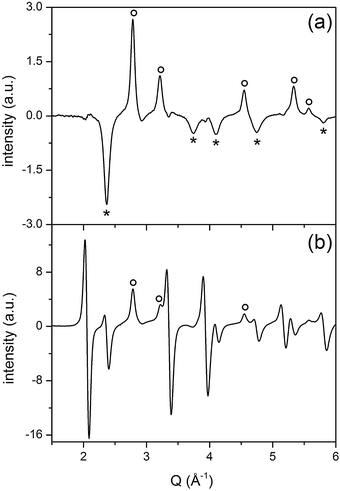
Fig. 6a shows the time-resolved high energy XRD data obtained from the fresh Pd/ACZ. The patterns are dominated by the reflections of cubic CZ and of γ-Al2O3; precious little information is obtained on the presence of Pd phases. Upon inspection by eye, the time-resolved data exhibit a change in the d of the CZ reflections and at ca. 2.8 Å–1 that are visible in Fig. 5. The measurable and reversible variation of the lattice parameter associated with the CZ reflections is 0.024 Å corresponding to ca. 0.49% expansion of the CeO2 lattice upon reduction by CO followed by oxidation by O2, and thus a reversible reduction of Ce4+. Detailed kinetics of the system, i.e. of the CZ phase and the Pd phase, could in principle be extracted from the time-resolved data.51 Application of PSD greatly simplifies the data in a complex system as this, since the contribution of alumina can be filtered out likewise the contribution of that major fraction (bulk) of CZ that is not responding to the CO–O2 concentration modulation. Therefore, it is only the very subtle variations around the reflections that experience some changes that are highlighted, again with high resolution. Moreover, PSD provides the information that is not accessible from the time-resolved data as shown in Fig. 6. For example, the differential signals around the CZ reflections mirror the variation of lattice parameter observed in the time-resolved data. However, the intensity change of signals at 2.78 and 3.22 Å–1 becomes clearly visible only in the PSD data (Fig. 6). These signals are readily associated with the formation of metallic palladium,52,53 thus with reduction of Pd during the CO pulse. Reliable estimation of the Pd crystallite size using the PSD data and the reflection at 2.78 Å–1 does not seem possible because of the shape of the signal. The sharp Pd(111) reflection overlaps with a broader signal indicating a crystallite size distribution that using a conventional approach leads to the overestimation of the crystallite size.54 The two signals likely originate from the simultaneous response of Pd deposited on CZ and on alumina, respectively. We associate the broad signal with small Pd entities deposited on CZ, whereas the sharp peak is likely due to larger Pd particles on alumina, without excluding the contribution from small Pd particles present on Al2O3 to the broad signal. The assignment of the sharp signals at 2.78 and 3.22 Å–1 to Pd deposited on alumina can be inferred by the observation that the kinetics of these signals is different from that of the reflections of CZ. Therefore, PSD is highly advantageous to visualize this in a simple way. The set of PSD data of Fig. 6b can be analysed in more detail and this is demonstrated in Fig. 7. A pattern (φPSD = 130°) can be isolated from the PSD data in which further reflections associated with metallic Pd are clearly discernible at 2.78, 3.21, 4.54, 5.33 and 5.57 Å–1 (Fig. 7a). The reflections are accompanied by other peaks at 2.36, 3.74, 4.10, 4.74 and 5.80 Å–1 that are not clearly visible in the pattern at φPSD = 180° (Fig. 7b) because of the overwhelming CZ reflections, and cannot be observed in other PSD patterns. These signals have opposite sign compared to the reflections of metallic Pd. The signals are unambiguously ascribed to the formation of the PdO phase upon re-oxidation. Additionally, the same φPSD = 130° pattern exhibits no signals of CZ clearly suggesting that the dynamic changes involving Pd deposited on alumina follow different kinetics compared to those of CZ reduction–oxidation. Therefore, PSD renders the whole PdO–Pd reduction–re-oxidation on the alumina component of a complex system visible and distinguishable from the chemistry occurring on CZ.
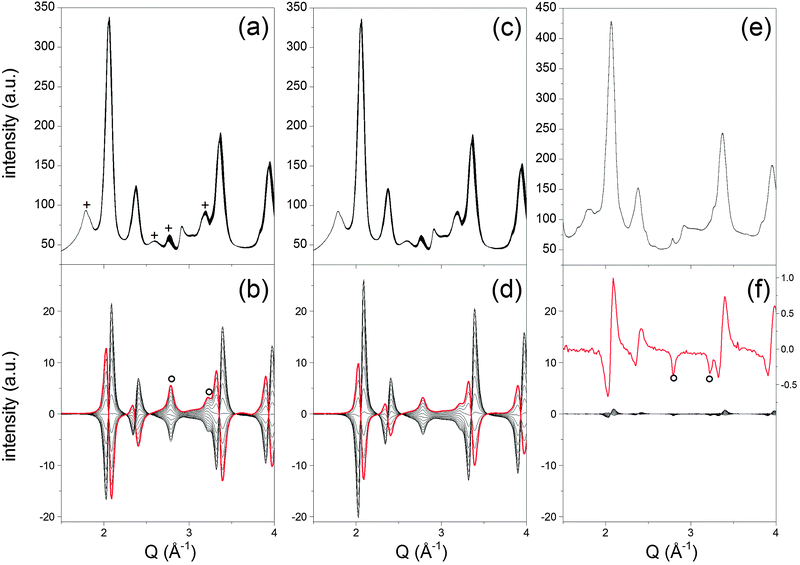 | ||
| Fig. 6 Time-resolved high energy XRD data of (a) fresh, (c) thermally aged and (e) P-treated Pd/ACZ during a CO/O2 modulation experiment at 573 K. (b, d and f) Corresponding selected sets of phase-resolved data obtained for φPSD 30–180°, 50–180° and 70–180°, respectively. The red trace in (f) is a magnification of φPSD = 90°. Red traces are intended to guide the eye. (+) Contribution of Al2O3 reflections; (○) Pd reflections. | ||
 | ||
| Fig. 7 Selected PSD data at φPSD 130° (a) and 180° (b) for Pd/ACZ obtained from the CO/O2 modulation experiment at 573 K of Fig. 6. (○) Pd reflections; (*) PdO reflections. | ||
Based on the above observations for the fresh catalyst, the same experiments performed on the thermally aged and chemically treated catalysts can also be interpreted. The catalyst thermally aged at 973 K exhibits a very similar behavior to that of the fresh catalyst (0.49% lattice expansion) indicating that thermal aging at this temperature does not, in a qualitative sense, affect the structural-reactive properties of the fresh system. However, this is only the conclusion that can be drawn from the simple comparison of the time-resolved data. Only the kinetics are able to really tell us whether a substantial difference exists. Fig. 8 shows that in the fresh catalyst the expansion of the CZ lattice as a result of reduction occurs in a relatively narrower time window compared to that on the catalyst aged at 973 K. Similarly, the intensity increase of the Pd reflection at 2.78 Å–1, i.e. Pd reduction, also follows the same tendency. Therefore, Pd reduction on the fresh catalyst occurs to a lesser extent, or is retarded compared to the thermally aged catalyst. This observation is crucial for the oxygen exchange capability of the catalyst. That the window in which palladium and cerium remain reduced is larger upon thermal treatment indicates that the capability of CZ to buffer the oxygen deficiency has been reduced because of the thermal treatment. This may be supported by the lower specific surface area of the aged catalyst (Table 1). Furthermore, the behaviour of the Pd(111) peak is also different compared to that of Ce(111). This is especially visible in the O2 pulse where metallic Pd persists and re-oxidation is slower than that of Ce3+. We associate this behaviour to the fact that, as mentioned before, the selected Pd peak is the contribution of the Pd deposited on Al2O3 and on CZ. The response of Pd to the environment during the experiment is different on the two materials because of the nature of the interaction between Pd and the two metal oxides. Pd can profit from the oxygen supply offered by CZ in the presence of a reducing agent. Therefore, the slow loss of the Pd reflection in the O2 pulse is associated with the fraction of Pd deposited on Al2O3.
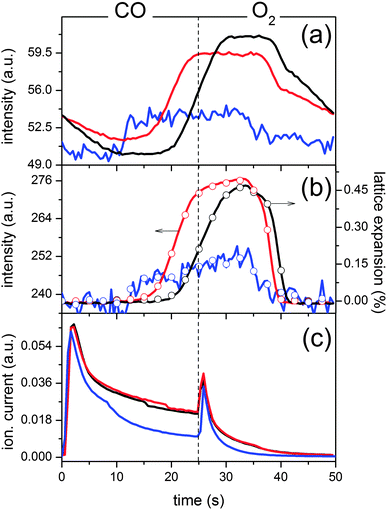 | ||
| Fig. 8 Temporal behaviour of selected reflections of the data of Fig. 6 obtained for fresh Pd/ACZ (black), thermally aged (red) and P-treated (blue, scaled by factor 5): (a) Pd(111) (2.78 Å–1) and (b) Ce(111) (2.06 Å–1) reflections. Open symbols represent calculated lattice expansion values of selected time-resolved data. (c) Mass spectrometric data (m/z = 44, CO2) for a full modulation period. | ||
In the case of the P poisoned catalyst, which was also calcined at 973 K, the time-resolved data do not present similar noticeable changes (Fig. 6e). Also, no specific reflections of AlPO4 and CePO4 can be clearly observed because of the overlap with the reflections of Al2O3 and CZ, and of the low concentration of these phases.27,48 PSD (Fig. 6f) reveals only extremely tiny variations of both the CZ lattice parameter (0.017%) and the intensity of the Pd peaks, whereas again none of the peaks in the PSD data can be associated with the contribution of AlPO4 and CePO4 phases in agreement with their inert nature under these experimental conditions. Nevertheless, it is clear that a red-ox process is still at work. Though a dynamic process involving CZ is still visible from the differential but very weak CZ reflections, if the data of Fig. 6f are compared with those of Fig. 6b the reflections corresponding to Pd are changing to a larger extent compared to those of CZ. This seems to indicate that though the effect of P extends to the whole catalyst, it affects the CZ more severely, and correspondingly, the fraction of metal deposited on it. Compared to the two other catalysts, the kinetics of the selected signals in Fig. 8 clearly shows that the extent of reduction is far lower for the poisoned catalyst. Additionally, it also provides information on the fact that the fraction of Pd that is still subject to the chemistry of the CO–O2 modulation, likely part of the Pd deposited on Al2O3, reduces much earlier as a result of the loss of the red-ox process of the Ce4+/Ce3+ pair induced by P thus losing the advantage of the presence of CZ.
These findings are further supported by the synchronous mass spectrometric data (Fig. 8c). The MS profiles corresponding to CO2 evolution (m/z = 44) are very similar in the three catalysts and are in agreement with literature data.55 Two peaks at the O2 → CO (large) and CO → O2 (small) switches are associated with the oxidation of adsorbed CO on Pd and re-oxidation of Ce3+, respectively.56,57 The CO2 evolution extends after the maximum until the end of the CO pulse, whereas it quickly vanishes in the O2 pulse. The continuous CO2 evolution in the CO pulse is associated with the presence of CZ and its oxygen storage capacity. Since the CO2 maxima at ca. 2 s are almost identical, the difference between the catalysts is evident predominantly in the time regime 10–25 s, where the P-poisoned catalyst exhibits ca. 50% less CO2 evolution. This seems to indicate that the effect of aging is explicit under steady state conditions rather than at the switches where the catalysts behave very similarly. Therefore, aging strongly affects the oxygen exchange capacity of the catalyst that is manifested during the CO pulse. After 10 s under CO, CO2 evolution starts decreasing; at the moment when the Pd(111) reflection likely of Pd on Al2O3 becomes measurable in the high energy XRD data. Since only a very slight lattice expansion of CZ is observed, the Ce4+/Ce3+ red-ox pair is locked and Pd cannot be maintained in the oxidized state for a long time, in stark contrast to the fresh and thermally aged catalysts. The similarity between the CO2 evolution of the three catalysts seems to indicate that the aging by P affects the CZ considerably more than the Al2O3 and, therefore, that either P deposits more selectively on CZ or that the P deposited on CZ more strongly affects the catalyst efficiency than that deposited on Al2O3. The latter is more likely as it hinders oxygen exchange by locking the Ce4+/Ce3+ pair as evident from XRD. Comparison between XRD and MS data clearly shows that in the O2 pulse CO2 evolution is associated with re-oxidation of both Pd and CZ. However, the CO2 maximum is probably attributable to removal of adsorbed CO2 since the CO2 peak vanishes faster than oxidation takes place.
Finally, and similarly to the case of Rh, CO2 production is maximized at the O2 → CO switch, when clearly Pd changes from oxidized to reduced, therefore indicating that an oxide layer is present when highest activity is obtained.
Conclusions
Concentration modulated excitation (cME) and phase sensitive detection (PSD) have been used to demonstrate the sensitivity enhancement that can be introduced in XAS and high energy XRD compared with conventional measurement approaches. Small dynamic structural changes have been followed with greatly enhanced sensitivity in two case studies where hydrothermal aging and chemical treatment of model three-way catalysts have been considered. In the case of 2 wt% Rh/Al2O3 subjected to a CO–NO modulation experiment at 573 K, cME-ED-XAS reveals that a fraction of Rh after reduction at 573 K responds to the external red-ox stimulation. The state of Rh is largely reduced in the fresh catalyst and in that aged at 973 K and fluctuates between slightly re-oxidized and reduced. In the fresh catalyst, it seems plausible that the environment of the active sites includes partially oxidized Rh nano-particles. After hydrothermal aging at 1273 K, the catalyst is constantly oxidized. However, PSD is able to confirm that a small fraction of Rh is still able to perform NO reduction by CO, although the catalyst selectivity is poor. Therefore, the extent of Rh oxidation and the nature of oxidized Rh species may play a crucial role in selectivity.In the case of 1.6 wt% Pd/Al2O3-Ce1−xZrxO2, the cME-XRD experiment was aimed at determining the effect of thermal aging and chemical treatment (by phosphorous) on the oxygen exchange capability of the catalyst and the structural changes involved in such a process. The preliminary results indicate that thermal aging already deteriorates the oxygen exchange properties of the catalyst because the fresh catalyst was able to maintain Pd oxidized for a longer time than the aged one. In this complex catalyst for XRD, PSD showed that deeper and unique insight in the structural dynamics can be obtained. The Pd nano-particles were identified in the catalyst and it was possible to tentatively discriminate between Pd deposited on Al2O3 and on ceria–zirconia. Moreover, very small lattice parameter variations were identified by PSD which point to the high sensitivity of the method.
All the discussed structural dynamic changes and the corresponding kinetics are difficult to resolve without the use of PSD. The increased sensitivity of the two traditionally bulk methods used in this work demonstrates that the combination of a pulsed-type experiment and PSD provides an exceptional means to study a range of materials which may previously have been regarded as intractable as a result of extremely subtle but nonetheless critical, structural variations. The method seems to be particularly powerful in the case of XRD that can provide a complete snapshot of the catalyst under reaction conditions with unprecedented resolution for this technique and for complex systems. Finally, we should mention that application of ME and PSD as described here is straightforward from an experimental viewpoint. As demonstrated in some studies, including this one, PSD can be performed on various data sets. Hence, various aspects of the structure of a solid catalyst, along with many other functional materials at work can be potentially characterized with improved sensitivity with respect to conventional approaches.
Acknowledgements
The authors kindly acknowledge PSI, Empa, the Competence Center for Materials Science and Technology (CCMX), VSS lubes, the Erdöl-Vereinigung, the Federal Office for the Environment, Erdgas Mobil and Umicore for financial support, and ESRF for allocating beam time at beamlines ID24 and ID15B. Ms Y. Lu, Ms O. Korsak, Dr A. Eyssler, Dr D. Zurita and Dr J. Andrieux are acknowledged for support during the measurements.References
- J. D. Grunwaldt, M. Caravati, S. Hannemann and A. Baiker, Phys. Chem. Chem. Phys., 2004, 6, 3037 RSC.
- M. A. Newton, M. Di Michiel, A. Kubacka and M. Fernandez-Garcia, J. Am. Chem. Soc., 2010, 132, 4540 CrossRef CAS.
- A. M. Beale and B. M. Weckhuysen, Phys. Chem. Chem. Phys., 2010, 2010, 5562 RSC.
- P. Norby and J. C. Hanson, Catal. Today, 1998, 39, 301 CrossRef CAS.
- P. J. Chupas, K. W. Chapman, H. L. Chen and C. P. Grey, Catal. Today, 2009, 145, 213 CrossRef CAS.
- M. A. Newton, K. W. Chapman, D. Thompsett and P. J. Chupas, J. Am. Chem. Soc., 2012, 134, 5036 CrossRef CAS.
- P. Canton, C. Meneghini, P. Riello and A. Benedetti, in In situ spectroscopy of catalysts, ed. B. M. Weckhuysen, American Scientific Publisher, Stevenson Ranch, California, 2004, p. 293 Search PubMed.
- M. A. Newton and W. van Beek, Chem. Soc. Rev., 2010, 39, 4845 RSC.
- A. I. Frenkel, J. A. Rodriguez and J. G. Chen, ACS Catal., 2012, 2, 2269 CrossRef CAS.
- A. Martorana, G. Deganello, A. Longo, A. Prestianni, L. Liotta, A. Macaluso, G. Pantaleo, A. Balerna and S. Mobilio, J. Solid State Chem., 2004, 177, 1268 CrossRef CAS.
- J. D. Grunwaldt, N. van Vegten and A. Baiker, Chem. Commun., 2007, 4635 RSC.
- M. A. Newton, M. Di Michiel, A. Kubacka and M. Fernandez-Garcia, J. Am. Chem. Soc., 2010, 132, 4540 CrossRef CAS.
- W. van Beek, O. V. Safonova, G. Wiker and H. Emerich, Phase Transitions, 2011, 84, 726 CrossRef CAS.
- D. Baurecht and U. P. Fringeli, Rev. Sci. Instrum., 2001, 72, 3782 CrossRef CAS.
- D. Ferri, M. Santhosh Kumar, R. Wirz, A. Eyssler, O. Korsak, P. Hug, A. Weidenkaff and M. A. Newton, Phys. Chem. Chem. Phys., 2010, 12, 5634 RSC.
- T. Bürgi and A. Baiker, J. Phys. Chem. B, 2002, 106, 10649 CrossRef.
- A. Urakawa, T. Bürgi and A. Baiker, Chem. Phys., 2006, 324, 653 CrossRef CAS.
- I. Dolamic and T. Bürgi, J. Catal., 2007, 248, 268 CrossRef CAS.
- D. Ferri, M. A. Newton and M. Nachtegaal, Top. Catal., 2011, 54, 1070 CrossRef CAS.
- A. Eyssler, E. Kleymenov, A. Kupferschmid, M. Nachtegaal, M. Santhosh Kumar, P. Hug, A. Weidenkaff and D. Ferri, J. Phys. Chem. C, 2011, 115, 1231 CAS.
- C. F. J. König, J. A. van Bokhoven, T. J. Schildhauer and M. Nachtegaal, J. Phys. Chem. C, 2012, 116, 19857 Search PubMed.
- W. van Beek, H. Emerich, A. Urakawa, L. Palin, M. Milanesio, R. Caliandro, D. Viterbo and D. Chernyshov, J. Appl. Crystallogr., 2012, 45, 738 CAS.
- M. Santhosh Kumar, E. H. Otal, M. H. Aguirre, A. Winkler, A. Ulrich, D. Rentsch, A. Weidenkaff and D. Ferri, Catal. Today, 2012, 184, 237 CrossRef.
- M. A. Newton, J. Synchrotron Radiat., 2007, 14, 372 CrossRef CAS.
- M. A. Newton, Top. Catal., 2009, 52, 1410 CrossRef CAS.
- T. Ressler, J. Synchrotron Radiat., 1998, 5, 118 CrossRef CAS.
- N. R. Collins and M. V. Twigg, Top. Catal., 2007, 42–43, 323 CrossRef.
- K. C. Taylor, Catal. Rev. Sci. Eng., 1993, 35, 457 CAS.
- P. Granger, F. Dhainaut, S. Pietrzik, P. Malfoy, A. S. Mamede, L. Leclercq and G. Leclercq, Top. Catal., 2006, 39, 65 CrossRef CAS.
- Z. Hu, F. M. Allen, C. Z. Wan, R. M. Heck, J. J. Steger, R. E. Lakis and C. E. Lyman, J. Catal., 1998, 174, 13 CrossRef CAS.
- K. Dohmae, Y. Nagai, T. Tanabe, A. Suzuki, Y. Inada and M. Nomura, Surf. Interface Anal., 2008, 40, 1751 CrossRef CAS.
- H. Hirata, K. Kishita, Y. Nagai, K. Dohmae, H. Shinjoh and S. Matsumoto, Catal. Today, 2011, 164, 467 CrossRef CAS.
- M. Cavers, J. M. Davidson, I. R. Harkness, L. V. C. Rees and G. S. McDougall, J. Catal., 1999, 188, 426 CrossRef CAS.
- J. L. Freysz, J. Saussey, J. C. Lavalley and P. Bourges, J. Catal., 2001, 197, 131 CrossRef CAS.
- M. A. Newton, C. Belver-Coldeira, A. Martinez-Arias and M. Fernandez-Garcia, Nat. Mater., 2007, 6, 528 CrossRef CAS.
- J. Stötzel, D. Lützenkirchen-Hecht, R. Frahm, B. Kimmerle, A. Baiker, M. Nachtegaal, M. J. Beier and J. D. Grunwaldt, J. Phys.: Conf. Ser., 2009, 190, 012162 CrossRef.
- S. Chansai, R. Burch, C. Hardacre, J. Breen and F. Meunier, J. Catal., 2010, 276, 49 CrossRef CAS.
- M. Santhosh Kumar, O. Korsak, L. Bocher, D. Logvinovich, P. Hug, A. Weidenkaff and D. Ferri, Top. Catal., 2011, 54, 1213 CrossRef.
- J. Kaspar, C. de Leitenburg, P. Fornasiero, A. Trovarelli and M. Graziani, J. Catal., 1994, 146, 136 CrossRef CAS.
- P. Araya, F. Gracia, J. Cortes and E. E. Wolf, Appl. Catal., B, 2002, 38, 77 CrossRef CAS.
- M. A. Newton, A. J. Dent, S. G. Fiddy, B. Jyoti and J. Evans, J. Mater. Sci., 2007, 42, 3288 CrossRef CAS.
- M. A. Newton, A. J. Dent, S. G. Fiddy, N. B. Jyoti and J. Evans, Catal. Today, 2007, 126, 64 CrossRef CAS.
- M. A. Newton, A. J. Dent, S. Diaz-Moreno, S. G. Fiddy, B. Jyoti and J. Evans, Chem.–Eur. J., 2006, 12, 1975 CrossRef CAS.
- J. Gustafson, R. Westerström, O. Balmes, A. resta, R. van Rijn, X. Torrelles, C. T. Herbschleb, J. W. M. Frenken and E. Lundgren, J. Phys. Chem. C, 2010, 114, 4580 CAS.
- D. A. J. Michel Ligthart, R. A. van Santen and E. J. M. Hensen, Angew. Chem., Int. Ed., 2011, 50, 5306 CrossRef.
- A. J. Dent, J. Evans, S. G. Fiddy, N. Jyoti, M. A. Newton and M. Tromp, Angew. Chem., Int. Ed., 2007, 46, 5356 CrossRef CAS.
- M. Lopez Granados, C. Larese, F. Cabello Galisteo, R. Mariscal, J. L. G. Fierro, R. Fernandez-Ruiz, R. Sanguino and M. Luna, Catal. Today, 2005, 107–108, 77 CrossRef CAS.
- L. Xu, G. Guo, D. Uy, A. E. O'Neill, W. H. Weber, M. J. Rokosz and R. W. McCabe, Appl. Catal., B, 2004, 50, 113 CrossRef CAS.
- S. Y. Christou, M. C. Alvarez-Galvan, J. L. G. Fierro and A. M. Efstathiou, Appl. Catal., B, 2011, 106, 103 CAS.
- M. Santhosh Kumar, M. A. Newton, A. Weidenkaff and D. Ferri, Catal. Today, 2013, 205, 3 CrossRef.
- M. A. Newton, M. Di Michiel, A. Kubacka, A. Iglesias-Juez and M. Fernandez-Garcia, Angew. Chem., Int. Ed., 2012, 51, 2363 CrossRef CAS.
- Z. Kaszkur, J. Appl. Crystallogr., 2000, 33, 1262 CrossRef CAS.
- W. Vogel, J. Phys. Chem. C, 2011, 115, 1506 CAS.
- A. Benedetti, S. Polizzi, P. Riello, F. Pinna and G. Goerigk, J. Catal., 1997, 171, 345 CrossRef CAS.
- M. Shen, M. Yang, J. Wang, J. Wen, M. Zhao and W. Wang, J. Phys. Chem. C, 2009, 113, 3212 CAS.
- R. Rajasree, J. H. B. J. Hoebink and J. C. Schouten, J. Catal., 2004, 223, 36 CrossRef CAS.
- M. Boaro, F. Giordano, S. Recchia, V. Dal Santo, M. Giona and A. Trovarelli, Appl. Catal., B, 2004, 52, 225 CrossRef CAS.
Footnote |
| † Present address: Condensed Matter Physics Department, University of Zaragoza, 50009 Zaragoza, Spain. |
| This journal is © the Owner Societies 2013 |