 Open Access Article
 This Open Access Article is licensed under a Creative Commons Attribution-Non Commercial 3.0 Unported Licence
Alternating chirality in the monolayer H2TPP on Cu(110)–(2 × 1)O
Margareta
Wagner
,
Peter
Puschnig
,
Stephen
Berkebile
,
Falko P.
Netzer
and
Michael G.
Ramsey
*
Institute of Physics, Karl-Franzens Universität Graz, Universitätsplatz 5, 8010 Graz, Austria. E-mail: michael.ramsey@uni-graz.at
First published on 7th February 2013
Abstract
In this work, the structure of the tetraphenylporphyrin (H2TPP) monolayer grown on the oxygen passivated Cu(110)–(2 × 1)O surface has been investigated with LT-STM and elucidated by DFT-calculations. The monolayer is commensurate with all molecules occupying the same adsorption site, but there are two molecules per unit cell. The STM images suggest alternating chirality for the molecules within one unit cell which is supported by DFT total energy calculations for monolayers on the Cu–O substrate. STM simulations for alternating and single chirality monolayers have subtle differences which indicate that the experimentally observed surface is one containing molecules with alternating chirality, that is racemicity within the unit cell.
Introduction
Within the last few years, epitaxial thin films of various porphyrins such as tetraphenylporphyrins (TPP) like H2TPP or MTPP (with a metal atom M substituting the hydrogen atoms in the center of the macrocycle) have been investigated with increasing interest. They are promising candidates for organic devices such as OLEDs, OFETs, photovoltaic cells,1–4 gas sensors,5,6 and spintronics.7 The molecules generally self-assemble into densely packed, ordered structures on various substrate symmetries, where the highly conjugated macrocycle leads to flat adsorption geometries, while the phenyl rings remain twisted out of plane. Porphyrin monolayers with one molecule per unit cell have been observed on Au(111), Ag(111), Cu(111) and Cu(110).8–10 The monolayers are incommensurate on the fcc(111) surfaces, but commensurate on Cu(110).Chirality, i.e., when a molecule and its mirror molecule cannot become identical by rotations, is found in many organic compounds. Chiral molecules and molecules with induced chirality after adsorption have been attracting growing attention recently,11 as they are relevant, e.g. for catalytic processes,12 optical activity, and chiral recognition in self-assembly13 and biomolecular systems.14 In most cases monolayers formed by chiral molecules are known to separate/organize into homochiral domains.8,10 Also achiral molecules are able to assemble into chiral domains. This is provided by asymmetric distortions of the molecule during adsorption on a surface15,16 (which induce chirality in a per se achiral molecule) and/or in arrangements on the substrate where mirror symmetry is lost.17–21 Chirality in tetraphenylporphyrins is provided by their phenyl side groups, which are tilted in a propeller-like manner either clockwise or anticlockwise, when adsorbed on a surface or confined in a crystal structure. It is known that the molecules are chiral in the single crystal.22 While the various porphyrin monolayers reported in the literature form homochiral domains, we show that H2TPP on Cu(110)–p(2 × 1)O forms heterochiral domains. These domains have a racemic unit cell, i.e., the two molecules in the unit cell are of different chirality, what we call alternating chirality.
In contrast to the reported systems, where porphyrins have been grown on metal surfaces only, we investigate here the monolayer H2TPP on the oxygen reconstructed Cu(110)–p(2 × 1)O surface. The half monolayer of oxygen reduces the reactivity towards aromatics and the H2TPP lowest unoccupied molecular orbital (LUMO) is no longer occupied on adsorption.23,24 Moreover, the oxygen induced added-row reconstruction features a stronger corrugation, which provides an ideal template for oriented molecule film growth25–28 and, in the case of H2TPP, allows thick epitaxially crystalline films to be grown.23,27
Here we show that H2TPP/Cu–O assembles into a densely packed commensurate monolayer structure, featuring two molecules per unit cell. Moreover, the monolayer is not only commensurate with the substrate, but also with thick crystalline films when grown on top, which makes the monolayer an excellent template for further growth. The molecules are oriented with their phenyl side groups pointing in [1![[1 with combining low line]](https://www.rsc.org/images/entities/char_0031_0332.gif) 0] and [001] directions. Only STM images recorded at very small bias voltages reflect the actual monolayer structure where individual molecules are discernable. Increasing the (absolute) bias voltage, the contrast changes into features of different brightness located at specific phenyl side groups. STM results suggest that the monolayer consists of molecules with alternating chirality to maximize the π–π overlap of the phenyl side groups. DFT calculations confirm the experimentally obtained adsorption site to be energetically preferred. Furthermore, the monolayer consisting of molecules with alternating chirality is found to be energetically clearly favourable. The experimental STM images and the different intensities of the phenyl side groups are compared to DFT simulations for a monolayer structure with single and alternating chirality, respectively.
0] and [001] directions. Only STM images recorded at very small bias voltages reflect the actual monolayer structure where individual molecules are discernable. Increasing the (absolute) bias voltage, the contrast changes into features of different brightness located at specific phenyl side groups. STM results suggest that the monolayer consists of molecules with alternating chirality to maximize the π–π overlap of the phenyl side groups. DFT calculations confirm the experimentally obtained adsorption site to be energetically preferred. Furthermore, the monolayer consisting of molecules with alternating chirality is found to be energetically clearly favourable. The experimental STM images and the different intensities of the phenyl side groups are compared to DFT simulations for a monolayer structure with single and alternating chirality, respectively.
Experimental and computational details
The STM experiments were carried out in a three chamber ultra-high vacuum (UHV) system (CreaTec, Germany) with a base pressure of ∼5 × 10⁻¹¹ mbar in the liquid helium (LHe) cooled measuring chamber and an LT-STM operation temperature of 5–6 K. The system is equipped with a LEED system and standard sample cleaning facilities.29 The STM measurements have been performed in constant current mode with electrochemically etched W tips, cleaned in situ by electron bombardment and by field emission via voltage pulses.The Cu(110) surface was cleaned by cycles of sputtering with Ar+ ions (700 eV) and annealing (825 K) in UHV. The Cu(110)–(2 × 1)O reconstruction was prepared by dosing 10 L (1 Langmuir (L) = 1 × 10⁻⁶ Torr s) of O2 at a sample temperature of 600 K. meso-Tetraphenylporphyrin (C44H30N4) has been deposited onto the oxygen covered Cu(110) surface at room temperature (320 K), using a home-made evaporator with a crucible. The sample has been cooled 60 min after the deposition to 77 K (liquid nitrogen) and subsequently transferred into the LHe pre-cooled STM.
DFT calculations have been performed with the Vienna ab initio simulation package (VASP),30,31 using the PAW method32 with a plane wave cut-off of 500 eV, a generalized gradient approximation (GGA) exchange–correlation functional33 and empirical VdW corrections according to Grimme.34 The Cu(110)–(2 × 1)O substrate is simulated with a 3 layer slab with frozen coordinates in the bottom two Cu layers, flexible atoms in the topmost Cu–O layer, and a 13.5 Å vacuum gap separating the slabs. Constant current STM simulations follow the Tersoff–Hamann approach.35
Results and discussion
The monolayer H2TPP on Cu–O of Fig. 1a displays a large scale image of the surface, where the substrate terraces are completely covered with the monolayer structure. Its appearance at bias voltages around 1 V is dominated by bright dashed lines in the STM images. Two mirror domains are formed, where the bright lines enclose angles of ±20° w.r.t. the [001] direction. Their origin is found in the molecular arrangement of the monolayer and its unit cell vectors, which are rotated with respect to the principal azimuthal directions of the substrate. Completely covered terraces usually feature only one mirror domain. Within the domains, translational domain boundaries are sometimes also found, visible as two bright dashed lines with only half the spacing, e.g.Fig. 1b. The FFT pattern of the STM images is identical to the experimentally obtained LEED pattern and the reported LEED pattern.27![Low temperature STM images of the monolayer H2TPP/Cu(110)–(2 × 1)O. (a) Overview on the surface. Two mirror domains are formed featuring bright dashed lines at ±20° with respect to the [001] direction. Imaging conditions: 1.3 V, 0.1 nA, (400 × 400) Å2. (b) Details of the monolayer with a translational domain boundary. Imaging conditions: 1.4 V, 0.1 nA, (200 × 200) Å2.](/image/article/2013/CP/c3cp44239j/c3cp44239j-f1.gif) | ||
| Fig. 1 Low temperature STM images of the monolayer H2TPP/Cu(110)–(2 × 1)O. (a) Overview on the surface. Two mirror domains are formed featuring bright dashed lines at ±20° with respect to the [001] direction. Imaging conditions: 1.3 V, 0.1 nA, (400 × 400) Å2. (b) Details of the monolayer with a translational domain boundary. Imaging conditions: 1.4 V, 0.1 nA, (200 × 200) Å2. | ||
While the overlayer lattice is easily identified, the basis is problematic as the individual molecules cannot be identified in STM images under most bias conditions. The inset in Fig. 1b shows a single molecule true to scale. To find a suitable tunneling set point where the single molecules are actually visible, the bias dependence of the monolayer has been examined. In the bias dependence of the monolayer, Fig. 2, two different contrasts can be distinguished. A bright dashed line structure in the STM contrast of the monolayer is seen for both empty and filled states with a bias above absolute voltages of ±0.1 V. The strongest corrugation of 1.5 Å is found at +1.4 V (dark holes to bright double protrusions). At small bias voltages, in the range of a few 10 mV (i.e., scanning with the tip in close vicinity to the surface), the appearance gradually changes and individual molecules become discernable. This new contrast resembles the carbon backbone of the molecules and is identical for all molecules, with a height corrugation of less than 0.8 Å.
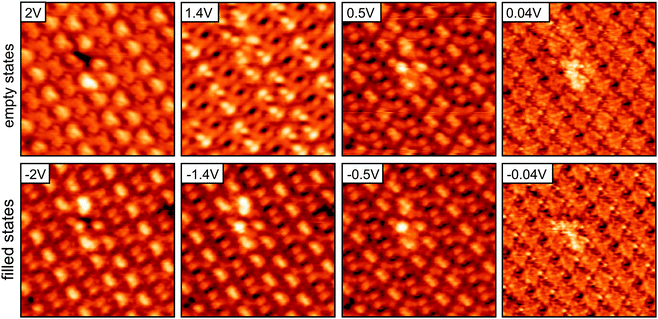 | ||
| Fig. 2 Bias dependence of the monolayer H2TPP/Cu–O STM images from empty state (positive sample bias) to filled state imaging conditions (negative sample bias). All images: 94 pA, (100 × 100) Å2. | ||
A comparison of three different STM contrasts representing roughly the region near the Fermi level EF (bias voltage of 22 mV) and the region close to the HOMO (highest occupied molecular orbital) and LUMO (lowest unoccupied molecular orbital) (bias voltages of −1.4 V and 1.4 V, respectively) is presented in Fig. 3. For convenience, models have been placed on the monolayer images, according to the structure observed in the near EF image. Clearly the molecules are oriented via their phenyl side groups, which are aligned along the high symmetry directions of the substrate [10] and [001]. This is in agreement with previous area averaging experiments. Both NEXAFS23 and orbital tomography with angle resolved UPS24 suggest an azimuthal orientation. The molecules are homogeneous and identical in appearance in the near EF image, but inhomogeneously highlighted in the images recorded at higher absolute bias. STM reveals a complex arrangement of next neighboring molecules in the monolayer. The images at higher bias voltages are dominated by the phenyl side groups. However, the four phenyls have very different apparent heights, as illustrated in Fig. 3b by the linescans taken across the molecule in the [10] and [001] directions (as indicated in the middle right image). In the direction of the long unit cell axis (indicated in the left 1.4 V image of Fig. 3), neighboring molecules either form staggered and closely spaced (S) or facing and widely spaced (F) arrangements (Fig. 3a, middle right image). Following one molecular chain along the long unit cell axis, these arrangements alternate, –S–F–S–F–. Only the phenyl side groups pointing in the [10] direction are prominent in the STM images; those within an F arrangement represent the brightest parts of the molecules (red ellipses), the second brightest places are the phenyls in S arrangement (blue ellipses). The linescans across the molecule shown in Fig. 3b are for one molecule of the unit cell. The other molecule in the unit cell has identical linescans albeit mirrored. In the [10] direction both phenyl side groups (PSGs) are visible as peaks separated by 12.4 Å with a difference in height of 0.35 Å. The more intense peak (right) is part of a bright dashed line. Across the molecule along [001], the phenyls are barely discernable from the small corrugation of the macrocycle.
![(a) Comparison of different STM contrasts, revealing the two structural arrangements (labeled S, F) between next neighboring molecules. The unit cell is indicated in the 1.4 V image. Note: the position of the hydrogen atoms in the center of the molecule's macrocycle remains unknown and thus has been chosen freely. Left images: 94 pA, (100 × 100) Å2. Right images: 94 pA, (40 × 40) Å2. (b) Linescans across the molecules in [11̲0] and [001] directions, taken from the right +1.4 V image of panel (a).](/image/article/2013/CP/c3cp44239j/c3cp44239j-f3.gif) | ||
| Fig. 3 (a) Comparison of different STM contrasts, revealing the two structural arrangements (labeled S, F) between next neighboring molecules. The unit cell is indicated in the 1.4 V image. Note: the position of the hydrogen atoms in the center of the molecule's macrocycle remains unknown and thus has been chosen freely. Left images: 94 pA, (100 × 100) Å2. Right images: 94 pA, (40 × 40) Å2. (b) Linescans across the molecules in [10] and [001] directions, taken from the right +1.4 V image of panel (a). | ||
At bias voltages that should allow access to the frontier molecular orbitals, only the bright dashed line structures are observed, which do not reflect the structure of the molecular orbitals. The electronic structure of H2TPP/Cu–O and orbital tomography investigated with ARUPS24 reveal that the HOMO and HOMO −1 are located at 1.3 eV and 1.7 eV below EF, respectively, and in this bias range the phenyl side groups dominate the STM contrast. Furthermore, both the HOMO and HOMO −1 have their electron densities centered at the macrocycle with only a small contribution located at the phenyl rings. Thus, the STM images measured at ±1.4 V do not purely display the molecular orbitals but are influenced by the geometric structure and adsorption site of the molecules. Around the Fermi level, where shape and structure of the molecules become visible in the STM images, there are no molecular states.
The structure of the monolayer, with respect to the Cu–O lattice parameters and its directions [10] and [001], is described by
The first matrix corresponds to the domain with bright STM features rotated anticlockwise w.r.t. the [001] direction, as in Fig. 1b. The unit cell contains two molecules positioned at (0,0) and (2,3) for the unit cell chosen here w.r.t. Cu–O spacings in the [10] and [001] directions, respectively. The layer density of 5.17 × 10¹³ molecules per cm2 is comparable to porphyrin monolayers on other surfaces, which have been reported to range between (4.5–5.4) × 1013 molecules per cm2.8–10
It is useful to compare the monolayer structure with the surface structure of the thick crystalline film of H2TPP/Cu–O. XRD identified the high index H2TPP(5 ![[0 with combining low line]](https://www.rsc.org/images/entities/char_0030_0332.gif) 3) plane to be parallel to the substrate.27 The molecules in this plane have their macrocycles parallel to the substrate surface, with the phenyl side groups twisted out of plane. Interestingly, both the H2TPP(5 3) surface plane of the thick film and the monolayer feature the same superlattice unit cell and are described (for a single domain) by the matrix presented above. However, while the H2TPP(5 3) plane of the thick film has only one molecule in the two-dimensional unit cell, the monolayer has twice the density and can be understood as two H2TPP(5 3) bulk planes merged into a single layer.
3) plane to be parallel to the substrate.27 The molecules in this plane have their macrocycles parallel to the substrate surface, with the phenyl side groups twisted out of plane. Interestingly, both the H2TPP(5 3) surface plane of the thick film and the monolayer feature the same superlattice unit cell and are described (for a single domain) by the matrix presented above. However, while the H2TPP(5 3) plane of the thick film has only one molecule in the two-dimensional unit cell, the monolayer has twice the density and can be understood as two H2TPP(5 3) bulk planes merged into a single layer.
Before moving to the detailed monolayer's internal structure, the lattice is compared to other porphyrin layers on Cu(110) surfaces. The LEED study in ref. 23 of the monolayer PtTPP/Cu–O and PtTPP/Cu, as well as the multilayer PtTPP/Cu–O, reveals the same lattice as observed here for the monolayer H2TPP/Cu–O. Although the molecular density of these films is not known, a unit cell with two molecules might be expected. In contrast, the monolayer H2TPP on clean Cu(110) arranges in a dense structure with only one molecule per unit cell.
Compared to examples from the literature, the monolayer CoTPP on Cu(110), ref. 10, bears the most similarities to the present work. Both layers are commensurate, although CoTPP arranges in a structure with a primitive unit cell, while H2TPP on Cu–O features two molecules in the repeating unit. Despite this detail, and although the adsorption sites are not comparable per se, the STM images of both monolayers are dominated by protrusions located at the phenyl side groups. However, all phenyls are of nearly equal brightness in the case of CoTPP.
In order to determine the adsorption site of the molecule, terraces which are not completely covered have been investigated. On such terraces, the monolayer structure is undisturbed even in the close vicinity of the bare Cu–O substrate regions. A grid has been placed in the troughs of the Cu–O corrugation to determine the adsorption site. DFT calculations of a single molecule adsorbed with its center either above the trough or the ridge of the Cu–O surface have been performed. In the starting configuration, the flat macrocycle is 3.1 Å above the Cu–O surface and the phenyl side groups are tilted propeller-like with a twist angle of 50° w.r.t. the plane of the macrocycle. Fig. 4a displays the lowest energy configuration obtained after the relaxation, which is in agreement with the experimentally observed adsorption site: the phenyl side groups (PSGs) of the molecule pointing in the [001] direction are situated in-between the Cu–O rows and are now twisted by ∼70° w.r.t. the macrocycle. This site and orientation within the Cu–O rows stabilize the molecule against rotation. This is in agreement with NEXAFS experiments, where the macrocycle has been found to be flat and the phenyl side groups twisted.24 The center of the macrocycle is situated in the same trough, above a long bridge site of Cu atoms. Furthermore, the calculation shows that the PSGs directed parallel to [10] are placed on Cu–O rows. These phenyls go to a slightly lower twist angle of only ∼65° w.r.t. the macrocycle; additionally, they are bent away from the surface, as seen in Fig. 4a.
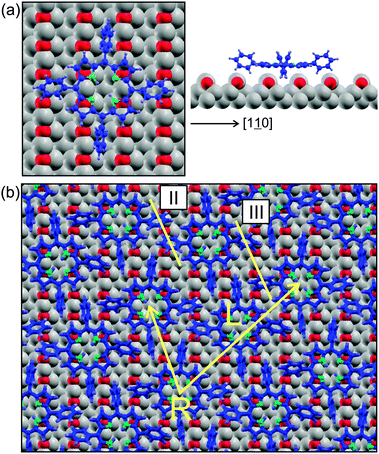 | ||
| Fig. 4 The adsorption site of H2TPP on Cu(110)–(2 × 1)O. (a) DFT result for the adsorption site of a single molecule, relaxed on the Cu–O surface. Cu atoms are grey, O red, C blue, H light blue, N green. (b) DFT results of the monolayer structure with alternating chirality. The linescans II and III, which are presented in Fig. 7, are indicated. | ||
While the molecule–substrate interaction is provided mainly by the (almost) flat macrocycle, intermolecular interaction is driven by the phenyl side groups. Their orientation w.r.t. each other and the spacing can be used to classify the quality of the overlap, i.e. close spaced parallel PSGs are assumed to contribute most to the molecule–molecule interaction.10 The complex structure of the monolayer H2TPP/Cu–O results in several configurations for PSGs of neighboring molecules, where parallel and perpendicular arrangements can be distinguished. Parallel PSGs pointing along [10] are spaced 4.5 Å (red ellipse in Fig. 3a, bottom right) and 6 Å (blue ellipse) measured in the direction of the bright dotted lines (20° rotated w.r.t. [001]). Both values are in the range of attractive π–π interaction, when compared to the spacing of bulk sexiphenyl with 5.6 Å,26 and the molecules in the bilayer sexiphenyl on Cu(110) with 6.7 Å.28 Note that in general phenyls stack parallelly but not co-facially. Parallel PSGs in [001] have similar spacings, but sitting in neighboring troughs they are separated by Cu–O rows. If π–π interaction exists, the phenyl planes will be parallel, and this will necessarily imply alternating chirality of neighboring molecules. The overlap is maximized when the PSGs are tilted in-phase (\\ or //) rather than anti-phase ( or
or  ). The former is only achieved for next neighboring molecules (along the long axis of the unit cell) of alternating chirality. For the model of two H2TPP(5 3) planes merged into the monolayer, this can be understood as two homochiral H2TPP(5 3) planes, where the layers are of different chirality. This results in pairs of PSGs being in-phase along [10], but anti-phase in the [001] direction.
As alternating chirality has never before been suggested for any TPP monolayers, a deeper understanding was sought through DFT calculations. For free standing layers single chirality (SC) and alternating chirality (AC) were of equal energy, while on the substrate they were significantly different. Calculations of the monolayer structure have been performed for both configurations with SC and AC, as illustrated in Fig. 5a. The unit cell with two molecules and the adsorption site on Cu–O are as described earlier, the starting twist angle of the PSGs was 50°. Smaller twist angles combined with a smaller distance above the Cu–O were found to be energetically preferred. After 126 (SC) and 150 (AC) relaxation steps, respectively, the adsorption energy curves, shown in Fig. 5b, are sufficiently flat with dE per step ≤2 meV. This corresponds to forces below 0.02 eV Å−1. The configuration with alternating chirality is clearly favoured with an energy difference of 200 meV per molecule w.r.t. the single chiral monolayer (Fig. 5b, lower panel). Due to the large unit cell size containing almost 300 atoms a further geometry relaxation is computationally very demanding. Nevertheless, by extrapolating the relaxation energy curves (dotted and dashed lines in Fig. 5b, lower panel) we still expect the energy difference between the SC and AC structure to be ∼100 meV per molecule, which is well beyond typical errors in DFT. We define the adsorption energy per molecule in the following way:
| Ead = [Etotal − (2Emol + Esub)]/2 |
Here, Etotal denotes the total energy of the combined system, Emol is the energy of one isolated H2TPP molecule and Esub is the energy of the substrate. The factor of 2 takes into account the fact that there are two molecules in the unit cell. The adsorption energies after 126 iterations when decomposed into contributions from the molecule–substrate (m–s) interaction and the molecule–molecule (m–m) interaction as follows.
| SC: −Ead/mol = 5.65 eV = 3.24 eV (m–s) + 2.41 eV (m–m) |
| AC: −Ead/mol = 5.86 eV = 3.33 eV (m–s) + 2.53 eV (m–m) |
One sees that both m–s and m–m interactions favor alternating chirality.
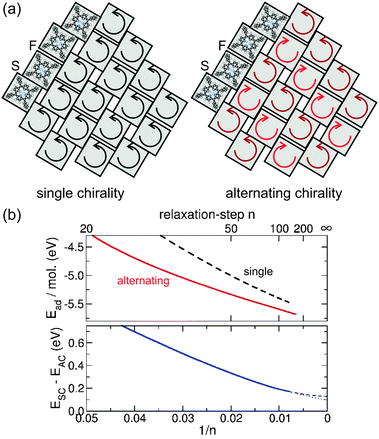 | ||
| Fig. 5 The monolayer structure with single and alternating chirality. (a) Schematic drawing of the monolayer configurations for single chirality and alternating chirality. Molecules are represented as grey squares, the circular arrows indicate their handedness. (b) The top panel shows the adsorption energy per molecule as a function of the inverse number of DFT relaxation steps for the alternating chirality (AC) as well as for the single chirality monolayer (SC). For better comparison, the bottom panel displays the energy differences between SC and AC adsorption energies per molecule in the same reciprocal dependence on the relaxation steps. As a guide to the eye, linear (dotted line) and quadratic (dashed line) extrapolations to an infinite number of relaxations steps are shown, which are used to define a lower bound for the energy difference between SC and AC. | ||
A model of the relaxed monolayer with alternating chirality is presented in Fig. 4b. The right and left handed molecules of the unit cell, R and L, show distortions w.r.t. the gas phase configuration, which are similar to the single adsorbed molecule presented in Fig. 4a. Although the sites are the same, the two molecules of the basis are not identical anymore, but the differences between them are subtle. Both macrocycles are not completely flat but curved due to the upward bent PSGs pointing in the [10] direction. The phenyl twist angles are ∼54° in [10] and ∼75° in the [001] direction for both molecules; these values differ from those calculated for the single molecule adsorbed on Cu–O of 65° and 75°. This can be attributed to the close vicinity and interaction of the molecules in the monolayer. Additionally, there are other minor distortions and also the substrate surface rumples slightly.
As alternating chirality seems to be energetically favourable, we now turn to see if it can also be distinguished from single chirality in the STM images. Fig. 6 displays the calculated projected DOS and simulated STM images of the monolayers for bias voltages near the HOMO and LUMO energies in comparison with the experiment. As seen in the projected DOS of Fig. 6a, both HOMO and LUMO are dominated by the macrocycle with little contributions from the PSGs, which have their main contributions beyond ±2.5 V. Nevertheless, highest intensities in both calculated and experimental STM images are located at the PSGs. This can be explained by the topography of the monolayer, where the PSGs represent the highest regions above the substrate, while the macrocycle stays close to the substrate. At first glance both AC and SC constant current simulations fit the experiment reasonably well. However, they are subtly different and, on careful inspection, the AC does indeed fit the experimental results better. To demonstrate this, linescans taken from the experimental (+1.4 V) and simulated (LUMO) STM images of Fig. 6 are presented in Fig. 7. In order to facilitate the comparison between experimental and simulated linescans, we have taken into account the fact that—for numerical reasons—the simulated current obtained from the Tersoff–Hamann approach was set to be one order of magnitude larger than the measured one. As a consequence, STM simulations probe the local density of states at a considerably smaller tip-sample distance leading to an overall larger corrugation in the scans as compared to experimental STM ones (roughly a factor of two). Thus, in Fig. 7 we have retained experimental and simulated height scales separately on the left and right axes, respectively, where the height range in the simulations is a factor of two larger than the corresponding value for the experimental scans.
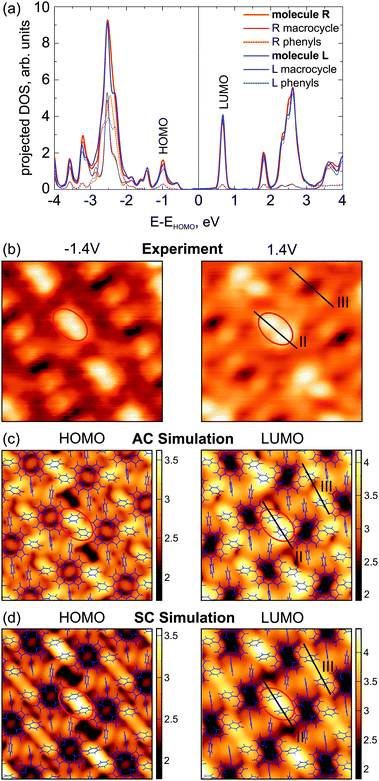 | ||
| Fig. 6 (a) Projected DOS of both molecules of the unit cell (labelled R, L) with alternating chirality. The contributions from the phenyl side groups are dotted. (b) Experimental STM images corresponding to HOMO and LUMO voltages. Both images: 94 pA, (40 × 40) Å2. (c) STM simulations at constant current for the HOMO and LUMO region of the structure with alternating chirality. (40 × 40) Å2, z-scale in Å. (d) The same for the structure with single chirality. | ||
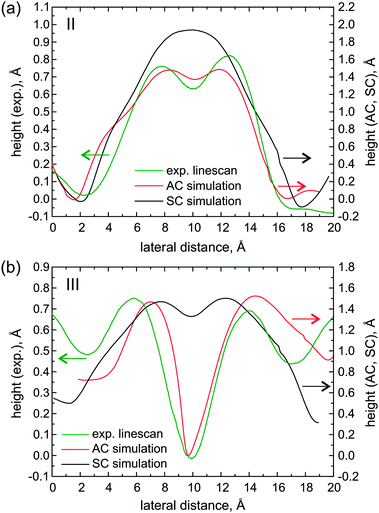 | ||
| Fig. 7 (a) Linescans across phenyl side groups following line II: the experimental STM image at +1.4 V (green curve) and the calculated LUMO STM image with alternating chirality (red) and single chirality (black). (b) The same as before for line III. Where the linescans are taken is indicated in the model of Fig. 4b and in the experimental data of Fig. 6. | ||
Fig. 7a shows profiles measured symmetrically across a phenyl pair (linescan II). The experimental curve (green) features two peaks ∼4.7 Å apart. A double peak with a spacing of 3.6 Å is also present in the simulated linescan of the structure with alternating chirality (red), where the phenyls are in-phase (//). In contrast, the monolayer with single chirality yields a broad single peak (black) (centered between the double peak of the experimental curve), which can be attributed to a phenyl pair twisted anti-phase ( ). Turning now to the dark regions that are prominent in the experiment (Fig. 6b, linescan III): comparing linescans of this region to those of the simulations one sees that for the alternating chirality there is indeed a prominent dip similar to the experimental curve, while the depression is very weak in the case of single chirality, see Fig. 7b.
Conclusions
In this work, the monolayer H2TPP on Cu(110)–(2 × 1)O has been investigated with low temperature STM. It has been found to form a well-defined structure which is commensurate to the Cu–O substrate and also to the H2TPP(5 3) bulk planes that grow on it. The layer density is similar to other TPP monolayers on metal surfaces. However, there are two molecules per unit cell, which can be understood as two H2TPP(5 3) bulk planes merged into the monolayer. The molecules in the monolayer adsorb with their macrocycles parallel to the surface, and the phenyl side groups are twisted out of the plane. All molecules have the same adsorption site and are oriented with their phenyls pointing along the high symmetry directions of the substrate, [001] and [10]. Stabilizing π–π phenyl interaction can only be explained by alternating chirality of neighboring molecules. The concept of alternating chirality rather than single chirality (which is usually observed) is supported by DFT results, where a difference in the adsorption energy of ∼100 meV per molecule in favor of AC has been calculated. STM simulations of these structures also support this conclusion.
Acknowledgements
This work has been supported by the ERC Advanced Grant SEPON and the Austrian Science Funds FWF “Understanding photoemission of organic molecular films” (P23190-N16). CPU time at the Vienna Scientific Cluster (VSC) via “Electronic structure of organic/metal interfaces” (project 70310) is gratefully acknowledged.Notes and references
- K. Ono, M. Joho, K. Saito, M. Tomura, Y. Matsushita, S. Naka, H. Okada and H. Onnagawa, Eur. J. Inorg. Chem., 2006, 2006, 3676–3683 CrossRef.
- C.-M. Che, H.-F. Xiang, S. S.-Y. Chui, Z.-X. Xu, V. A. L. Roy, J. J. Yan, W.-F. Fu, P. T. Lai and I. D. Williams, Chem.–Asian J., 2008, 3, 1092–1103 CrossRef CAS.
- S. Fukuzumi, Phys. Chem. Chem. Phys., 2008, 10, 2283–2297 RSC.
- B. A. Friesen, B. Wiggins, J. L. McHale, U. Mazur and K. W. Hipps, J. Am. Chem. Soc., 2010, 132, 8554–8556 CrossRef CAS.
- N. A. Rakow and K. S. Suslick, Nature, 2000, 406, 710–713 CrossRef CAS.
- J. Kim, S.-H. Lim, Y. Yoon, T. D. Thangadurai and S. Yoon, Tetrahedron Lett., 2011, 52, 2645–2648 CrossRef CAS.
- C. Wäckerlin, K. Tarafder, D. Siewert, J. Girovsky, T. Hählen, C. Iacovita, A. Kleibert, F. Nolting, T. A. Jung, P. M. Oppeneer and N. Ballav, Chem. Sci., 2012, 3, 3154–3160 RSC.
- L. G. Teugels, L. G. Avila-Bront and S. J. Sibener, J. Phys. Chem. C, 2011, 115, 2826–2834 CAS.
- G. Rojas, X. Chen, C. Bravo, J.-H. Kim, J.-S. Kim, J. Xiao, P. A. Dowben, Y. Gao, X. C. Zeng, W. Choe and A. Enders, J. Phys. Chem. C, 2010, 114, 9408–9415 CAS.
- P. Donovan, A. Robin, M. S. Dyer, M. Persson and R. Raval, Chem.–Eur. J., 2010, 16, 11641–11652 CrossRef CAS.
- K.-H. Ernst, Phys. Status Solidi B, 2012, 249, 2057–2088 CrossRef CAS.
- A. Baiker, Catal. Today, 2005, 100, 159–170 CrossRef CAS.
- F. Chen, X. Chen, L. Liu, X. Song, S. Liu, J. Liu, H. Ouyang, Y. Cai, X. Liu, H. Pan, J. Zhu and L. Wang, Appl. Phys. Lett., 2012, 100, 081602 CrossRef.
- Frontmatter and Index, Molecular Switches, ed. B. L. Feringa, Wiley-VCH Verlag GmbH, Weinheim, FRG, 2001, DOI:10.1002/3527600329.fmatter_indsub.
- R. Fasel, J. Wider, C. Quitmann, K.-H. Ernst and T. Greber, Angew. Chem., Int. Ed., 2004, 43, 2853–2856 CrossRef CAS.
- F. Tao and S. L. Bernasek, J. Phys. Chem. B, 2005, 109, 6233–6238 CrossRef CAS.
- T. Huang, Z. Hu, B. Wang, L. Chen, A. Zhao, H. Wang and J. G. Hou, J. Phys. Chem. B, 2007, 111, 6973–6977 CrossRef CAS.
- T. Huang, Z. Hu, A. Zhao, H. Wang, B. Wang, J. Yang and J. G. Hou, J. Am. Chem. Soc., 2007, 129, 3857–3862 CrossRef CAS.
- C. B. France and B. A. Parkinson, J. Am. Chem. Soc., 2003, 125, 12712–12713 CrossRef CAS.
- D. Écija, M. Trelka, C. Urban, P. de Mendoza, E. Mateo-Martí, C. Rogero, J. A. Martín-Gago, A. M. Echavarren, R. Otero, J. M. Gallego and R. Miranda, J. Phys. Chem. C, 2008, 112, 8988–8994 Search PubMed.
- D. Écija, K. Seufert, D. Heim, W. Auwärter, C. Aurisicchio, C. Fabbro, D. Bonifazi and J. V. Barth, ACS Nano, 2010, 4, 4936–4942 CrossRef.
- M. J. Hamor, T. A. Hamor and J. L. Hoar, J. Am. Chem. Soc., 1964, 86, 1938–1942 CrossRef CAS.
- S. Gusenleitner, Master's thesis, Karl-Franzens Universität, 2009 Search PubMed.
- P. Puschnig, G. Koller, C. Draxl and M. G. Ramsey, The structure of molecular orbitals investigated by angle-resolved photoemission, in Small Organic Molecules on Surfaces – Fundamentals and Applications Springer Series in Materials Science, ed. H. Sitter, C. Draxl and M. Ramsey, 2013, 173, ISBN 978-3-642-33847-2 http://www.springer.com/978-3-642-33847-2 Search PubMed.
- M. Oehzelt, S. Berkebile, G. Koller, J. Ivanco, S. Surnev and M. G. Ramsey, Surf. Sci., 2009, 603, 412–418 CrossRef CAS.
- M. Oehzelt, L. Grill, S. Berkebile, G. Koller, F. P. Netzer and M. G. Ramsey, ChemPhysChem, 2007, 8, 1707–1712 CrossRef CAS.
- T. Djuric, T. Ules, S. Gusenleitner, N. Kayunkid, H. Plank, G. Hlawacek, C. Teichert, M. Brinkmann, M. G. Ramsey and R. Resel, Phys. Chem. Chem. Phys., 2012, 14, 262–272 RSC.
- M. Wagner, PhD thesis, Karl-Franzens Universität, 2012 Search PubMed.
- A. Gumbsch, G. Barcaro, M. G. Ramsey, S. Surnev, A. Fortunelli and F. P. Netzer, Phys. Rev., 2010, 81, 165420 CrossRef.
- G. Kresse and J. Furthmüller, Phys. Rev. B: Condens. Matter Mater. Phys., 1996, 54, 11169 CrossRef CAS.
- T. Auckenthaler, V. Blum, H.-J. Bungartz, T. Huckle, R. Johanni, L. Krämer, B. Lang, H. Lederer and P. Willems, Parallel Comput., 2011, 37, 783–794 CrossRef.
- G. Kresse and D. Joubert, Phys. Rev. B: Condens. Matter Mater. Phys., 1999, 59, 1758 CrossRef CAS.
- J. P. Perdew, K. Burke and M. Ernzerhof, Phys. Rev. Lett., 1996, 77, 3865 CrossRef CAS.
- S. Grimme, J. Comput. Chem., 2006, 27, 1787 CrossRef CAS.
- J. Tersoff and D. R. Hamann, Phys. Rev. B: Condens. Matter Mater. Phys., 1985, 31, 805–813 CrossRef CAS.
| This journal is © the Owner Societies 2013 |