Quantum yields for the photolysis of glyoxal below 350 nm and parameterisations for its photolysis rate in the troposphere
Received
11th October 2012
, Accepted 28th January 2013
First published on 31st January 2013
Abstract
The formation of HCO and of H in the photolysis of glyoxal have been investigated over the wavelength ranges 310–335 nm for HCO and 193–340 nm for H. Dye laser photolysis was coupled with cavity ring-down spectroscopy for HCO, and with laser induced fluorescence spectroscopy for H. Absolute quantum yields were determined using actinometers based on (a) Cl2 photolysis and the Cl + HCHO reaction for HCO and (b) N2O photolysis (and O1D + H2) and CH2CO photolysis (and CH2 + O2) for H. The quantum yields were found to be pressure independent in this wavelength region. Quantum yields for all product channels under atmospheric conditions were calculated and compared with literature values. Differences between this work and previously published work and their atmospheric implications are discussed.
1. Introduction
In our companion paper1 we discussed the photolysis mechanism of glyoxal (HCO)2 in the wavelength region 355–414 nm showing that above 395 nm, photolysis can occur through two electronic states. In this paper we report data from shorter wavelength (193–355 nm) photolysis, detecting both H and HCO products, and focus on the atmospheric implications of the measurements.
Glyoxal, is the smallest α-dicarbonyl and is ubiquitous within the global troposphere with a wide range of sources sources.2 It is formed through the photo-oxidation of many volatile organic compounds (VOCs) including alkenes,3 acetylene,4–6 glycolaldehyde7 and aromatics in the presence of NOx.8–10 Most importantly, glyoxal is a minor product (∼6%)2 of isoprene photo-oxidation, which is globally the most abundant biogenic non-methane hydrocarbon (∼500 TgC y−1 released to the atmosphere).11 These secondary sources, along with primary emissions from combustion (e.g. car exhausts12,13), make glyoxal highly relevant for study, especially in the contexts of tropical forests, urban air pollution and plumes from biomass burning.2,14 Glyoxal has been observed throughout the troposphere. Elevated concentrations (up to 1–1.2 ppbv at midday in Mexico City)15 have also been measured in urban areas.16 Glyoxal reacts relatively slowly with OH (k296K = 8.8 × 10⁻¹² cm3 mol−1 s−1),17 giving it an atmospheric lifetime with respect to removal by OH, τOH, of ∼1 day for [OH] ∼ 1 × 10⁶ mol cm−3.18 The major removal process for glyoxal in the troposphere is photolysis, with τPhot ∼ 2–3 hours.18,19 Photolysis of glyoxal can take place at wavelengths that are available within the troposphere. Glyoxal is not only photolysed in the UV region where other carbonyl species absorb, but also in the blue region of the visible spectrum where the atmospheric flux is much greater. Photolysis can lead to the production of the formyl radical, HCO, which plays an important atmospheric role as it reacts quickly with O2 to form HO2 radicals:20,21
In turn, HO2 can be converted to OH, for example by reaction with NO, and hence glyoxal photolysis may influence the oxidising capacity of the atmosphere. Glyoxal may also play a role in the formation of secondary organic aerosol22–24 affecting surface processes, the Earth's radiative balance and human health. It is therefore important to have accurate data concerning the rate of removal of glyoxal and production of HCO via its photolysis.
Both radical and molecular channels occur in the tropospherically significant wavelength range:
| | | (HCO)2 + hν → 2HCO λ ≤ 413 nm | (P1a) |
| | | → HCO + H + CO λ ≤ 342 nm | (P1b) |
| | | → CH2O + CO Exothermic, all λ | (P1c) |
| | | → H2 + 2CO Exothermic, all λ | (P1d) |
| | | → HCOH + CO Exothermic, all λ | (P1e) |
| | | → 2H + 2CO λ ≤ 291 nm | (P1g†) |
In the atmosphere, the radical channels all lead to formation of 2HO2, via H + O2 + M, or reaction R1 so that glyoxal photolysis provides photolysis routes to HOx radicals.
Experimental studies of glyoxal photolysis using lamps25 and laser techniques26 have been designed to determine products under atmospheric conditions; they show that (P1a) is the major, but not exclusive, channel under atmospheric conditions. Chen and Zhu,26 using cavity ring-down spectroscopy (CRDS) to monitor HCO, determined the quantum yield as a function of pressure and wavelength (290–420 nm) following dye laser photolysis of glyoxal. Feierabend et al.27 used the same experimental technique, over a similar wavelength range, but at a much more extensive number of wavelengths and with better HCO sensitivity due to greater overlap of the CRDS and photolysis beams. Tadic et al.25 used a range of lamps as photolysis sources and FTIR to monitor the removal of glyoxal and identify the photolysis products; their results were substantiated by comparison with glyoxal loss experiments in an atmospheric chamber. In the companion paper we used the same technique as Chen and Zhu and Feierabend et al. at wavelengths above 350 nm to investigate the photolysis mechanism of glyoxal, showing that at λ > 395 nm, two electronic states appear to be involved in the dissociation.1 All these studies indicate that, for λ > 350 nm, channel (P1a) is dominant and that the HCO yield is pressure dependent. At shorter wavelengths other channels, and particularly (P1c) becomes important and it has also been suggested that (P1d) is also significant.
The present paper examines the photolysis of glyoxal for λ ≤ 350 nm using detection of HCO and of H. We show that the major photolysis channels in this wavelength region are (P1a), (P1b) and (P1c) and that the yield of (P1d) is less than 0.1. The data from this and the previous paper have been parameterised to a functional form that predicts the quantum yield for glyoxal photolysis as a function of wavelength, pressure and temperature for each of the main product channels. This parameterisation is then used to calculate atmospheric photolysis rates, which are compared with those from previous studies, and the atmospheric implications are considered.
2. Experimental
The methods used for detecting HCO (via cavity ring down spectroscopy (CRDS)) and for calibrating the quantum yield were described in the companion paper.1 In addition to those CRDS studies, a series of pulsed laser photolysis (PLP) experiments were carried out at room temperature at photolysis wavelengths 193, 308, 316.7 and 339.7 nm detecting the H atom products via vacuum ultraviolet laser induced fluorescence (VUV LIF) spectroscopy. The details of the PLP – VUV LIF apparatus have been described before;28 briefly H atoms were generated from the pulsed photolysis of glyoxal in a metal, slow flow cell using either an excimer laser (193 or 308 nm) or a dye laser (316.7 and 339.7 nm). Pulsed probe radiation at 121.6 nm was generated by tripling the focused output of an excimer pumped dye laser at 364.8 nm in a glass cell containing a krypton argon mix (1![[thin space (1/6-em)]](https://www.rsc.org/images/entities/char_2009.gif) :2.5) at ∼800 Torr and coupled directly into the flow cell, perpendicularly to the photolysis beam, by a MgF2 window. Resonance fluorescence was detected perpendicularly to both light beams with a solar blind photomultiplier tube (Perkin-Elmer CPM-18). The VUV intensity was monitored via a second photomultiplier tube and used to normalize the fluorescence on a pulse-to-pulse basis and to account for absorption of 121.6 nm light by substrate species.29 Time profiles of the H atom signal were recorded (for example, see Fig. 1) and fitted to yield the zero time signals. The H atom yield from glyoxal photolysis was put onto an absolute basis by comparison to reference reactions, see below.
:2.5) at ∼800 Torr and coupled directly into the flow cell, perpendicularly to the photolysis beam, by a MgF2 window. Resonance fluorescence was detected perpendicularly to both light beams with a solar blind photomultiplier tube (Perkin-Elmer CPM-18). The VUV intensity was monitored via a second photomultiplier tube and used to normalize the fluorescence on a pulse-to-pulse basis and to account for absorption of 121.6 nm light by substrate species.29 Time profiles of the H atom signal were recorded (for example, see Fig. 1) and fitted to yield the zero time signals. The H atom yield from glyoxal photolysis was put onto an absolute basis by comparison to reference reactions, see below.
 |
| | Fig. 1 Comparison of the H atom time profiles from 193 nm photolysis of glyoxal (2.87 × 10¹⁴ mol cm−3) against photolysis of N2O (2.87 × 10¹⁴ mol cm−3)/H2, the reference system. The N2O concentration was fixed to give a similar H atom signal: open squares = glyoxal and filled circles = N2O. | |
The photolysis light in the range 310–335 nm was generated by doubling the output of a dye laser (Sirah GmbH, PrecisionScan) pumped using the second harmonic of a Nd:YAG laser (Continuum, Powerlite, 8010). Dyes used to cover the full photolysis wavelength range were DCM and a DCM/Pyridine 1 mixture; average laser energies throughout the range varied from 3–8 mJ per pulse, dependent upon wavelength, with a ∼0.12 cm2 beam profile. 193 nm radiation was generated from an ArF excimer laser (GAM EX5), with a typical output of 5 mJ per pulse. 308 nm radiation was generated from an XeCl excimer laser (Lambda Physik), with a typical output of 30 mJ per pulse.
Helium (BOC, CP), nitrogen (Air Products, 99.999%), argon (BOC Gases, >99.998%), hydrogen (BOC, HP) and N2O (BOC, 99.9%) were all used straight from cylinders without further purification. Glyoxal was obtained by pyrolysis of glyoxal dihydrate trimer (Fluka, ≥95%) in the presence of phosphorous pentoxide, P2O5. The monomeric glyoxal produced was passed through a P2O5 column before being trapped in a Dreschel bottle immersed in liquid nitrogen. The solid monomer was then put through freeze-pump-thaw cycles before usage. Ketene was generated by the pyrolysis of acetic anhydride and purified by trap-to-trap distillation.30 Ketene and glyoxal were stored in darkened Pyrex bulbs and diluted with nitrogen before usage. The purity of glyoxal samples was checked by UV/visible spectroscopy on a high resolution spectrometer (Perkin-Elmer, Lambda 900, resolution = 0.05 Å) and daily on a lower, resolution spectrometer which could be attached to the gas line (Ocean Optics, HR4000CG-UV-NIR with DH-2000-BAL light source).16 This spectrometric assignment for the glyoxal concentration was used for the present study but it is noted that the concentration based on pressure readings was in agreement.
3. Results
The methodology for determining the absolute quantum yield for HCO formation using a chlorine/HCHO actinometer was described in the companion paper.1 The approach for constructing Stern–Volmer (SV) plots of the reciprocal HCO quantum yield, ΦHCO, versus the concentration of the diluent gas was also discussed there. The analysis depends on the assumption that a competition occurs in the initially excited singlet state, S1*, between collisional stabilisation and dissociation. The relationship used is:| |  | (E1) |
where kq/kd is the ratio of the quenching to the dissociation rate coefficients, where dissociation refers to all operative photolysis channels. Φ0,HCO = 2kda/kd, where kda is the rate coefficient for dissociation of S1* viachannel (P1a), is the HCO yield at zero pressure and kq/kd is the slope/intercept ratio of the Stern–Volmer plot. The zero-pressure quantum yield for photolysis via all channels is unity within this model and the lifetime of S1* is 1/kd.
A Stern–Volmer plot of the 335 nm data is shown in Fig. 2, where within the scatter of the data, the HCO yield is independent of [N2]. For reasons that will be discussed below, the intercept has been scaled to unity, so that the slope of the plot shown is equal to kq/kd. Similar behaviour was found at 320 and 310 nm, as shown in Table 1, which also gives the values of the diluent concentration at which the absolute quantum yield was determined, the measured quantum yield at this concentration of the diluent and Φ0,HCO.
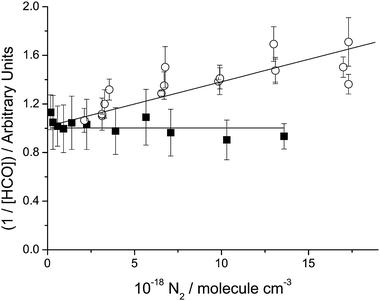 |
| | Fig. 2 Typical Stern–Volmer plot for the λ ≤ 350 nm region. Data (filled squares) shown are from photolysing ∼1.1 × 10¹⁵ mol cm−3 of glyoxal at 335 nm, 298 K. Also included are 335 nm data (open circles) from Feierabend et al.27 Both sets of data have been rescaled to give an intercept of unity, so that the slope/intercept ratio is equal to kq/kd. | |
Table 1 Stern–Volmer parameters obtained from the pressure dependence of the HCO quantum yield from glyoxal photolysis over the wavelength range 310–335 nm at 298 K. The Stern–Volmer plot returns an intercept and slope, which can be used to assign Φ0,HCO, and kq/kdviaeqn (E1). The total pressure refers to the pressure at which the absolute quantum yield determination was made, and ΦHCO,p to the quantum yield measured at that pressure. Errors are 1σ
|
λ/nm |
Total pressure (N2)/molecule cm−3 |
Φ
HCO,p
|
Φ
0,HCO
|
1020 (kq/kd)/cm3 mol−1 |
| 335 |
7.05 × 10+18 |
1.19 ± 0.06 |
1.08 ± 0.08 |
−0.99 ± 0.85 |
| 320 |
6.89 × 10+18 |
1.08 ± 0.04 |
1.08 ± 0.04 |
0.45 ± 0.73 |
| 310 |
7.07 × 10+18 |
0.71 ± 0.03 |
0.67 ± 0.08 |
−0.3 ± 3.1 |
The H atom yield from glyoxal was determined at 193, 308, 317 and 340 nm. The H atom fluorescence signal from glyoxal photolysis was compared with a known reference system in order to assign the absolute H atom yield. At 193 nm, the H atom reference was photolysis of N2O in the presence of an excess of H2:
| | | N2O + hν (193 nm) → O(1D) + N2 | (P2) |
Reference reaction R2 has only a single product channel,31 with a negligible non-reactive yield of O(3P), and N2O is straightforward to handle and has a known absorption cross-section at 193 nm, 8.95 × 10⁻²⁰ cm2.32Fig. 1 shows back-to-back experiments where an H atom profile from glyoxal photolysis is compared to one from the 193 nm N2O/H2 reference system. Here the H atom time profiles were fitted by eqn (E1a), where the zero time signal is [H]0:
| | | [H] = [H]0 exp(−kLt) | (E2a) |
This single-exponential equation is valid because reference reaction R2 is so fast that the reference H atom production is essentially instantaneous, and the same time dependent equation can be used for both the reference and
glyoxal H atom signals.
kL is equal to the rate constant for slow loss of H from the system, mainly by diffusion from the monitoring zone, which may reasonably be approximated as an exponential. The H atom quantum yield from
glyoxal photolysis was obtained from the ratio of the [H]
0 signals and is given by:
| |  | (E3) |
where [H]
0 is the zero time H atom signal from either
glyoxal photolysis or the reference
31 and
σ(
λ) is the absorption cross-section of either
glyoxal or the reference, N
2O
32 or
ketene (see below),
33 at the photolysis wavelength,
λ. These
glyoxal experiments were performed with helium as the
buffer gas in order to avoid correcting the H atom signal for fluorescence quenching. Since the photolysis yield is independent of pressure (see above) these yields do not depend on the diluents used.
At the longer wavelengths, 308, 316.7 and 339.7 nm, the H atom reference was the photolysis of ketene in the presence of O2:
| | | CH2CO + hν (308–340 nm) → CH2 + CO | (P3) |
| | | CH2 + O2 → H + products | (R3) |
While the photolysis of
ketene produces both singlet and triplet CH
2, all singlet CH
2 is rapidly deactivated to the triplet by O
2,
34,35 so that all the observed H from reaction R3 is
via triplet CH
2. The H atom yield from this reaction is known, 0.8 ± 0.2.
34 The H atom traces at these longer wavelengths for the reference reaction were fitted using
eqn (E2b), a modification of (E2a), where the photolytic concentration was set to zero:
| |  | (E2b) |
and
kH,F and
kH,L are the first order rate coefficients for the formation and loss of H, respectively.
ΦH at these longer wavelengths was obtained from
eqn (E2b), where the denominator also included 0.8 in order to take account of the H atom yield from the reference. The results for all the wavelengths are given in
Table 2.
Table 2 H atom yield from glyoxal photolysis, Φ0,H. Errors are 1σ
|
λ/nm |
[Glyoxal]/1014 molecule cm−3 |
Φ
0,H
|
1020σ/cm2 |
Reference |
| 193 |
0.7–4.5 |
0.95 ± 0.12 |
8.9532 |
[N2O] = 4.7–24 × 1014 |
| [H2] = 1.1 × 10¹⁷ |
| 308 |
5.6 |
0.39 ± 0.04 |
3.6033 |
[CH2CO] = 3.5 × 10¹⁴ |
| [O2] = 6.6 × 10¹⁶ |
| 308 |
5.6 |
0.32 ± 0.02 |
3.6033 |
[CH2CO] = 0.9–3.5 × 10¹⁴ |
| [O2] = 6.6 × 10¹⁶ |
| 316.7 |
2.6–12 |
0.27 ± 0.07 |
4.2433 |
[CH2CO] = 0.9–3.5 × 10¹⁴ |
| [O2] = 6.6 × 10¹⁶ |
| 339.7 |
3–16 |
0.18 ± 0.05 |
3.6733 |
[CH2CO] = 0.3–3.4 × 10¹⁴ |
| [O2] = 1.3 × 10¹⁷ |
4. Discussion
4.1 Pressure dependence of the HCO quantum yield
The most notable feature of the HCO yield data is the absence of a pressure dependence over the wavelength range 310–355 nm. This observation differs significantly from the observations of Feierabend et al.,27 who found that quenching persisted down to 290 nm. In the companion paper,1 we showed that the pressure dependent quantum yield for HCO formation is given by eqn (E1). This equation differs from that used by Feierabend et al., who reported values of kq/kda (in our notation). This ratio is less directly related to the lifetime of S1* than is ours and we have rescaled their values by a factor of Φ0,HCO in order to compare the two sets of values of kq/kd.
Fig. 2 shows a Stern–Volmer plot at 335 nm from our present measurements and from those Feierabend et al.27 Both sets of data have been rescaled to give an intercept of unity, so that the slope/intercept ratio is equal to kq/kd, thus allowing a clearer comparison of the slopes derived under these conditions in the two investigations. It is clear that the two datasets differ and cannot be reconciled via the uncertainty limits. One dataset or the other is subject to an unrecognised systematic error.
Fig. 3 shows a plot of the Stern–Volmer quenching parameters, kq/kd, over the wavelength range 300–420 nm from the measurements of Chen and Zhu,26 Feierabend et al.27 and our earlier paper,1 together with the measurements reported here. There is considerable scatter, but the results agree qualitatively except at the shorter wavelengths. The insert contains a plot at short wavelengths that is linear in kq/kd, to accommodate its approach to zero, according to the present measurements. There are many more determinations in the dataset of Feierabend et al. than in the present measurements, but this in itself does not help us determine which dataset is subject to systematic error. We note, however, that Tadic et al. found no pressure dependence in their chamber measurements of glyoxal quantum yields, at 100–760 Torr, when using lamps covering the wavelength range 275–380 nm, although they did find quenching over the range 390–475 nm, in agreement with our own measurements and those of Feierabend et al. and Chen and Zhu. The overall quantum yield obtained by Tadic et al. at the shorter wavelengths was equal to 0.97 ± 0.05.
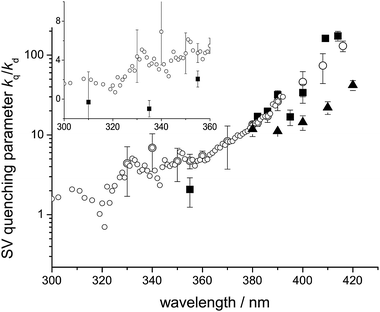 |
| | Fig. 3 Glyoxal Stern–Volmer quenching parameter kq/kd – equal to kq,S/kd,S from the curved SV – as a function of wavelength: open circles = Feierabend et al.;27 filled squares = present study and filled triangles = Chen and Zhu.26 Insert are the low wavelengths values on a linear plot. | |
The differences in pressure dependence have significant implications for atmospheric chemistry and we will return to this point at a later stage. For the present, we exclude the data of Feierabend et al. from our analysis of quantum yields, because of these significant discrepancies. The following sections are primarily aimed at parameterising the quantum yields, as a function of wavelength, pressure and temperature, to facilitate calculation of the glyoxal quantum yields for atmospheric applications.
4.2 Zero pressure product yields
At wavelengths<355 nm, according to our measurements, the yield of products from glyoxal photolysis is independent of pressure, so that the HCO and H quantum yield measurements are equal to the zero pressure quantum yields for HCO, Φ0,HCO, and H, Φ0,H. At longer wavelengths, where the yields of HCO are pressure dependent, Φ0,HCO was determined in the previous paper by extrapolating the linear/non-linear Stern–Volmer plots to zero pressure.
Φ
0,HCO
.
Fig. 4 shows a plot of Φ0,HCO determined in this and the previous paper, together with the values obtained by Chen and Zhu and Feierabend et al. There is reasonably good agreement at wavelengths below 360 nm. Above 380 nm, however, there are significant differences; our values are close to 2, while those of Feierabend et al. are lower, albeit with large uncertainties. As discussed in the previous paper, at wavelengths up to 395 nm, our extrapolations and the conclusion of a zero pressure quantum yield of 2 are quite secure and have small uncertainties. At longer wavelengths, the non-linearity of the Stern–Volmer plots, and the difficulty of making measurements at sufficiently low pressures to obtain an accurate intercept, make extrapolation to zero pressure more difficult and we have resorted to constraining the zero-pressure yield to 2.0 at wavelengths above 400 nm. Our conclusion of a constant HCO zero-pressure quantum yield in this region is, therefore, open to question. In this wavelength range, our zero pressure quantum yields are substantially higher than those of Chen and Zhu and Feierabend et al., because they did not carry out experiments at sufficiently low pressures to observe the non-linearity of the Stern–Volmer plots.
 |
| | Fig. 4 Zero-pressure HCO yields, Φ0,HCO, from glyoxal photolysis versus wavelength determined from this study, filled squares, Chen and Zhu,26 open triangles, and Feierabend et al.,27 open circles. Open squares are our assumed values for λ ≥ 400 nm. Bold line through the data is eqn (E4) using the Φ0,HCO(λ) parameters from Table 3a. | |
The zero pressure HCO yield was fitted, as a function of wavelength, based on a Boltzmann function, previously used in our analysis of acetone photolysis:36
| | | Φ0,HCO(λ), Φ0,H(λ) = B2 + (B1 − B2)/(1 + exp((λ − x0)/dx)) | (E4) |
Φ0,HCO as obtained from the fit to our data in
Table 1 and
ref. 1 together with the data of Chen and Zhu
et al.37 obtained at the excimer wavelengths, 193, 248, 308 and 351 nm. The data at wavelengths greater than 395 nm were constrained to ensure that the fit gives a limit of ∼2 at long wavelengths. The data of Feierabend
et al. were not included in the fit, because of the low values reported, with large uncertainties, at wavelengths above 380 nm, and, as discussed above, their observation of a weak but significant pressure dependence at short wavelengths.
Fig. 4 shows the fit and demonstrates that, despite the selectivity of datasets for the fitting process, there is good agreement with all of the experimental data at the shorter wavelengths, although there is substantial scatter. The values of Chen and Zhu
37 were used below 300 nm. The same function is used below to parameterise the H yield.
Table 5 gives a parameterisation for the
Φ0,HCO as a function of wavelength, using
eqn (E4).
37
Φ
0,H
.
The 0 K threshold wavelength for channel (P1b) is 341.5 nm.38–40 H atom formation was observed at a series of discrete wavelengths; the longest wavelength investigated was ∼340 nm, demonstrating that channel (P1b) is significant (Φ1b = 0.18) close to threshold. Φ1b increases as the wavelength falls (Table 2). No pressure dependence was observed in the HCO yield at these short wavelengths, so that the values reported in Table 2 correspond to the zero pressure yields. This is the first direct observation of H atoms from glyoxal photolysis, but it has been indirectly observed at 193 nm by Colberg and Friedrichs.20 Langford and Moore, in their investigation of glyoxal photolysis at 308 nm, concluded that channel (P1b) is unlikely because it was close to threshold, based on a value for ΔfH0(glyoxal) of −243 kJ mol−1, which gives a threshold wavelength of 317 nm.
Chen and Zhu reported a quantum yield for HCO of 0.42 ± 0.21 at 193 nm, while our H yield is 0.95 ± 0.12 (Table 2). These yields are incompatible with the operation of the radical channels (P1a) and (P1b) alone, since the yield of HCO is less than the yield of H. It is clear that, at this wavelength, the channel:
| | | (HCO)2 + hν → 2H + 2CO | (P1g) |
is operative, presumably because of dissociation of the HCO formed in
channel (P1b). The threshold wavelength for
channel (P1g) at 0 K is 291 nm.
Table 3a gives a parameterisation for
Φ0,H as a function of wavelength, using
eqn (E4), together with the experimental measurements given in
Table 4. The fit was constrained to ensure that it rapidly converged to zero at wavelengths longer than the energetic limit for
(P1b) (
Fig. 5).
Table 3 (a) Parameters to fit the zero pressure yields for Φ0,HCO(λ) and Φ0,H(λ) using eqn (E3), where wavelength is in nm. (b) Parameters obtained from simultaneously fitting the zero pressure yields of Φ0,HCO(λ) (Leeds and Chen and Zhu)26 and Φ0,H(λ) (Leeds) and Φ0,H2CO(254 nm),25 where eqn (E4) is used to describe channels (P1a), (P1b) and (P1g), wavelength is in nm. Φ0,P1c is obtained from 1 − (ΦP1a(λ) + ΦP1b(λ) + Φ(P1g)(λ))
| Parameter |
Φ
0,HCO(λ) |
Φ
0,H(λ) |
|
|
B1 |
0.465 |
0.924 |
|
|
B2 |
2.013 |
−0.0209 |
|
|
x0 |
333.4 |
296.0 |
|
| dx |
15.55 |
26.21 |
|
| Parameter |
2ΦP1a(λ) |
Φ
P1b(λ) |
2ΦP1g(λ) |
|
B1 |
0.0 |
0.0 |
0.56 |
|
B2 |
2.0 |
0.39 |
0.0 |
|
x0 |
330.0 |
331.7 |
276.7 |
| dx |
14.1 |
−14.0 |
12.0 |
 |
| | Fig. 5 Zero-pressure H atom yield, Φ0,H, from glyoxal photolysis versus wavelength determined from this study. The line is the fit to the data using the Boltzmann function, given by (E4). Values at the wavelengths above 350 nm were set to zero in the fitting programme, to ensure the correct asymptotic behaviour. They correspond to wavelengths well above the threshold for H atom production (342 nm). | |
Zero pressure quantum yields for individual channels.
Table 3b gives a parameterisation for the zero pressure quantum yields for all of the radical channels (P1a), (P1b) and (P1g). Eqn (E4) was again used, together with the zero pressure yields of HCO and H calculated using the parameters in Table 3a. Above 300 nm, Φ1a = (Φ0,HCO − Φ0,H)/2 and Φ1b = Φ0,H. Table 4 shows the yields obtained from the experimental measurements of Φ0,H and the parameterised values of Φ0,HCO from Table 3a. The system is under-defined below ∼300 nm, because parameterisations are required for three radical channel quantum yields from only two observables. An approximate solution was obtained by ensuring that Φ1g was close to zero above the threshold wavelength of 291 nm and that Φ1b + 2Φ1g = 0.95 at 193 nm. There is some arbitrariness in the partitioning of the H atom yield between (P1b) and (P1g) below ∼300 nm, and this has consequences for the partitioning of the HCO yield between (P1a) and (P1b), but the parameters in Table 3b reproduce accurately the overall HCO and H yields described by the parameters in Table 5, which are directly linked to the experimental yields.
|
λ/nm |
Φ
1a (This study) (=Φ0,HCO − Φ(0,H))/2 |
Φ
1b (This study) (Φ(0,H)) |
Φ
1c (This study)a (=1 − Φ1a − Φ1b) |
Φ
1c (Tadic et al.) |
|
Assuming that channel (P1d) is inoperative.
|
| 340 |
0.61 |
0.18 |
0.21 |
0.11 |
| 317 |
0.30 |
0.26 |
0.44 |
0.37 |
| 308 |
0.18 |
0.36 |
0.48 |
0.42 |
Table 5 Global fit parameters to describe the quantum yield for glyoxal photolysis over temperature and pressure using eqn (E6), where x is equal to 1,2 or 3 in eqn (E7)–(E9), respectively. Errors are 1σ. The global parameters were fitted to 455 data points and yielded a χ2/point of 1.78
|
|
a
x,1
|
a
x,2
|
a
x,3
|
a
x,4
|
|
A1 |
(6.48 ± 0.48) × 10−19 |
−1.83 ± 0.48 |
0.00076 ± 0.00005 |
−0.515 ± 0.360 |
|
A2 |
112.8 ± 3.1 |
−1.53 ± 0.31 |
0.00461 ± 0.00006 |
0.507 ± 0.117 |
|
A3 |
(2.25 ± 0.31) × 10−16 |
−9.18 ± 0.78 |
0.00078 ± 0.00032 |
−7.03 ± 1.58 |
Φ
HCHO = Φ1c.
Tadic et al.25 used FTIR spectroscopy to detect CO, HCHO and HC(O)OH from glyoxal photolysis, in air over a range of pressures. They used two broad band light sources and a mercury lamp (254 nm). Following earlier conclusions, including those of Langford and Moore, they excluded channel (P1b), but included the so-called “triple whammy”:
Under the conditions used by Tadic et al., with [O2] in the range 6 × 10¹⁷ − 4.5 × 10¹⁸ mol cm−3, channels (P1a), (P1b) and (P1g) all generate 2HO2 + 2CO. HC(O)OH was formed from reactions initiated by HCHO+HO2 and they equated the sum of [HCHO] and [HC(O)OH] to the yield of channel (P1c) and ([CO]–[HCHO] and [HC(O)OH])/2 to the sum of the yields of channels (P1a) and (P1d).
Table 4 shows Φ1c calculated assuming that channel (P1d) is inoperative at these wavelengths and that the overall photolysis yield is unity,25i.e. based on Φ1c=1 − (Φ1a + Φ1b). The agreement with the measurements of Tadic et al. is quite good, although the present values are all greater than those given by Tadic et al., suggesting that the assumption that Φ1d = 0 at these wavelengths may not be justified and that small yields (≤0.1) may occur.
The calculation of the molecular yields can be extended to wavelengths below 300 nm, using the parameterisations given in Table 3a, which are more closely linked to observation and are based on fewer assumptions than those in Table 3b. Assuming that channel (P1d) is inoperative, Φ1c = 1 − (Φ1a + Φ1b + Φ1g), while Φ0,HCO = 2Φ1a + Φ1b and Φ0,H = Φ1b + 2Φ1g, so that Φ1c = 1 − [Φ0,HCO(λ) + Φ0,H(λ)]/2 at all wavelengths. Φ1c calculated in this way is plotted in Fig. 6, which also shows the individual determinations from Table 4. Good agreement with the values reported by Tadic et al. is observed, especially given the assumptions made in our determination of Φ1c. The agreement is actually better than that shown over the range 350–400 nm, because the data of Tadic et al. for Φ1c(λ) are for 1 atmosphere and corrections for zero pressure will increase the yield to be more in line with our zero pressure values. At wavelengths <270 nm, the Hg lamp used by Tadic et al. has essentially just a single wavelength output at 254 nm. Therefore their value of 0.34 ± 0.05 can be assigned to 254 nm. As discussed above, how ΦH2CO(λ) is assigned at other wavelengths <270 nm is somewhat arbitrary. Therefore the apparent divergence in the two datasets at the shortest wavelengths should not be used to indicate significant disagreement, and at 254 nm our value of ΦH2CO,0 is within error of that of Tadic et al., see inset in Fig. 6. Overall, it is concluded that the agreement between the two datasets is remarkably good and therefore it is reasonable to assign our molecular channel to exclusively H2CO + CO, (P1c), the channel most amenable to characterisation in the study by Tadic et al. because H2CO was monitored. From Fig. 6, an upper limit to the “triple whammy” channel (P1d) is estimated to be <0.1 at wavelengths where the molecular channels are significant.
 |
| | Fig. 6 The parameterised fits of the zero pressure product channels in glyoxal photolysis as a function of wavelength: Φ0,HCO/2 (green), Φ0,H/2 (black), Φ0,H2CO (red). Also included are Φ1c from Table 4, open circles. Inset shows our parameterised Φ0,H2CO (red) versus the values (blue) derived by Tadic et al.25 together with their measured value at 254 nm. | |
4.3 Products under atmospheric conditions
Both H, produced in channels (P1b) and (P1g), and HCO, produced in channels (P1a) and (P1b), react rapidly with O2 under atmospheric conditions, so that the photolysis may be represented by two channels, forming 2HO2 + 2CO (channels (P1a), (P1b) and (P1g)) and HCHO + CO (channels (P1c)). At longer wavelengths photolysis occurs exclusively via the former channel. The atmospheric photolysis rates for glyoxal depend on pressure and temperature. Parameterised forms of the rates are provided in Section 5 below.
5. Parameterised form for glyoxal photolysis quantum yield, Φ total (λ, p,T), over the HCO, H and H2CO channels, and atmospheric implications
In Section 4 we showed that glyoxal photo-dissociation over the wavelength region between 193–414 nm can be described by only three radical channels (P1a), (P1b) and (P1g) leading to formation of HCO and H, and one molecular channel (P1c). From the pressure dependence, it was concluded that the mechanism previously proposed for acetone36 provides a good description of the photo-dissociation mechanism for glyoxal. Therefore we can use the same functions to parameterise the glyoxal data as previously used for acetone,41 together with our channel yield data to partition it accordingly:| | | Φtotal (λ, [M], T) = [ΦP1a(λ) + ΦP1b(λ) + ΦP1c(λ) + ΦP1g(λ)] × Φ (λ,[M],T) | (E5) |
where it is noted that significant pressure dependence is only observed above 350 nm, when ΦP1a > 0.8. In Section 4.2 we showed that a Boltzmann function, eqn (E4), is an adequate description of the radical channel yields and that ΦP1c = (1 − ( ΦP1a + ΦP1b + ΦP1g)). The parameters needed to describe the product channels are given in Table 3b, where the wavelength is in nm.
At any given wavelength and temperature, the quantum yield for glyoxal photolysis may be given by an extended version of eqn (E8) in the previous paper:
| |  | (E6) |
A1–3 are quenching or photophysical parameters, defined in the previous paper and determined from linear and non-linear Stern–Volmer fits. As this equation is based on the model for acetone photo-dissociation
41 we use the same expressions as for
acetone in order to describe
A1,
A2 and
A3 as a function of temperature and wavelength:
| |  | (E7) |
| |  | (E8) |
| |  | (E9) |
where
λ is in nm and 23
800 is the reciprocal wavelength in cm
−1 and is chosen such that it corresponds to an energy below the glyoxal dissociation limit.
Eqn (E6)–(E9) were used to simultaneously fit all the HCO data using standard non-linear least-squares methods, where the data were weighted in order to recognise that there was considerable error in some of the datasets; a minimum of 5% error was assigned to all data and this was propagated with the returned error in [HCO]
0 from
eqn (E1); fitting yielded a
χ2/point of 1.78. The global fit parameters are given in
Table 5.
In Fig. 7, the values for Φtotal (λ, [M], T) at 1 atmosphere and 295 K determined in this work are compared to the studies of Feierabend et al.27 and Tadic et al.25 In general, at wavelengths >350 nm our Φtotal are greater than those of Feierabend et al.27 and Tadic et al.,25 but <350 nm the situation is reversed.
 |
| | Fig. 7 Plot of Φtotal at 1 atmosphere and 295 K determined in this work (green), together with the values recommended in the studies of Feierabend et al.27 (red) and Tadic et al.,25 (black). The open red circles are the values from Feierabend et al.27 based on their measured SV parameters. | |
A critical issue in this region is the degree of pressure quenching of the HCO yield. Fig. 3 shows the Stern–Volmer quenching parameter, kq/kd, determined in this work and by Feierabend et al. The latter dataset is much more extensive and shows that quenching occurs over the whole wavelength range studied, albeit with decreasing values of kq/kd as the wavelength is reduced. Our more limited set of measurements show that kq/kd falls to zero for wavelengths less than 355 nm. The uncertainties in both sets of measurements are quite large, but, as discussed above, the differences between them are significant. Feierabend et al. used the total quantum yield recommended by Tadic et al., which is close to unity, their own yields for HCO (channel (P1a) at 1 atmosphere, and the Tadic values for channel (P1c) to deduce the yields for channel (P1d) by difference. There is an inconsistency in this approach. At 330 nm, for example, while their yield of channel (P1a) was reduced by a factor of two by quenching, from 0.84 (zero pressure) to 0.4 (1 atm), they still reported an overall photolysis quantum yield of unity, based on the measurements of Tadic et al. This implies a model in which collisional quenching of the state leading to channel (P1a) does not reduce the total quantum yield, but leads instead to dissociation viachannel (P1a) and (P1d). At zero pressure and 330 nm, the maximum combined yields of channel (P1c) and (P1d) would be 0.2, but this has risen to 0.64 at atmospheric pressure. It is difficult to conceive of a photolysis mechanism where, at short wavelengths, increasing pressure leads to the replacement of a radical by a molecular channel, while at long wavelengths it simply leads to a reduction in the yield of the radical channel, since the molecular channels are not observed above ∼380 nm. Our linear Stern–Volmer analysis (eqn (E1) and discussion in companion paper) is based on a competition between collisional stabilisation in the S1 state and dissociation from that state, via radiationless transitions to dissociative states. The interpretation of Feierabend et al. requires a mechanism in which collisional stabilisation occurs only in a state which dissociates viachannel (P1a), while no quenching occurs in states leading to the molecular channel(s). They did not discuss this issue, nor did they attempt to explain the processes involved. We observed no collisional quenching at wavelengths below 355 nm (see Fig. 2), in the region where channels other than (P1a) contribute to dissociation, so this dilemma does not arise in the interpretation of our results, at these wavelengths.
Fig. 7 shows the results of applying the values of kq[M]/kd from the measurements of Feierabend et al. to the total photolysis yield for glyoxal and demonstrates that, if collisional quenching applies to all photolysis channels, and these quenching data are correct, the total photolysis yields lie well below the literature values at all wavelengths below 350 nm. The recommendation of the NASA panel42 is based on Feierabend et al. and therefore can only be correct if the quenching data are correct and if a mechanism applies in which quenching only occurs in the state that acts as a precursor to channel (P1a). As discussed above, such a mechanism has not been proposed. Note also that our measurements show that H atom production (channels (P1b) and (P1g)) is important below ∼340 nm, implying that channel (P1d) is relatively unimportant, with a yield <0.1. The short wavelength region provides the greatest contribution to the photolysis of glyoxal in the atmosphere, because of the effects of collisonal quenching at longer wavelengths. Volkamer et al. noted that ∼80% of glyoxal photolysis takes place at wavelengths <370 nm.16 This value is consistent with the quantum yields values reported by Tadic et al.25 However, the direct quantum yield measurements from the present study and that by Feierabend et al.27 imply that the longer wavelengths – see Fig. 7 – make a more significant contribution, where photolysis rate calculations indicate that ∼50% of glyoxal photolysis occurs at wavelengths > 370 nm.
The rate of photolysis of glyoxal in the atmosphere is given by:
| | 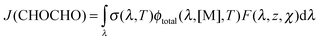 | (E10) |
where
F is the actinic
photon flux that depends upon wavelength,
λ, altitude,
z and solar zenith angle,
χ, and
σ(
λ,
T) is the absorption cross-section of
glyoxal. To quantify the effect of
Φtotal (
λ, [M],
T) on
glyoxal photolysis,
J(CHOCHO) has been calculated using the NCAR/ACD Tropospheric Ultraviolet and Visible (TUV) radiation model
43 for our values and from those in the literature. TUV version 4.3 was run at 45° latitude (Western Europe), an altitude of 0.5 km and under clear sky conditions (albedo 0.1), using the absorption cross-sections of Volkamer
et al.,
16 and the results are shown in
Fig. 8. This figure shows that the fastest glyoxal photolysis rates occur with the data from Chen and Zhu,
26 which is a consequence of their anomalously high
Φtotal at wavelengths >400 nm, arising from their failure to recognise contributions to HCO formation from self reactions of triplet
glyoxal, at wavelengths above 400 nm, as discussed in the companion paper and by Feierabend
et al. Our quantum yield data lead to the next highest photolysis rate followed by calculations based on the data of Feierabend
et al.27 and Tadic
et al.25 Our
glyoxal photolysis rates are ∼30% faster than those of Tadic
et al., and imply an atmospheric lifetime of ∼2 hours, but it is noted that our experiments were conducted in N
2 while those of Tadic
et al. were made in air. The calculated glyoxal photolysis rate for Feierabend
et al.27 used their recommended quantum yields, but this value is 20% lower when the quantum yields based on their Stern–Volmer data – see above – are used in the calculation. This lower photolysis rate is a consequence of their Stern–Volmer data still being pressure dependent at wavelengths <330 nm, see
Fig. 7.
 |
| | Fig. 8 Plots of the surface rate of glyoxal photolysis in the atmosphere versus solar zenith angle at 298 K. TUV was used to calculate the photolysis rates using values for Φtotal taken from: this work, green triangles; Feierabend et al.,27 red circles; Tadic et al.,25 black squares, and Chen and Zhu,26 blue triangles. | |
From our direct detection of H atoms we have shown that the molecular channel, H2 + 2CO, assigned by Tadic et al. is most likely a radical channel, H + CO + HCO, see Section 4.2. However, this channel only operates at shorter wavelengths, see Fig. 6, and it only makes a minor contribution, ∼5%, to overall photolysis in the atmosphere. The variation in the photolysis channels in the atmosphere between the studies is shown in Fig. 9, where it can be seen that the present study predicts a considerably larger amount of HCO ((P1a) + (P1b) = 0.83) than the studies of Tadic et al. ((P1a) = 0.64) and Feierabend et al. ((P1a) = 0.61). In the present study, the zero pressure HCO yield is 2 for 380 nm ≤ λ ≤ 395 nm, in agreement with Chen and Zhu,26 see Fig. 4. However, at wavelengths ≥395 nm curved Stern–Volmer plots were observed, see the companion paper; this makes assignment of the zero pressure yield difficult, and we resorted to constraining the zero pressure yield to 2.0 at wavelengths above 400 nm. The effect of curvature in the Stern–Volmer plots is to increase the zero pressure HCO yields compared to the values obtained in the studies by Chen and Zhu26 and Feierabend et al.,27 where only the high-pressure regime was explored.
 |
| | Fig. 9 Product channels from glyoxal photolysis in the atmosphere at 760 Torr pressure, where the product channels are normalised to 1. The calculations for Tadic et al.25 and Feierabend et al.27 were carried out using their reported product and quantum yields. Tadic(Leeds) and Feierabend(Leeds) used their total quantum yields and the product channels from this study. | |
To test if our high values for HCO yields at atmospheric pressure are a result of variation in total photolysis yields or product channels with wavelength we also carried out calculations where the quantum yields of Tadic et al. and Feierabend et al. were combined with the product channels from this study, Tadic(Leeds) and Feierabend(Leeds) in Fig. 9. From Fig. 9 it can be seen that the HCO viachannel (P1a) for Tadic only increased marginally (0.68), so that the main difference between this and the present study is the variation of the total quantum yield, see Fig. 7. The increase in HCO viachannel (P1a) when applying our product yields to the Feierabend et al. recommended quantum yield data, Feierabend(Leeds), is more marked, (P1a) = 0.73. This implies that there is a significant difference between our product yields and those recommended by Feierabend et al. However, Feierabend et al. assigned the HCO channel by incorporating their measured HCO yields with the product yields put forth by Tadic et al, but if their measured HCO yields are combined with the quantum yields based on their Stern–Volmer data this increases the HCO channel by 20%, which brings about better agreement with the HCO yield from the present study.
This present study is the first to examine glyoxal photolysis as a function of temperature, and, as observed for acetone,36 photolysis at the longest wavelengths much reduced at atmospheric pressure as the temperature lowered. However, the returned temperature dependent parameters for glyoxal are considerably smaller in magnitude than for acetone,41 at least in part because of the importance of the shorter wavelength region in glyoxal, where temperature effects are minimal. At 295 K, photolysis rate calculations using our results indicate that only ∼20% of the photolysis occurs above 395 nm, the wavelength where the quantum yields start to show a significant temperature dependence. This observation was substantiated in simulations with TUV at higher altitudes, between 0–20 km. Glyoxal photolysis rates were observed to increase by a factor of ∼2.5 over the range 0.5 to 20 km, which is a consequence of the increased solar flux more than offsetting the reduced Φtotal under the low temperature environment of high altitude. To factor out the temperature component of Φtotal, TUV simulations were carried out using Φtotal (λ, [M], 295 K) as altitude was varied, and it was observed that the calculated photolysis rates were no more than 10% larger at 20 km. Therefore the observed large temperature dependence in Φtotal (λ, [M], T) at wavelengths >400 nm has only a small effect on glyoxal photolysis in the atmosphere but it is recognised that there is considerable uncertainty in our measurements in this region.
6. Conclusions
Photolysis of glyoxal has been studied below 350 nm by monitoring the yields of HCO and H at a number of wavelengths. The photolysis was found to be essentially independent of total pressure. These data are inconsistent with the short wavelength data of Feierabend et al. such that one or both studies have significant systematic errors. Further studies in this region would be of benefit.
The data have been combined with our own data at longer wavelengths, where collisional quenching is significant, and data from the literature to obtain zero pressure quantum yields for 3 radical channels and one molecular channel that dominate photolysis over the range studied. Using these values, and collisional quenching data, parameterised quantum yields have been obtained for all the dissociation channels as a function wavelength, pressure and temperature. These yields have been compared to literature values and used to predict glyoxal lifetimes in the atmosphere.
Acknowledgements
This work was supported by an EPSRC grant GR/T28560/01 and the EU SCOUT programme. We thank Dr Branko Ruscic for helpful discussions on the thermochemistry of glyoxal photolysis.
References
- R. J. Salter, M. A. Blitz, D. E. Heard, M. J. Pilling and P. W. Seakins, Phys. Chem. Chem. Phys., 2013 Search PubMed , under review.
- T.-M. Fu, D. J. Jacob, F. Wittrock, J. P. Burrows, M. Vrekoussis and D. K. Henze, J. Geophys. Res., [Atmos.], 2008, 113, D15303 CrossRef.
- S. Hatakeyama, N. Washida and H. Akimoto, J. Phys. Chem., 1986, 90, 173–178 CrossRef CAS.
- I. Barnes, V. Bastian, K. H. Becker, R. Overath and Z. Tong, Int. J. Chem. Kinet., 1989, 21, 499–517 CrossRef CAS.
- D. R. Glowacki, J. Lockhart, M. A. Blitz, S. J. Klippenstein, M. J. Pilling, S. H. Robertson and P. W. Seakins, Science, 2012, 337, 1066–1069 CrossRef CAS.
- G. Yarwood, N. Peng and H. Niki, J. Phys. Chem., 1991, 95, 7330–7337 CrossRef CAS.
- I. Maneron, A. Mellouki, G. Le Bras, G. K. Moortgat, A. Horowitz and K. J. Wirtz, J. Phys. Chem. A, 2005, 109, 4552–4561 CrossRef.
- R. Atkinson, Atmos. Environ., 2000, 34, 2063–2101 CrossRef CAS.
- H. Bandow and N. Washida, Bull. Chem. Soc. Jpn., 1985, 58, 2549–2555 CrossRef CAS.
- E. C. Tuazon, H. MacLeod, R. Atkinson and W. P. L. Carter, Environ. Sci. Technol., 1986, 20, 383–387 CrossRef CAS.
- A. Guenther, C. N. Hewitt, D. Erickson, R. Fall, C. Geron, T. Graedel, P. Harley, L. Klinger and M. Lerdau,
et al
, J. Geophys. Res., [Atmos.], 1995, 100, 8873–8892 CrossRef CAS.
- A. J. Kean, E. Grosjean, D. Grosjean and R. A. Harley, Environ. Sci. Technol., 2001, 35, 4198–4204 CrossRef CAS.
- E. Grosjean, P. G. Green and D. Grosjean, Anal. Chem., 1999, 71, 1851–1861 CrossRef CAS.
- F. Wittrock, A. Richter, H. Oetjen, J. P. Burrows, M. Kanakidou, S. Myriokefalitakis, R. Volkamer, S. Beirle, U. Platt and T. Wagner, Geophys. Res. Lett., 2006, 33, L16804 CrossRef.
- R. Volkamer, L. T. Molina, M. J. Molina, T. Shirley and W. H. Brune, Geophys. Res. Lett., 2005, 32, L08806 CrossRef.
- R. Volkamer, P. Spietz, J. Burrows and U. Platt, J. Photochem. Photobiol., A, 2005, 172, 35–46 CrossRef CAS.
- K. J. Feierabend, L. Zhu, R. K. Talukdar and J. B. Burkholder, J. Phys. Chem. A, 2008, 112, 73–82 CrossRef CAS.
- C. N. Plum, E. Sanhueza, R. Atkinson, W. P. L. Carter and J. N. Pitts Jr., Environ. Sci. Technol., 1983, 17, 479–484 CrossRef CAS.
- G. K. Moortgat, Pure Appl. Chem., 2001, 73, 487–490 CrossRef CAS.
- M. Colberg and G. Friedrichs, J. Phys. Chem. A, 2006, 110, 160–170 CrossRef CAS.
- F. L. Nesbitt, J. F. Gleason and L. J. Steif, J. Phys. Chem. A, 1999, 103, 3038–3043 CrossRef CAS.
- M. Jang and R. M. Kamens, Environ. Sci. Technol., 2001, 35, 4758–4766 CrossRef CAS.
- J. Liggio, S.-M. Li and R. McLaren, Environ. Sci. Technol., 2005, 39, 1532–1541 CrossRef CAS.
- W. P. Hastings, C. A. Koehler, E. L. Bailey and D. O. De Hann, Environ. Sci. Technol., 2005, 39, 8728–8735 CrossRef CAS.
- J. Tadic, G. K. Moortgat and K. Wirtz, J. Photochem. Photobiol., A, 2006, 177, 116–124 CrossRef CAS.
- Y. Chen and L. Zhu, J. Phys. Chem. A, 2003, 107, 4643–4651 CrossRef CAS.
- K. J. Feierabend, J. E. Flad, S. S. Brown and J. B. Burkholder, J. Phys. Chem. A, 2009, 113, 7784–7794 CrossRef CAS.
- K. L. Gannon, D. R. Glowacki, M. A. Blitz, K. J. Hughes, M. J. Pilling and P. W. Seakins, J. Phys. Chem. A, 2007, 111, 6679–6692 CrossRef CAS.
- T. Kovacs, M. A. Blitz, P. W. Seakins and M. J. Pilling, J. Chem. Phys., 2009, 131, 204304 CrossRef.
- K. L. Gannon, M. A. Blitz, M. J. Pilling, P. W. Seakins, S. J. Klippenstein and L. B. Harding, J. Phys. Chem. A, 2008, 112, 9575–9583 CrossRef CAS.
- Y. Matsumi, Y. Inagaki and M. Kawasaki, J. Phys. Chem., 1994, 98, 3777–3781 CrossRef CAS.
- G. Selwyn, J. Podolske and H. S. Johnston, Geophys. Res. Lett., 1977, 4, 427–430 CrossRef CAS.
- A. H. Laufer and R. A. Keller, J. Am. Chem. Soc., 1971, 93, 61–63 CrossRef CAS.
- M. A. Blitz, K. W. McKee, M. J. Pilling and P. W. Seakins, Chem. Phys. Lett., 2003, 372, 295–299 CrossRef CAS.
- M. A. Blitz, C. Kappler, M. J. Pilling and P. W. Seakins, Z. Phys. Chem., 2011, 225, 957–967 CrossRef CAS.
- M. A. Blitz, D. E. Heard and M. J. Pilling, J. Phys. Chem. A, 2006, 110, 6742–6756 CrossRef CAS.
- L. Zhu, D. Kellis and C.-F. Ding, Chem. Phys. Lett., 1996, 257, 487–491 CrossRef CAS.
- O. Dorofeeva, V. P. Novikov and D. B. Neumann, J. Phys. Chem. Ref. Data, 2001, 30, 475–513 CrossRef CAS.
- R. A. Fletcher and G. Pilcher, Trans. Faraday Soc., 1970, 66, 794–799 RSC.
-
B. Ruscic, personal communication, 2009.
- M. A. Blitz, D. E. Heard, M. J. Pilling, S. R. Arnold and M. P. Chipperfield, Geophys. Res. Lett., 2004, 31, L06111 CrossRef.
-
S. P. Sander, J. Abbatt, J. R. Barker, J. B. Burkholder, R. R. Friedl, D. M. Golden, R. E. Huie, C. E. Kolb, M. J. Kurylo, G. K. Moortgat, V. L. Orkin and P. H. Wine, Chemical Kinetics and Photochemical Data for Use in Atmospheric Studies, Evaluation No. 17, JPL Publication 10-6, Jet Propulsion Laboratory, Pasadena, 2011 Search PubMed.
-
S. Madronich and S. Flocke, The role of solar radiation in atmospheric chemistry, in Handbook of Environmental Chemistry, ed. P. Boule, Springer-Verlag, Heidelberg, 1999 Search PubMed.
Footnote |
| † Eqn (P1f) can be found in ref. 1. |
|
| This journal is © the Owner Societies 2013 |
Click here to see how this site uses Cookies. View our privacy policy here.  Open Access Article
 This Open Access Article is licensed under a