 Open Access Article
Creative Commons Attribution 3.0 Unported Licence
Preparation of water-dispersible TiO2 nanoparticles from titanium tetrachloride using urea hydrogen peroxide as an oxygen donor†
Naoko
Watanabe
a,
Taichi
Kaneko
a,
Yuko
Uchimaru
b,
Sayaka
Yanagida
c,
Atsuo
Yasumori
c and
Yoshiyuki
Sugahara
*ad
aDepartment of Applied Chemistry, School of Advanced Science and Engineering, Waseda University, Ohkubo-3, Shinjuku-ku, Tokyo 169-8555, Japan. E-mail: ys6546@waseda.jp
bNational Institute of Advanced Industrial Science and Technology (AIST), Central 5, Higashi, Tsukuba, Ibaraki 305-8565, Japan
cDepartment of Materials Science and Technology, Faculty of Industrial Science and Technology, Tokyo University of Science, Yamazaki-2641, Noda, Chiba 278-8510, Japan
dKagami Memorial Laboratory for Materials Science and Technology, Waseda University, Nishiwaseda-2, Shinjuku-ku, Tokyo, 169-0051, Japan
First published on 6th November 2013
Abstract
TiO2 nanoparticles were prepared from titanium tetrachloride (TiCl4) in CH2Cl2 at 80 °C for 30 h, 42 h and 70 h using urea hydrogen peroxide (UHP) as an oxygen donor with a TiCl4![[thin space (1/6-em)]](https://www.rsc.org/images/entities/char_2009.gif) :
:![[thin space (1/6-em)]](https://www.rsc.org/images/entities/char_2009.gif) UHP molar ratio of 1
UHP molar ratio of 1![[thin space (1/6-em)]](https://www.rsc.org/images/entities/char_2009.gif) :
:![[thin space (1/6-em)]](https://www.rsc.org/images/entities/char_2009.gif) 2. The XRD patterns and Raman spectroscopy results showed that the products consisted of anatase TiO2. IR and solid-state 13C NMR with cross polarization and magic angle spinning techniques revealed the presence of urea. TEM observation revealed that the products prepared by the reactions for 30 and 42 h consisted of water-dispersible spheroid nanoparticles with a long axis of ~5 nm, while an aggregation of nanoparticles was evident upon reaction for 70 h. Thermogravimetry, inductively-coupled plasma emission spectrometry and CHN analysis showed that the amount of urea increases in the following order: TiO2_42h, TiO2_70h, TiO2_30h. The photocatalytic activity of the products dispersible in water (TiO2_30h and TiO2_42h) was estimated based on the degradation behaviour of methylene blue, and TiO2_42h showed higher photocatalytic activity than TiO2_30h. It is proposed that TiCl4 was directly oxidized by UHP to form anatase TiO2 in the early stage of the process.
2. The XRD patterns and Raman spectroscopy results showed that the products consisted of anatase TiO2. IR and solid-state 13C NMR with cross polarization and magic angle spinning techniques revealed the presence of urea. TEM observation revealed that the products prepared by the reactions for 30 and 42 h consisted of water-dispersible spheroid nanoparticles with a long axis of ~5 nm, while an aggregation of nanoparticles was evident upon reaction for 70 h. Thermogravimetry, inductively-coupled plasma emission spectrometry and CHN analysis showed that the amount of urea increases in the following order: TiO2_42h, TiO2_70h, TiO2_30h. The photocatalytic activity of the products dispersible in water (TiO2_30h and TiO2_42h) was estimated based on the degradation behaviour of methylene blue, and TiO2_42h showed higher photocatalytic activity than TiO2_30h. It is proposed that TiCl4 was directly oxidized by UHP to form anatase TiO2 in the early stage of the process.
Introduction
Nanochemistry has been developed for the preparation of nanostructures, which are of particular interest because of their interesting chemical, physical and biological behaviour.1 Among nanostructures, nanoparticles (NPs) are attracting considerable attention since they can exhibit properties superior to those of large particles based on their large surface areas and quantum effect.2 So far, a variety of applications have been developed using many kinds of NPs.3 Titania (TiO2) is an attractive functional oxide since it exhibits interesting photochemical and optical properties, including photocatalytic activity and high refractive indices.4,5 The preparation of TiO2 NPs has consequently been achieved with many different techniques, such as hydrolytic sol–gel, hydrothermal/solvothermal synthesis, and electrochemical deposition.6–8Among the various preparation techniques for TiO2 NPs, a non-hydrolytic sol–gel process has been employed for the preparation of TiO2 NPs.9–12 Titanium tetrahalides, typically titanium tetrachloride (TiCl4), have been utilized in this process. TiCl4 was reacted with an oxygen donor, such as diisporopylether, or a titanium alkoxide, typically titanium tetraisopropoxide.13,14 Since these reactions were conducted in organic solvents without the presence of H2O (which can also act as an oxygen donor), one of the advantages of this non-hydrolytic sol–gel process is the ability to control the amount of oxygen in the entire process, and this kind of control is extremely attractive for the size control of TiO2 NPs.9,11
Hydrogen peroxide (H2O2), another oxygen donor, has been utilized in the preparation of limited types of metal oxides, such as ZnO2, Fe2O3 and Fe3O4.15–18 H2O2 has also been utilized as a ligand in Ti complexes, and the resulting complexes can be water-soluble precursors for TiO2.19–23 H2O2 has also been utilized as an oxidizing reagent in organic synthesis.24–26 H2O2 is available only as aqueous solutions, which limits its usage in organic synthesis to a large extent. Urea-hydrogen peroxide (UHP; CO(NH2)2·H2O2) is a 1![[thin space (1/6-em)]](https://www.rsc.org/images/entities/char_2009.gif) :
:![[thin space (1/6-em)]](https://www.rsc.org/images/entities/char_2009.gif) 1 adduct between urea and hydrogen peroxide.27 It can be prepared easily from an aqueous solution of urea and H2O2, and it is also inexpensive and commercially available.28,29 Since UHP is soluble in some organic solvents, such as alcohols and chloroform,29 UHP has been utilized for oxidation reactions such as epoxidation and sulfide oxidation.29,30
1 adduct between urea and hydrogen peroxide.27 It can be prepared easily from an aqueous solution of urea and H2O2, and it is also inexpensive and commercially available.28,29 Since UHP is soluble in some organic solvents, such as alcohols and chloroform,29 UHP has been utilized for oxidation reactions such as epoxidation and sulfide oxidation.29,30
Here, we report the first application of UHP for metal oxide preparation. UHP can possibly play multiple roles, as an oxidation reagent as well as a donor of water which can cause hydrolysis, and urea which can coordinate to Lewis acid sites. In the present study, TiO2 NPs have been prepared by a reaction of TiCl4 with UHP in dichloromethane (CH2Cl2). The resulting products consist of water-dispersible TiO2 spheroid NPs with a long axis of ~5 nm. An overview of the preparation of water-dispersible anatase TiO2 NPs using UHP is illustrated in Fig. 1.
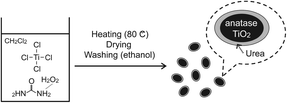 | ||
| Fig. 1 Overview of the preparation of the water-dispersible anatase TiO2 nanoparticles. | ||
Experimental
General information
X-ray diffraction (XRD) patterns were obtained with a Rigaku RINT-2500 diffractometer (Ni-filtered CuKα radiation). Raman spectra were obtained with a Renishaw in Via Reflex spectrometer using a 532 nm laser. Infrared (IR) spectra were recorded on a JASCO FT/IR-460 Plus spectrometer using the KBr method. Samples were dried under reduced pressure before preparing KBr disks. Solid-state 13C nuclear magnetic resonance (NMR) spectroscopy was performed with a JEOL ECX-400 spectrometer at 99.55 MHz. Solid-state 13C NMR spectra were obtained with cross-polarization (CP) and magic angle spinning (MAS) techniques (pulse delay, 10 s; contact time, 5 ms; spinning rate, 8 kHz). Transmission electron microscopy (TEM) images were obtained on a JEOL JEM-1011 microscope operating at 100 kV. TEM samples were prepared by evaporating a diluted aqueous dispersion of TiO2 NPs on carbon supported on a copper mesh TEM grid. Field-emission transmission electron microscopy (FE-TEM) images were obtained with a Hitachi HF-2200 microscope operating at 100 kV. The Brunauer–Emmett–Teller (BET) specific surface areas of the products were determined by the N2 adsorption–desorption method at −196 °C with a BELSORP-mini II instrument and preliminary drying at 150 °C for 1 h. Thermogravimetry (TG) was performed with a Rigaku TG8120 Thermoplus EVO thermobalance in the range of 50 to 1000 °C with a heating rate of 10 °C min−1 under a nitrogen flow. Inductively coupled plasma (ICP) emission spectrometry was performed with a Varian Vista-MPX CCD Simultaneous ICP-OES instrument after dissolving the products (1.2 mg) in 12 mL of a mixed solution (prepared from 80 mL of H2SO4 and 27 g of SO4(NH4)2) at 150 °C. Elemental analysis (CHN) was performed with a Perkin Elmer PE2400II instrument. Ion chromatography (IC) was performed with a Japan Dionex ICS-90 instrument after dissolving 5 mg of the product in 0.2 mL of H2SO4 and subsequently diluting to 100 mL. Cl2 gas was detected with Gastec Passive Dositube No. 8D. The average concentration of Cl2 after 20 h was obtained by opening the autoclaves in a glovebag filled with nitrogen. Ultraviolet-visible (UV-Vis) spectra were obtained with Jasco V-630 and Shimadzu PC-2400 spectrometers.Materials
The TiO2 NPs were prepared using UHP (97%, H2O2 35%, Aldrich) as an oxygen donor, TiCl4 (1.0 M, in dichloromethane) as the Ti source, and CH2Cl2 as a solvent. CH2Cl2 was distilled over CaH2. Ethanol was used as a washing solvent without further purification. Urea, CO(NH2)2 (99.0%), and aqueous hydrogen peroxide, H2O2 (30.0%), were used in control experiments without further purification. Methylene blue was used for the measurements of the photocatalytic activity. Sulfuric acid (H2SO4, >96%) and SO4(NH4)2 (99.5%) were used without further purification.Preparation of the TiO2 nanoparticles using UHP
All manipulations conducted before sealing the autoclave were carried out in a glovebox filled with nitrogen. The reaction was performed in a 20 mL Teflon-lined stainless autoclave. A CH2Cl2 solution of TiCl4 (6.50 mL, corresponding to 6.50 mmol TiCl4) was added to UHP (1.22 g, 13.0 mmol) in the autoclaves (TiCl4![[thin space (1/6-em)]](https://www.rsc.org/images/entities/char_2009.gif) :
:![[thin space (1/6-em)]](https://www.rsc.org/images/entities/char_2009.gif) UHP molar ratio of 1
UHP molar ratio of 1![[thin space (1/6-em)]](https://www.rsc.org/images/entities/char_2009.gif) :
:![[thin space (1/6-em)]](https://www.rsc.org/images/entities/char_2009.gif) 2). The autoclave was then sealed following the addition of CH2Cl2 (10.0 mL) to the mixture in the autoclave. The autoclave was heated in an oven at 80 °C for 20, 30, 42, and 70 h. The resultant white solids were centrifuged, washed twice with ethanol, and dried under reduced pressure at ambient temperature. The 70 h product was washed four times. The products were labelled TiO2_xh, where x is the reaction period.
2). The autoclave was then sealed following the addition of CH2Cl2 (10.0 mL) to the mixture in the autoclave. The autoclave was heated in an oven at 80 °C for 20, 30, 42, and 70 h. The resultant white solids were centrifuged, washed twice with ethanol, and dried under reduced pressure at ambient temperature. The 70 h product was washed four times. The products were labelled TiO2_xh, where x is the reaction period.
Photocatalytic activity of the TiO2 nanoparticles dispersed in water
The photocatalytic activity of the products was evaluated by degrading methylene blue in an aqueous solution. TiO2_30h or TiO2_42h was dispersed in water (0.5 mass%) to obtain a highly transparent dispersion. The aqueous TiO2 dispersion, methylene blue and deionized water were then mixed. The mixture contained 0.0100 mass% TiO2 and 0.0100 mmol L−1 methylene blue. The mixture was transferred to a cylindrical glass beaker (inside diameter: 55.3 mm and height: 59.6 mm). Before the photocatalytic activity measurements, the aqueous TiO2 dispersion was sonicated for 10 min. The aqueous TiO2 dispersion was stirred continuously in an ice bath under a BLB lamp (FL15 BLB, TOSHIBA) (0.50 mW cm−2 at 365 nm). The maximum absorbance (664.5 nm) of methylene blue was measured after 15, 30, 45, 60, 90, 120, 150, and 180 min with a UV-Vis spectrometer.Control experiments: preparation of the TiO2 nanoparticles without using UHP
Control experiments were conducted without using UHP. All manipulations conducted before sealing the autoclave were carried out in a glovebag filled with nitrogen.TiCl4–H2O2/H2O–urea–CH2Cl2 system (TiO2_H2O2_urea): a CH2Cl2 solution of TiCl4 CH2Cl2 (6.50 mL, corresponding to 6.50 mmol TiCl4) was added to 30% aqueous H2O2 (1.47 mL, 13.0 mmol H2O2) and urea (0.781 g, 13.0 mmol) in an autoclave (TiCl4![[thin space (1/6-em)]](https://www.rsc.org/images/entities/char_2009.gif) :
:![[thin space (1/6-em)]](https://www.rsc.org/images/entities/char_2009.gif) urea
urea![[thin space (1/6-em)]](https://www.rsc.org/images/entities/char_2009.gif) :
:![[thin space (1/6-em)]](https://www.rsc.org/images/entities/char_2009.gif) H2O2
H2O2![[thin space (1/6-em)]](https://www.rsc.org/images/entities/char_2009.gif) :
:![[thin space (1/6-em)]](https://www.rsc.org/images/entities/char_2009.gif) water = 1
water = 1![[thin space (1/6-em)]](https://www.rsc.org/images/entities/char_2009.gif) :
:![[thin space (1/6-em)]](https://www.rsc.org/images/entities/char_2009.gif) 2
2![[thin space (1/6-em)]](https://www.rsc.org/images/entities/char_2009.gif) :
:![[thin space (1/6-em)]](https://www.rsc.org/images/entities/char_2009.gif) 2
2![[thin space (1/6-em)]](https://www.rsc.org/images/entities/char_2009.gif) :
:![[thin space (1/6-em)]](https://www.rsc.org/images/entities/char_2009.gif) 9 in a molar ratio). The autoclave was then sealed following the addition of CH2Cl2 (10.0 mL) to the mixture in the autoclave.
9 in a molar ratio). The autoclave was then sealed following the addition of CH2Cl2 (10.0 mL) to the mixture in the autoclave.
TiCl4–H2O–urea–CH2Cl2 system (TiO2_water_urea): a CH2Cl2 solution of TiCl4 (6.50 mL, corresponding to 6.50 mmol TiCl4) was added to water (1.47 mL, 57.2 mmol) and urea (0.781 g, 13.0 mmol) in an autoclave (TiCl4![[thin space (1/6-em)]](https://www.rsc.org/images/entities/char_2009.gif) :
:![[thin space (1/6-em)]](https://www.rsc.org/images/entities/char_2009.gif) urea
urea![[thin space (1/6-em)]](https://www.rsc.org/images/entities/char_2009.gif) :
:![[thin space (1/6-em)]](https://www.rsc.org/images/entities/char_2009.gif) water = 1
water = 1![[thin space (1/6-em)]](https://www.rsc.org/images/entities/char_2009.gif) :
:![[thin space (1/6-em)]](https://www.rsc.org/images/entities/char_2009.gif) 2
2![[thin space (1/6-em)]](https://www.rsc.org/images/entities/char_2009.gif) :
:![[thin space (1/6-em)]](https://www.rsc.org/images/entities/char_2009.gif) 13 in a molar ratio). The autoclave was then sealed following the addition of CH2Cl2 (10.0 mL) to the mixture in the autoclave.
13 in a molar ratio). The autoclave was then sealed following the addition of CH2Cl2 (10.0 mL) to the mixture in the autoclave.
TiCl4–H2O2/H2O–CH2Cl2 system (TiO2_H2O2): a CH2Cl2 solution of TiCl4 (6.50 mL, corresponding to 6.50 mmol TiCl4) was added to 30% aqueous H2O2 (1.47 mL, 13.0 mmol H2O2) in an autoclave (TiCl4![[thin space (1/6-em)]](https://www.rsc.org/images/entities/char_2009.gif) :
:![[thin space (1/6-em)]](https://www.rsc.org/images/entities/char_2009.gif) H2O2
H2O2![[thin space (1/6-em)]](https://www.rsc.org/images/entities/char_2009.gif) :
:![[thin space (1/6-em)]](https://www.rsc.org/images/entities/char_2009.gif) water = 1
water = 1![[thin space (1/6-em)]](https://www.rsc.org/images/entities/char_2009.gif) :
:![[thin space (1/6-em)]](https://www.rsc.org/images/entities/char_2009.gif) 2
2![[thin space (1/6-em)]](https://www.rsc.org/images/entities/char_2009.gif) :
:![[thin space (1/6-em)]](https://www.rsc.org/images/entities/char_2009.gif) 9 in a molar ratio). The autoclave was then sealed following the addition of CH2Cl2 (10.0 mL) to the mixture in the autoclave.
9 in a molar ratio). The autoclave was then sealed following the addition of CH2Cl2 (10.0 mL) to the mixture in the autoclave.
These autoclaves were heated in an oven at 80 °C for 30 h. The resultant solids were centrifuged, washed twice with ethanol, and dried under reduced pressure at ambient temperature.
Results and discussion
Preparation of the TiO2 nanoparticles using UHP
White smoke was formed when the autoclave used for the preparation of TiO2_20h was opened, a result showing that TiCl4 did not react completely and that a considerable number of Ti–Cl bonds remained upon reaction for 20 h. TiO2_30h, TiO2_42h and TiO2_70h were obtained as mixtures of transparent liquids and white solids, on the other hand, and fine white powders were obtained after these products were washed and dried. Thus, the characterization results of TiO2_30h, TiO2_42h and TiO2_70h are described hereafter. The Ti-based yields of TiO2_30h, TiO2_42h and TiO2_70h were 77, 71, and 77%, respectively.Fig. 2 shows the XRD patterns of the products. TiO2_30h, TiO2_42h and TiO2_70h correspond to anatase TiO2 (JCPDS no. 21-1272). It should be noted that the XRD profile does not change with variations in the reaction time. The XRD pattern of TiO2_70h also showed the presence of NH4Cl (JCPDS no. 7-8), however, when TiO2_70h was washed twice with ethanol (Fig. S1, ESI†), and TiO2_70h was thus washed four times. It should be noted that NH4Cl was also detected in unwashed TiO2_30h and TiO2_42h. NH4Cl seems to be formed from NH3 and HCl because of the hydrolysis of urea and TiCl4.31,32 The crystallite size of TiO2_30h, TiO2_42h and TiO2_70h calculated from the (101) reflections using Scherrer's formula33 were 8.7, 8.9 and 8.3 nm, respectively. These results demonstrate that the crystalline phase and particle size of these products remained unchanged, regardless of the reaction time.
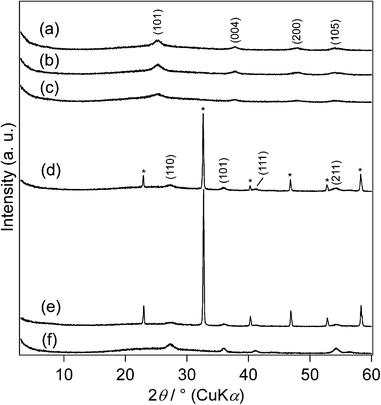 | ||
| Fig. 2 XRD patterns of (a) TiO2_30h, (b) TiO2_42h, (c) TiO2_70h, (d) TiO2_H2O2_urea, (e) TiO2_water_urea and (f) TiO2_H2O2 (*: NH4Cl). | ||
The products were further characterized by Raman spectroscopy (Fig. 3). The Raman spectrum of TiO2_30h shows bands at 154.4, 398.9, 514.6 and 639.7 cm−1. Bands at 153.1, 399.2, 513.4 and 640.0 cm−1 are present in the Raman spectrum of TiO2_42h. The Raman spectrum of TiO2_70h exhibits bands at 153.1, 399.2, 513.4 and 640.0 cm−1. These bands are assignable to anatase TiO2,34 as shown in Fig. 3. Thus, the Raman results are in accordance with the XRD observations. It was reported that the Raman shifts of the strongest Eg band near 154 cm−1 was sensitive to the particle size of TiO2 NPs, and the variations in the Eg band positions have been discussed in terms of phonon confinement,34,35 oxygen deficiency,36,37 and internal stress/surface tension effects.38,39 Thus, the Raman results are consistent with the formation of anatase TiO2 NPs.
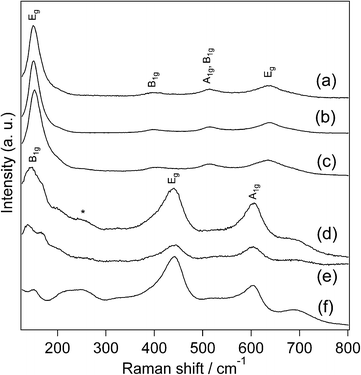 | ||
| Fig. 3 Raman spectra of (a) TiO2_30h, (b) TiO2_42h, (c) TiO2_70h, (d) TiO2_H2O2_urea, (e) TiO2_water_urea and (f) TiO2_H2O2 (*: two phonon scattering). | ||
Fig. 4 shows the IR spectra of the products and UHP. The O–O stretching band at 871 cm−121 of UHP disappears in all the spectra of the products, indicating that UHP did not remain as a solid. Broad bands between 950–700 and 600–400 cm−1, characteristic of the Ti–O stretching modes,40 are present in the spectra of all the products, which is consistent with TiO2 formation. In addition, bands assignable to urea are observed at ~3420 [br, νas(NH2)], ~3230 [br, νs(NH2)], 1640 [ν(CO), ρ(NH2)], 1561–1562 (the assignment of this band will be discussed in the following paragraph), 1399–1401 [ν(CN)], and 1154–1156 [ρ(NH2)] in the spectra of TiO2_30h, TiO2_42h and TiO2_70h.41 In addition, the 13C CP/MAS NMR spectrum of TiO2_30h exhibits a signal that is assignable to urea at 163 ppm42 (Fig. S2, ESI†).
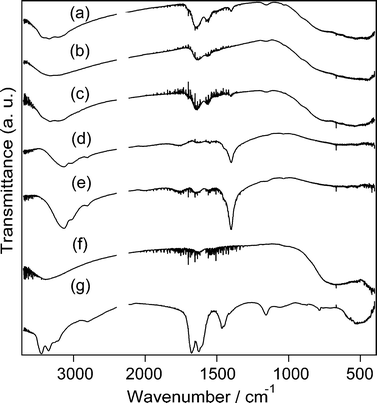 | ||
| Fig. 4 IR spectra of (a) TiO2_30h, (b) TiO2_42h, (c) TiO2_70h, (d) TiO2_H2O2_urea, (e) TiO2_water_urea, (f) TiO2_H2O2 and (g) UHP. | ||
The adsorption of urea on anatase TiO2 surfaces has been investigated using IR. It was reported that urea molecules adsorbed on anatase TiO2 surfaces exhibited characteristic bands at 1562–1552 cm−1, and based on the IR results, coordination of one of two nitrogen atoms in the urea molecule to the anatase TiO2 surface was proposed.43 IR spectra simulated for similar coordination arrangements as well as those of urea adsorbed on anatase TiO2 surfaces via the vapour phase were reported, and similar bands were present.44 Thus, the presence of the bands at 1561–1562 cm−1 strongly suggests a similar interaction between urea and the anatase TiO2 surfaces in the present study, and the bands are accordingly assigned to the νas(Ti–OCN–Ti) mode.
Further structural characterization of the products was carried out using TEM and FE-TEM. Fig. 5 shows the TEM and FE-TEM images of TiO2_30h, TiO2_42h and TiO2_70h. The TEM images of TiO2_30h, TiO2_42h and TiO2_70h show aggregated spheroid TiO2 NPs in aggregation sizes of about 10, 10–25 and 25–100 nm, respectively. In addition, the FE-TEM images of the products show the formation of spheroid NPs with a long axis of ~5 nm. This particle size is close to the crystallite size values estimated by Scherrer's formula. Thus, spheroid NPs with a long axis of ~5 nm tend to aggregate with an increase in reaction time. The lattice fringe, with a spacing of 0.35 nm, corresponds to the spacing of the (101) planes of anatase TiO2. It was reported that amines acted as shape controllers to yield spheroid NPs by their specific adsorption to the crystal planes parallel to the c-axis of TiO2 NPs.45,46 Since the IR results suggest that the NH2 groups of urea interacted with anatase TiO2, spheroid NPs are also likely to be obtained in the present study because of urea adsorption on TiO2 NPs.
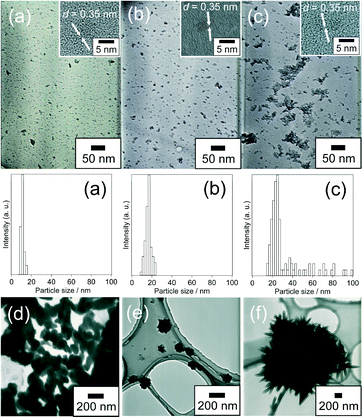 | ||
| Fig. 5 TEM and FE-TEM images of (a) TiO2_30h, (b) TiO2_42h, (c) TiO2_70h, (d) TiO2_H2O2_urea, (e) TiO2_water_urea, (f) TiO2_H2O2 and size distributions are shown for (a)–(c). | ||
The specific surface areas were estimated by the BET method (SBET). Fig. S3 in the ESI† shows nitrogen adsorption–desorption isotherms of TiO2_30h, TiO2_42h, and TiO2_70h. The SBET values of TiO2_30h, TiO2_42h and TiO2_70h were 231, 281, 247 m2 g−1, respectively.
Fig. S4 in the ESI† shows the TG curves of the products. The total mass losses up to 1000 °C of TiO2_30h, TiO2_42h and TiO2_70h are 23.7, 17.0 and 18.9 mass%, respectively. The molar ratios of Ti and urea in the products were measured by ICP and CHN analyses. The amounts of urea per Ti in TiO2_30h, TiO2_42h and TiO2_70h were 0.28, 0.12 and 0.17 (in mol), respectively (Table 1). The urea and adsorbed water ratios of the products were calculated based on the total mass loss of the TG curves and the molar ratios of Ti and urea. By assuming that all the organics are present as urea, the mass losses due to the thermal decomposition of urea in TiO2_30h, TiO2_42h and TiO2_70h are estimated to be 15.5, 6.6 and 9.8 mass%, respectively. The mass losses due to the evaporation of adsorbed water in TiO2_30h, TiO2_42h and TiO2_70h are calculated to be 8.0, 10.4 and 9.1 mass%, respectively (Table 1). Thus, the content of urea on the surface of the TiO2 NPs is increasing in the following order: TiO2_40h < TiO2_70h < TiO2_30h.
The amounts of urea can be discussed using the surface excess value reported for the urea adsorbed at the electrode/electrolyte interface, 4.96 × 10⁻⁶ mol m−2.47 Since the surface areas of TiO2 NPs without urea are not available, we utilize the surface areas of the TiO2 NPs with urea, 231–281 m2 g−1. The maximal values of urea for 1 g of the TiO2 NPs can thus be estimated to be 0.0688–0.0837 g. The values listed in Table 1, on the contrary, correspond to 0.080–0.202 g of urea for 1 g of unmodified TiO2 NPs. Thus, it is likely that large portions of the TiO2 NP surfaces are covered with urea, and excess urea may be present in TiO2_30h, in particular.
| Product name | Amount of urea/mass% | Amount of water/mass% |
|---|---|---|
| TiO2_30h | 15.5 | 8.0 |
| TiO2_42h | 6.6 | 10.4 |
| TiO2_70h | 9.8 | 9.1 |
The amounts of Cl− were measured by IC analysis. The amounts of Cl− in TiO2_30h, TiO2_42h and TiO2_70h were all below the limit of detection, indicating that no Ti–Cl bonds remained after the reaction for 30 h. On the other hand, the presence of Cl2 gas was investigated with a gas detection tube. The amount of Cl2 evolved upon opening the autoclave in a glovebag was 2.50 ppm for TiO2_30h.
Photocatalytic activity of the TiO2 nanoparticles dispersed in water
TiO2_30h and TiO2_42h were readily dispersed in water without ultrasonic treatment (Fig. S5, ESI†). The aqueous TiO2 NP dispersions were clear and colourless. This excellent dispersibility of the TiO2 NPs is likely to originate from the presence of hydrophilic urea on the surface. On the contrary, TiO2_70h was not dispersed in water, probably because of its larger aggregation size.The UV-Vis spectra of the dispersions were measured to estimate the energy band gap (Eg) (Fig. S6, ESI†). Absorptions below ~400 nm are present, and the Eg values can be estimated by the Kubelka–Munk function.48 The estimated Eg values of TiO2_30h and TiO2_42h are 3.33 and 3.31 eV, respectively. These Eg values are almost equal to or slightly larger than that of pure anatase (Eg = 3.30 eV).2
Fig. 6 shows the photocatalytic degradation behaviour of methylene blue over TiO2_30h and TiO2_42h. The absorbance at 664.5 nm, assignable to methylene blue, decreases gradually under UV light irradiation. It is clearly shown that TiO2_42h exhibits better photocatalytic activity. A possible reason for the higher photocatalytic activity of TiO2_42h is its lower urea content.
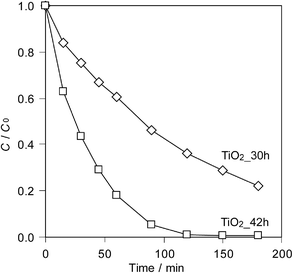 | ||
| Fig. 6 Photocatalytic degradation of methylene blue by TiO2_30h and TiO2_42h under UV irradiation. | ||
Control experiments: preparation of the TiO2 nanoparticles without using UHP
TiO2_H2O2_urea was a mixture of a yellow liquid and white solid. TiO2_water_urea was a mixture of a pale yellow liquid and while solid. TiO2_H2O2 was a mixture of a transparent liquid and while solid. White powders were obtained after these products were washed and dried. The Ti-based yields of TiO2_H2O2_urea, TiO2_water_urea and TiO2_H2O2 were 34, 23, and 63%, respectively.Fig. 2 shows the XRD patterns of the control experiment products. TiO2_H2O2_urea and TiO2_water_urea consist of rutile TiO2 (JCPDS no. 21-1276) and NH4Cl (JCPDS no. 7-8). The XRD pattern of TiO2_H2O2 corresponds to rutile TiO2. The crystallite sizes of TiO2_H2O2_urea, TiO2_water_urea and TiO2_H2O2 are calculated from the (110) reflections using Scherrer's formula33 as 11, 11, 12 nm, respectively.
The control experiment products were further characterized by Raman spectroscopy (Fig. 3). The Raman spectrum of TiO2_H2O2_urea shows bands at 148.3, 241.4, 437.6, and 604.7 cm−1. Bands are present at 141.7, 243.0, 437.6, and 604.3 cm−1 in the Raman spectrum of TiO2_water_urea. The Raman spectrum of TiO2_H2O2 shows bands at 151.5, 236.6, 439.1, and 612.1 cm−1. These bands are consistent with the bands observed for rutile TiO2,48,49 consistent with the XRD observation.
Fig. 4 shows the IR spectra of the control experiment products. A triply degenerate bending band of NH4+ is present at around 1400 cm−150 in the spectra of TiO2_H2O2_urea and TiO2_water_urea. This result suggests that NH4+ ions of NH4Cl were present in TiO2_H2O2_urea and TiO2_water_urea. Thus, the IR spectral results are in accordance with the XRD observation.
Fig. 5 shows the TEM images of TiO2_H2O2_urea, TiO2_water_urea and TiO2_H2O2. The control experiment products were not dispersed in water, partly because larger aggregates were present. TiO2_H2O2_urea shows the presence of connected spherical TiO2 with sizes between 200–300 nm. TiO2_water_urea consists of undulating spherical aggregates with sizes between 100–200 nm. TiO2_H2O2 is composed of the rod-like TiO2 form echinoid-like aggregates with sizes of about 400 nm.
The presence of Cl2 gas in the autoclaves was studied with a gas detection tube. The amount of Cl2 in the products of TiO2_H2O2_urea was below the limit of detection, 0.1 ppm.
These results clearly demonstrate that the control experiments gave rutile TiO2, different from the synthesis using UHP, which gave anatase TiO2. Thus, it is likely that the reaction paths for the control experiments are different from those for the synthesis using UHP. The formation conditions for rutile and anatase TiO2 in aqueous media can be discussed based on their structural characteristics. It is widely accepted that rutile TiO2 forms preferentially under acidic conditions in which the number of OH− is low. Such acidic conditions are advantageous for the corner-sharing bonding of TiO6 octahedra, leading to the formation of rutile TiO2.48,51 Anatase TiO2 is preferentially formed under basic conditions, on the other hand, since the presence of a large number of OH− increases the probability of edge-shared bonding and promotes the formation of anatase TiO2.48,51 In the control experiments conducted without the use of UHP, the system should consist of two immiscible phases, an aqueous phase and a CH2Cl2 phase. Thus, TiCl4 is likely to be hydrolyzed at their interface, leading to the formation of a highly acidic aqueous phase via the formation of HCl. (Note that urea and ammonia, which is a hydrolysis product of urea, are weak bases, and the Cl![[thin space (1/6-em)]](https://www.rsc.org/images/entities/char_2009.gif) :
:![[thin space (1/6-em)]](https://www.rsc.org/images/entities/char_2009.gif) N molar ratio was 1
N molar ratio was 1![[thin space (1/6-em)]](https://www.rsc.org/images/entities/char_2009.gif) :
:![[thin space (1/6-em)]](https://www.rsc.org/images/entities/char_2009.gif) 1.) Thus, TiO2 should be formed under acidic conditions to generate rutile TiO2. (The addition of urea in the preparation of TiO2 from a TiCl4 aqueous solution promoted the crystallization of anatase TiO2, but strongly acidic aqueous phases in the control experiments seem to cause rutile TiO2 formation.)52 In the synthesis conducted using UHP, on the contrary, the reaction starts in a homogeneous system. It is likely that UHP directly oxidizes TiCl4 in the early stage of the process, leading to the formation of anatase TiO2. The direct reaction between TiCl4 and UHP is consistent with the evolution of Cl2 only in the synthesis with UHP, since the Cl2 evolution indicates the presence of a redox reaction. This also indicates that, even in the presence of H2O2, the reactions proceed mostly via hydrolysis in the control experiments.
1.) Thus, TiO2 should be formed under acidic conditions to generate rutile TiO2. (The addition of urea in the preparation of TiO2 from a TiCl4 aqueous solution promoted the crystallization of anatase TiO2, but strongly acidic aqueous phases in the control experiments seem to cause rutile TiO2 formation.)52 In the synthesis conducted using UHP, on the contrary, the reaction starts in a homogeneous system. It is likely that UHP directly oxidizes TiCl4 in the early stage of the process, leading to the formation of anatase TiO2. The direct reaction between TiCl4 and UHP is consistent with the evolution of Cl2 only in the synthesis with UHP, since the Cl2 evolution indicates the presence of a redox reaction. This also indicates that, even in the presence of H2O2, the reactions proceed mostly via hydrolysis in the control experiments.
Another characteristic of the TiO2 NPs obtained by the synthesis conducted using UHP is high dispersibility in water, a result contrary to the control experiments results. This may be ascribable to the effective adsorption of urea on the surface. Urea could be released in CH2Cl2, and stabilized by coordinating to the Lewis acid site on the TiO2 NPs.
Based on the results, the reaction mechanisms of TiO2 formation are proposed, as shown in Fig. 7. In the UHP system, TiCl4 is likely to be oxidized directly by UHP to form anatase TiO2 in the early stage of the process. Released urea molecules appear to be adsorbed on the surface of the generated TiO2, leading to the formation of spheroid anatase TiO2 NPs. Since HCl is likely to form during this procedure (as suggested by the formation of NH4Cl), hydrolysis seems be involved in the latter stage. In the control reaction experiments, on the contrary, TiO2 seems to be formed mostly via hydrolysis and rutile TiO2 is formed in highly acidic aqueous media. (Note that hydrogen peroxide is available only in aqueous solutions.)
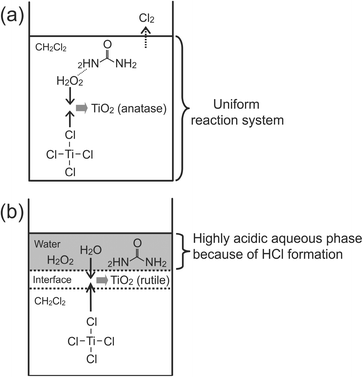 | ||
| Fig. 7 Proposed mechanism of the preparation of TiO2, (a) the TiCl4–UHP–CH2Cl2 system (in the early stage) and (b) the control experiments. | ||
Since variations in crystallite size are not evident after 30 h, the formation of anatase TiO2 NPs is essentially completed by 30 h. The main difference between TiO2_30h and TiO2_42h is the amount of adsorbed urea, possibly due to hydrolysis via contact with water, released from UHP. A comparison of TiO2_30h and TiO2_42h shows a tendency towards aggregation, and TiO2_70h exhibits clear aggregation of the TiO2 NPs. Since the addition of NH4Cl promoted the aggregation of TiO2 NPs,53 we assume that the formation of a large amount of NH4Cl (as shown in Fig. S1, ESI†) causes the aggregation of TiO2 NPs in TiO2_70h.
Conclusions
Spheroid anatase TiO2 NPs have been successfully prepared from TiCl4 using urea hydrogen peroxide (UHP) as an oxygen donor through a reaction at 80 °C for 30–70 h. The anatase TiO2 NPs exhibited high dispersibility in water, probably due to the presence of urea. The formation of Cl2 as well as a comparison with the results of control experiments performed without UHP suggests that anatase TiO2 NPs were formed via direct oxidation by UHP. The photocatalytic activity of the water-dispersible products (the reaction periods were 30 and 42 h) was estimated, and the product with a lower urea content exhibited better photocatalytic activity. The present results indicate that UHP can be utilized as an oxygen donor in preparations of TiO2 NPs, and its use could be extended to preparations of various metal oxides.Acknowledgements
This work was financially supported in part by a Grant-in-Aid for Scientific Research on Innovative Areas “New Polymeric Materials Based on Element-Blocks (No. 2401)” (24102002) and the Global COE program “Center for Practical Chemical Wisdom” of the Ministry of Education, Culture, Sports, Science, and Technology, Japan. The authors thank Mr. Satoru Sato for his experimental assistance.Notes and references
- G. A. Ozin and A. C. Arsenault, Nanochemistry – A Chemical Approach to Nanomaterials, RSC Publishing, London, 2006 Search PubMed.
- D. P. Macwan, P. N. Dave and S. Chaturvedi, J. Mater. Sci., 2011, 46, 3669–3686 CrossRef CAS.
- B. L. Cushing, V. L. Kolesnichenko and C. J. O'Connor, Chem. Rev., 2004, 104, 3893–3946 CrossRef CAS PubMed.
- J. A. Chang, M. Vithal, I. C. Baek and S. I. Seok, J. Solid State Chem., 2009, 182, 749–756 CrossRef CAS PubMed.
- D. A. H. Hanaor and C. C. Sorrell, J. Mater. Sci., 2011, 46, 855–874 CrossRef CAS.
- X. Chen and S. S. Mao, Chem. Rev., 2007, 107, 2891–2959 CrossRef CAS PubMed.
- S. M. Gupta and M. Tripathi, Cent. Eur. J. Chem., 2012, 10, 279–294 CrossRef CAS.
- Z. R. Ismagilov, L. T. Tsikoza, N. V. Shikina, V. F. Zarytova, V. V. Zinoviev and S. N. Zagrebelnyi, Russ. Chem. Rev., 2009, 78, 873–885 CrossRef CAS PubMed.
- M. Niederberger and G. Garnweitner, Chem.–Eur. J., 2006, 12, 7282–7302 CrossRef CAS PubMed.
- J. N. Hay and H. M. Raval, Chem. Mater., 2001, 13, 3396–3403 CrossRef CAS.
- P. H. Mutin and A. Vioux, Chem. Mater., 2009, 21, 582–596 CrossRef CAS.
- A. Vioux, Chem. Mater., 1997, 9, 2292–2299 CrossRef.
- P. Arnal, R. J. P. Corriu, D. Leclercq, P. H. Mutin and A. Vioux, Chem. Mater., 1997, 9, 694–698 CrossRef CAS.
- A. Aboulaich, B. Boury and P. H. Mutin, Chem. Mater., 2010, 22, 4519–4521 CrossRef CAS.
- L. Y. Yang, G. P. Feng and T. X. Wang, Mater. Lett., 2010, 64, 1647–1649 CrossRef CAS PubMed.
- R. S. Sapieszko and E. Matijević, J. Colloid Interface Sci., 1980, 74, 405–422 CrossRef CAS.
- Z. Ji, S. Zhao, C. Wang and K. Liu, Mater. Sci. Eng., B, 2005, 117, 63–66 CrossRef PubMed.
- D. Wang, Z. Ma, S. Dai, J. Liu, Z. Nie, M. H. Engelhard, Q. Huo, C. Wang and R. Kou, J. Phys. Chem. C, 2008, 112, 13499–13509 CAS.
- M. Kakihana, M. Kobayashi, K. Tomita and V. Petrykin, Bull. Chem. Soc. Jpn., 2010, 83, 1285–1308 CrossRef CAS.
- Y. Qian, Q. Chen, Z. Chen, C. Fan and G. Zhou, J. Mater. Chem., 1993, 3, 203–205 RSC.
- H. Ichinose, M. Terasaki and H. Katsuki, J. Ceram. Soc. Jpn., 1996, 104, 715–718 CrossRef CAS.
- H. Ichinose, M. Terasaki and H. Katsuki, J. Sol-Gel Sci. Technol., 2001, 22, 33–40 CrossRef CAS.
- N. Sasirekha, B. Rajesh and Y. W. Chen, Thin Solid Films, 2009, 518, 43–48 CrossRef CAS PubMed.
- M. S. Cooper, H. Heaney, A. J. Newbold and W. R. Sanderson, Synlett, 1990, 533–535 CrossRef PubMed.
- C. L. Fan, W.-D. Lee, N.-W. Teng, Y.-C. Sun and K. Chen, J. Org. Chem., 2003, 68, 9816–9818 CrossRef CAS PubMed.
- M. Marigo, J. Franzén, T. B. Poulsen, W. Zhuang and K. A. Jørgensen, J. Am. Chem. Soc., 2005, 127, 6964–6965 CrossRef CAS PubMed.
- M. C. Ball and S. Massey, Thermochim. Acta, 1995, 261, 95–106 CrossRef CAS.
- C.-S. Lu, E. W. Hughes and P. A. Giguère, J. Am. Chem. Soc., 1941, 63, 1507–1513 CrossRef CAS.
- S. Taliansky, Synlett, 2005, 1962–1963 CrossRef CAS PubMed.
- A. Hasaninejad, G. Chehardoli, M. A. Zolfigol and A. Abdoli, Phosphorus, Sulfur Silicon Relat. Elem., 2011, 186, 271–280 CrossRef CAS.
- A. M. Bernhard, D. Peitz, M. Elsener, A. Wokaun and O. Kröcher, Appl. Catal., B, 2012, 115, 129–137 CrossRef PubMed.
- C. Wang, C. Shao, Y. Liu and X. Li, Inorg. Chem., 2009, 48, 1105–1113 CrossRef CAS PubMed.
- K. Del Ángel-Sánchez, O. Vázquez-Cuchillo, M. Salazar-Villanueva, J. F. Sánchez-Ramirez, A. Cruz-López and A. Aguilar-Elguezabal, J. Sol-Gel Sci. Technol., 2011, 58, 360–365 CrossRef PubMed.
- V. Swamy, A. Kuznetsov, L. S. Dubrovinsky, R. A. Caruso, D. G. Shchukin and B. C. Muddle, Phys. Rev. B: Condens. Matter Mater. Phys., 2005, 71, 184302 CrossRef.
- S. Kelly, F. H. Pollak and M. Tomkiewicz, J. Phys. Chem. B, 1997, 101, 2730–2734 CrossRef CAS.
- J. C. Parker and R. W. Siegel, J. Mater. Res., 1990, 5, 1246–1252 CrossRef CAS.
- J. C. Parker and R. W. Siegel, Appl. Phys. Lett., 1990, 57, 943–945 CrossRef CAS.
- M.-H. Lee and B.-C. Choi, J. Am. Ceram. Soc., 1991, 74, 2309–2311 CrossRef CAS.
- W. Ma, Z. Lu and M. Zhang, Appl. Phys. A: Mater. Sci. Process., 1998, 66, 621–627 CrossRef CAS.
- T. Busani and R. A. B. Devine, Semicond. Sci. Technol., 2005, 20, 870–875 CrossRef CAS.
- J.-G. Li, X. Yang and T. Ishigaki, J. Phys. Chem. B, 2006, 110, 14611–14618 CrossRef CAS PubMed.
- X. Xiang, L. Guo, X. Wu, X. Ma and Y. Xia, Environ. Chem. Lett., 2012, 10, 295–300 CrossRef CAS.
- M. A. Larrubia, G. Ramis and G. Busca, Appl. Catal., B, 2000, 27, L145–L151 CrossRef CAS.
- A. M. Bernhard, I. Czekaj, M. Elsener and O. Kröcher, Appl. Catal., B, 2013, 134–135, 316–323 CrossRef CAS PubMed.
- T. Sugimoto, X. Zhou and A. Muramatsu, J. Colloid Interface Sci., 2003, 259, 53–61 CrossRef CAS.
- K. Kanie and T. Sugimoto, Chem. Commun., 2004, 1584–1585 RSC.
- F. M. Kimmerle and H. Ménard, Can. J. Chem., 1977, 55, 3312–3320 CrossRef CAS.
- X. Shen, J. Zhang and B. Tian, J. Hazard. Mater., 2011, 192, 651–657 CrossRef CAS PubMed.
- G. A. Samara and P. S. Peercy, Phys. Rev. B: Solid State, 1973, 7, 1131–1148 CrossRef CAS.
- N. E. Schumaker and C. W. Garland, J. Chem. Phys., 1970, 53, 392–407 CrossRef CAS.
- L. Kong, I. Karatchevtseva, M. Blackford, I. Chironi and G. Triani, J. Am. Ceram. Soc., 2012, 95, 816–822 CrossRef CAS.
- K. Ooi, Y. Miyai, S. Katoh and K. Sugasaka, Bull. Chem. Soc. Jpn., 1988, 61, 2721–2726 CrossRef.
- W.-Y. Cheng, J. R. Deka, Y.-C. Chiang, A. Rogeau and S.-Y. Lu, Chem. Mater., 2012, 24, 3255–3262 CrossRef CAS.
Footnote |
| † Electronic supplementary information (ESI) available. See DOI: 10.1039/c3ce41561a |
| This journal is © The Royal Society of Chemistry 2013 |
