 Open Access Article
Creative Commons Attribution 3.0 Unported Licence
Primary nucleation of salicylamide: the influence of process conditions and solvent on the metastable zone width
Fredrik L.
Nordström
a,
Michael
Svärd
b and
Åke C.
Rasmuson
*bc
aAbbVie, North Chicago, IL, USA
bDepartment of Chemical Engineering and Technology, KTH Royal Institute of Technology, Stockholm, Sweden. E-mail: rasmuson@ket.kth.se; Tel: +46-8-790 8227
cDepartment of Chemical and Environmental Science, Solid State Pharmaceutical Cluster, Materials and Surface Science Institute, University of Limerick, Ireland
First published on 3rd July 2013
Abstract
The onset of nucleation of salicylamide in organic solvents has been measured for a total of 2911 nucleation experiments at a constant cooling rate. The experiments are divided into series of different experimental conditions and for each series, the mean values and distributions of the nucleation events have been recorded. Generally, a significant spread in the onset of nucleation among identical repeated experiments was observed. The solvent and the cooling rate were found to be the factors exerting the greatest influence on the onset of nucleation, whereas the expected effects of the solution volume and the saturation temperature were largely absent. A correlation is observed between the supersaturation ratio at the average onset of nucleation and a group of parameters extracted from the pre-exponential factor in the classical nucleation rate equation, which is in agreement with the concept that a higher attachment frequency facilitates nucleation. It is also found that there can be a profound difference in the metastable zone width between experiments in open and closed crystallizers.
Introduction
An undersaturated solution that is being cooled down will typically start to crystallize at a certain temperature below the saturation temperature of the solute. This gap between the point of saturation of a solution and the onset of crystallization is usually referred to as the metastable zone width, MZW. Unlike the solubility, the MZW is not a thermodynamically defined property, but rather describes from a practical point of view the maximum level of supersaturation that can be operated in a process without having uncontrolled nucleation. It is also commonly interpreted as the maximum level of supersaturation where primary nucleation will not dominate the process, even though the distinction between primary and secondary nucleation is not always clear-cut. Some properties of the crystals obtained from a crystallization process are directly related to the MZW; a narrower metastable zone typically leads to an increase in the size of the particles and reduces the risk of obtaining unwanted solid phases, such as metastable polymorphs or solvates. However, from an industrial point of view, an overly narrow MZW may cause problems if a sudden temperature drop occurs in the process, e.g. as a result of transferring warm solutions between different reactors, or when performing polishing filtration operations. It also limits the option of utilizing seeded crystallization to control particle and bulk properties. On the other hand, a large MZW may lead to a rapid precipitation process, causing suboptimal impurity rejection, inclusion issues, poor filterability and potential difficulties in downstream operations, if not avoided by the introduction of seeds. In the pharmaceutical industry, controlling the crystal properties is essential for, in particular, the synthesis step involving the final active pharmaceutical ingredient, and a knowledge of the MZW is therefore of considerable importance and interest.The MZW depends primarily on the rate of nucleation, but may also be affected by the growth rate. It can vary significantly between different solute–solvent systems, and thus is difficult to predict. The MZW is known to be affected by a multitude of factors, among which are hydrodynamic conditions such as agitation rate, solution volume, reactor and impeller characteristics and dimensions, operating conditions such as the cooling rate and temperature, as well as other factors like solution impurities, the presence of particulates, the solution history1 and ultrasound.2 The design of a crystallization process may therefore require a relatively extensive amount of experimentation to achieve desired particle properties, and the scale-up is not trivial.
Primary nucleation is generally regarded as a stochastic phenomenon related to the random behaviour of molecules in solution, which prior to growing into visible crystals form sub-critical clusters. Despite the unpredictable arrangement of solute molecules forming ordered structures, few studies report of the variance in the MZW determined under reproducible experimental conditions. As pointed out by Izmailov et al. (1999),3 the stochastic nature of primary nucleation can only be captured by a great number of experiments and hence it is imperative that the nucleation experiments are repeated.
In the present paper, some of the factors expected to influence the MZW have been investigated: the saturation temperature, the solvent, the cooling rate and the solution volume. The difference when crystallization takes place in an open as opposed to a closed crystallizer has also been explored. The variance in the MZW has been quantified for each set of conditions by repeating experiments up to 200 times. The organic compound salicylamide was selected to rule out any effect of polymorphism, as it has only been found to crystallize as one solid form.4,5 To the best of our knowledge, no data on the primary nucleation of salicylamide has been reported previously.
Theory
In a metastable zone width experiment, as illustrated in Fig. 1, a solution is cooled down from a saturated state represented by point 1 (T1, x1, γ1), until nucleation takes place in the supersaturated solution at some point 2 (T2 = T3, x2 = x1, γ2). The MZW is traditionally quantified as an undercooling temperature difference, ΔT:| ΔT = T1 − T3 | (1) |
 | (2) |
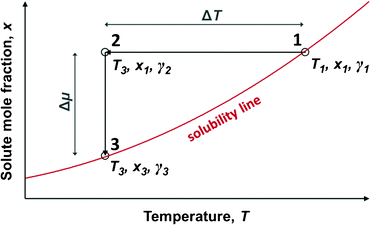 | ||
| Fig. 1 A schematic illustration of the metastable zone width. | ||
The metastable zone width is often used as a measure of the nucleation kinetics,6,7 which assumes that the time of growth of nuclei to experimental detection can be neglected. In the classical theory of homogeneous primary nucleation (CNT), the steady-state rate of nucleation, J, defined as the number of nuclei born in unit volume per unit time, can be written as:8,9
| J = f*C*Z | (3) |
| f* = 4πr*κCD | (4) |
 | (5) |
 | (6) |
 | (7) |
Z is given by:8
 | (8) |
 | (9) |
Apart from the interfacial energy, the solvent is expected to influence the pre-exponential part of eqn (9) (often denoted J0) through the mobility of molecules in solution, and the likelihood of a solute molecule attaching itself to a cluster. Making the comparison with molecular diffusivity in solution, the rate of transport of molecules should be inversely proportional to the solution viscosity, and proportional to the square root of the solvent molecular weight. Accordingly we would expect that the rate of nucleation besides the influence of the interfacial energy also exhibits a dependence such as:
 | (10) |
Aside from the solvent, concentration and temperature, several other experimental factors are known to affect the MZW, some of which can be introduced into the CNT through the pre-exponential factor by different models.8,9,13,14
It needs to be recognized that for experiments in general, such as those reported herein, nucleation will most likely be catalysed by e.g. surfaces of the equipment and dust particles, for which the term heterogeneous primary nucleation is used. The catalysing effect leads to a lowering of the interfacial energy, which is normally accounted for by introducing a correction factor in eqn (7), and occasionally by using the term ‘effective interfacial energy’. In addition, Cns, the concentration of nucleation sites appearing in eqn (6), takes on a lower value, which is usually assumed to explain why experimentally determined pre-exponential factors are much lower than theoretical estimates. However, the equations for heterogeneous nucleation exhibit the same basic functional form as for the homogeneous case. Furthermore, the nucleation data reported in this work retains a significant stochastic nature as well as an influence of solvent and other process conditions, and this is the main focus of analysis.
Experimental work
In total 2911 primary nucleation experiments have been carried out for salicylamide dissolved in five different pure solvents. The experiments are organized in series of multiple repeat experiments carried out under identical experimental conditions. 2558 experiments have been carried out in sealed test tubes each containing approx. 15 ml solution, 253 experiments have been carried out in sealed bottles containing 150 or 500 ml of solution, and 100 experiments have been carried out in jacketed crystallizers containing 150 ml of solution. For each solvent, the effects of different saturation temperatures (between 30–50 °C) and cooling rates (between 5–20 °C h−1) have been evaluated.Materials
Salicylamide (CAS reg. no.: 65-45-2) was purchased from Sigma-Aldrich (purity 99%) and used as obtained. The solvents methanol (MeOH, HiperSolv, purity >99.8%), acetonitrile (ACN, LiChrosolv, gradient grade, purity >99.8%), acetic acid (HAc, Pro Analysi, purity 96%), acetone (HiperSolv, purity >99.8%) and ethyl acetate (EtOAc, HiperSolv, purity >99.8%) were purchased from VWR/Merck and used as obtained.Procedure
Saturated solutions were prepared in 250 ml bottles by dissolving salicylamide in each solvent. The bottles were sealed and the solutions equilibrated in the presence of excess solids for a minimum of four hours at constant temperature, while being agitated using magnetic stir bars. The saturated solutions were filtered at 0.2 μm (PTFE) over to 20 ml test tubes (solution volume of 15 ml), 250 ml bottles (solution volume of 150 ml) or 500 ml bottles (solution volume of 500 ml) all made out of glass. PTFE magnetic stir bars with pivot rings were added to the test tubes (bar dimensions: 15 × 8 mm) and to the bottles (bar dimensions: 35 × 8 mm). The test tubes and bottles were tightly capped to prevent solvent evaporation and contamination.(i) The test tubes and bottles were placed in thermostatic water baths at 10 °C above the saturation temperature of the solutions, except for the acetone solutions saturated at 50 °C where only 5 °C superheating was used. The solutions in the test tubes and bottles were agitated at 300 rpm using a multipole magnetic stirring plate (Variomag) for a minimum of three hours to delete any effect of solution memory.1
(ii) The test tubes and bottles were then transferred to a cryostat (Julabo, FP45-HP, accuracy 0.01 °C) and agitated at 400 rpm. The water temperature in the cryostat corresponded to the saturation temperature of the solutions. A total of 14 test tubes or 4 bottles were placed simultaneously in the cryostat.
(iii) After 15 min, the solutions in the test tubes or bottles in the cryostat were cooled at a constant cooling rate of 5, 10 or 20 °C h−1 (verified in a separate experiment by placing a thermometer in the solution bulk) until nucleation was observed in all solutions. The onset of nucleation and the bath temperature shown on the cryostat display were recorded with a camcorder.
(iv) After crystallization was observed in the solutions, the test tubes or bottles were transferred back to the high temperature water bath, and the crystals were dissolved completely.
Steps (i)–(iv) were repeated up to 10 times. A total of at least 50 nucleation events were recorded for each set of experimental conditions. After the last cooling crystallization sequence, the crystals in the solutions were again dissolved completely and the concentration of the solutions determined gravimetrically. The experimental procedure of the gravimetric concentration measurements as well as the solubility of salicylamide in the aforementioned solvents have been reported previously.4 The temperature of the water bath and cryostat was validated by a calibration mercury thermometer (Thermo-Schneider, accuracy of 0.01 °C).
In an additional set of experiments, the MZW of salicylamide was determined in jacketed glass crystallizers (Saveen Werner, 250 ml) connected to a cryostat. 150 ml of saturated solution was filtered (pore size = 0.2 μm) and transferred to the crystallizer. The crystallizer was placed on top of a magnetic stirrer plate and the solution was agitated at 400 rpm using a PTFE stir bar (bar dimensions: 35 × 8 mm). The same procedure as previously outlined was employed, except that in half of these experiments no crystallizer lid was fitted, leaving the solution exposed to the surrounding air. In the other half of experiments the crystallizer was completely sealed.
The experimental results were examined for non-random behaviour, e.g. between the different tubes and bottles, different mother liquor preparations, etc., but no such behaviour could be found. The onset of nucleation was observed as a rapid transformation from a transparent solution into a white suspension and the temperature at which crystals first appeared in the solution was determined visually with an estimated accuracy of ±0.1 °C. Initial preliminary experiments conducted when the solutions were undersaturated for only 10 min resulted in a systematic gradual decrease of the MZW during successive cooling crystallizations of the same set of solutions. This effect of solution history disappeared when the solutions were kept in an undersaturated state as described for at least one hour. In this study, all solutions were maintained undersaturated for at least three hours to ensure the deletion of any solution memory.
Results and evaluation
The results are given as series of repeat experiments carried out under identical conditions, in one table for each solvent (Tables 1–5). The investigated experimental conditions are saturation temperature (Teq), cooling rate (−dT/dt), solution volume (Vsoln), and type of vessel used. The MZW is given as the average thermodynamic driving force approximated through eqn (2), [RT lnS]avg, the average supersaturation, Savg, and the average undercooling, ΔTavg, at the onset of nucleation, all calculated as the arithmetic mean. The standard deviations (SD) and standard errors (SE) are given in parentheses. The distributions of the nucleation events with the temperature obtained in different solvents at different saturation temperatures are shown in Fig. 2, for a cooling rate of 5 °C h−1 and a solution volume of 15 ml. It is evident that repeated cooling crystallizations performed under identical experimental conditions result in nucleation occurring over a wide temperature range. A wide distribution in the MZW was observed for all solvents and experimental conditions. A similar variability was observed for each solution maintained in the same vessel during consecutive dissolution–recrystallization experiments. Hence, the distribution in the data cannot be explained as emanating from inherent differences in the crystallizer vessels (e.g. imperfections in the vessel glass or differences in the stirrer bars), history of solution, or in the properties of each individual solution (e.g. impurities, particulates or small concentration differences).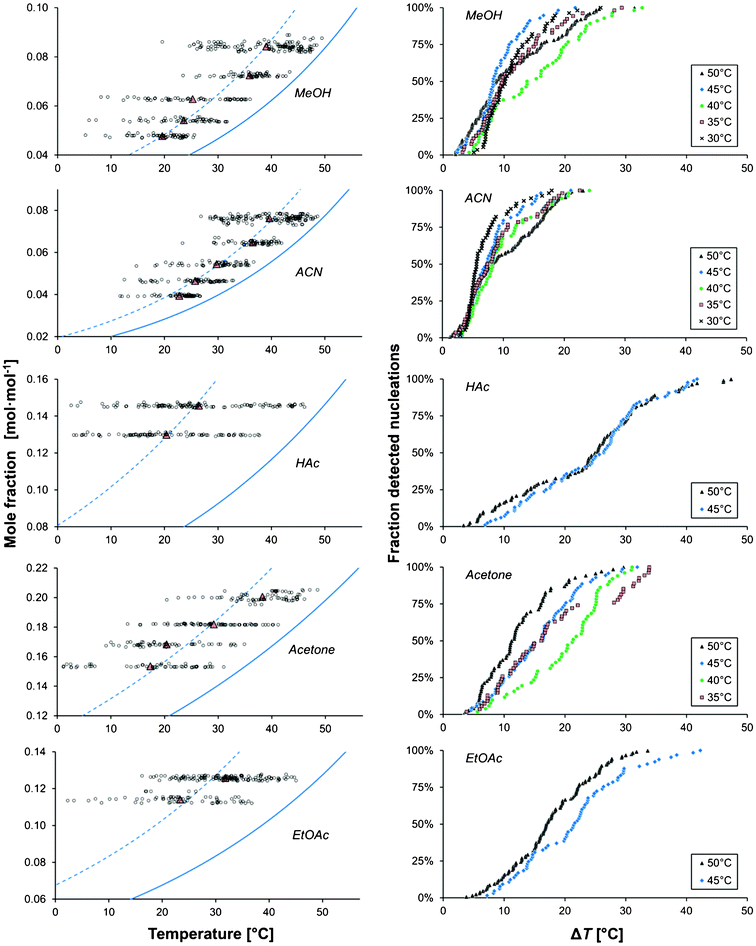 | ||
| Fig. 2 The onset temperature of nucleation (left) and the cumulative distribution of detected nucleation events with undercooling temperature (right) for different saturation temperatures, shown for five solvents (Vsoln = 15 ml, −dT/dt = 5 °C h−1). The red triangles indicate mean values, the solid lines show the solubility and dashed lines show the average ΔT. | ||
| Parameters | MZW | |||||||
|---|---|---|---|---|---|---|---|---|
| No. | Vessel type | Experiments | T eq [°C] | −dT/dt [°C h−1] | V soln [ml] | [RTlnS]avg (SD; SE) [kJ mol−1] | S avg (SD; SE) | ΔTavg (SD; SE) [°C] |
| A1 | Sealed test tube | 128 | 50 | 5 | 15 | 0.84 (0.50; 0.044) | 1.42 (0.31; 0.027) | 11.2 (7.0; 0.62) |
| A2 | Sealed test tube | 56 | 45 | 5 | 15 | 0.69 (0.29; 0.039) | 1.32 (0.16; 0.022) | 9.3 (4.1; 0.55) |
| A3 | Sealed test tube | 56 | 40 | 5 | 15 | 1.05 (0.50; 0.067) | 1.57 (0.35; 0.047) | 15 (7.6; 1.02) |
| A4 | Sealed test tube | 53 | 35 | 5 | 15 | 0.80 (0.39; 0.054) | 1.41 (0.26; 0.036) | 11.6 (6.1; 0.83) |
| A5 | Sealed test tube | 56 | 30 | 5 | 15 | 0.77 (0.28; 0.038) | 1.38 (0.18; 0.024) | 11.3 (4.5; 0.59) |
| A6 | Sealed test tube | 136 | 50 | 10 | 15 | 1.35 (0.49; 0.042) | 1.75 (0.33; 0.028) | 18.5 (7.0; 0.60) |
| A7 | Sealed test tube | 126 | 50 | 20 | 15 | 1.55 (0.51; 0.046) | 1.90 (0.39; 0.035) | 21.4 (7.6; 0.68) |
| A8 | Sealed 250 ml bottle | 128 | 50 | 20 | 150 | 1.53 (0.41; 0.037) | 1.87 (0.33; 0.029) | 21.1 (6.2; 0.55) |
| A9 | Sealed 500 ml bottle | 125 | 50 | 20 | 500 | 1.64 (0.38; 0.067) | 1.96 (0.32; 0.056) | 22.7 (5.7; 0.51) |
| A10 | Open crystallizer | 10 | 50 | 20 | 150 | 0.12 (0.03; 0.011) | 1.047 (0.01; 0.004) | 1.5 (0.4; 0.14) |
| A11 | Sealed crystallizer | 10 | 50 | 20 | 150 | 0.9 (0.38; 0.122) | 1.43 (0.23; 0.073) | 12 (5.4; 1.70) |
| Parameters | MZW | |||||||
|---|---|---|---|---|---|---|---|---|
| No. | Vessel type | Experiments | T eq [°C] | −dT/dt [°C h−1] | V soln [ml] | [RTlnS]avg (SD; SE) [kJ mol−1] | S avg (SD; SE) | ΔTavg (SD; SE) [°C] |
| B1 | Sealed test tube | 133 | 50 | 5 | 15 | 0.85 (0.48; 0.042) | 1.42 (0.28; 0.024) | 9.9 (5.8; 0.50) |
| B2 | Sealed test tube | 54 | 45 | 5 | 15 | 0.69 (0.33; 0.045) | 1.32 (0.19; 0.026) | 8.1 (4.0; 0.54) |
| B3 | Sealed test tube | 55 | 40 | 5 | 15 | 0.81 (0.42; 0.056) | 1.41 (0.27; 0.036) | 9.7 (5.1; 0.69) |
| B4 | Sealed test tube | 56 | 35 | 5 | 15 | 0.74 (0.42; 0.056) | 1.37 (0.26; 0.035) | 8.9 (5.2; 0.69) |
| B5 | Sealed test tube | 56 | 30 | 5 | 15 | 0.58 (0.29; 0.038) | 1.28 (0.17; 0.023) | 7.0 (3.6; 0.48) |
| B6 | Sealed test tube | 205 | 50 | 10 | 15 | 1.23 (0.57; 0.040) | 1.67 (0.37; 0.026) | 14.5 (6.9; 0.48) |
| B7 | Sealed test tube | 138 | 50 | 20 | 15 | 1.20 (0.56; 0.047) | 1.64 (0.38; 0.032) | 14.2 (6.8; 0.58) |
| B8 | Open crystallizer | 10 | 50 | 20 | 150 | 0.21 (0.04; 0.014) | 1.083 (0.02; 0.006) | 2.4 (0.5; 0.16) |
| B9 | Sealed crystallizer | 10 | 50 | 20 | 150 | 0.79 (0.27; 0.086) | 1.36 (0.15; 0.047) | 9 (3.2; 1.02) |
| Parameters | MZW | |||||||
|---|---|---|---|---|---|---|---|---|
| No. | Vessel type | Experiments | T eq [°C] | −dT/dt [°C h−1] | V soln [ml] | [RTlnS]avg (SD; SE) [kJ mol−1] | S avg (SD; SE) | ΔTavg (SD; SE) [°C] |
| C1 | Sealed test tube | 110 | 50 | 5 | 15 | 1.32 (0.57; 0.054) | 1.76 (0.43; 0.041) | 23 (10.7; 1.02) |
| C2 | Sealed test tube | 84 | 45 | 5 | 15 | 1.36 (0.48; 0.052) | 1.79 (0.38; 0.041) | 24 (9.3; 1.01) |
| C3 | Sealed test tube | 70 | 50 | 10 | 15 | 1.86 (0.42; 0.051) | 2.23 (0.43; 0.052) | 34 (8.6; 1.02) |
| C4 | Sealed test tube | 112 | 50 | 20 | 15 | 1.96 (0.40; 0.038) | 2.32 (0.41; 0.038) | 35.9 (8.1; 0.76) |
| C5 | Open crystallizer | 10 | 50 | 20 | 150 | 0.80 (0.30; 0.096) | 1.38 (0.18; 0.057) | 14 (5.4; 1.71) |
| C6 | Sealed crystallizer | 10 | 50 | 20 | 150 | 1.20 (0.28; 0.087) | 1.62 (0.22; 0.068) | 21 (5.2; 1.66) |
| Parameters | MZW | |||||||
|---|---|---|---|---|---|---|---|---|
| No. | Vessel type | Experiments | T eq [°C] | −dT/dt [°C h−1] | V soln [ml] | [RTlnS]avg (SD; SE) [kJ mol−1] | S avg (SD; SE) | ΔTavg (SD; SE) [°C] |
| D1 | Sealed test tube | 70 | 50 | 5 | 15 | 0.54 (0.25; 0.030) | 1.24 (0.13; 0.016) | 12.4 (5.9; 0.71) |
| D2 | Sealed test tube | 70 | 45 | 5 | 15 | 0.67 (0.27; 0.032) | 1.32 (0.15; 0.018) | 15.7 (6.5; 0.78) |
| D3 | Sealed test tube | 51 | 40 | 5 | 15 | 0.84 (0.27; 0.038) | 1.42 (0.16; 0.023) | 20.0 (6.7; 0.94) |
| D4 | Sealed test tube | 54 | 35 | 5 | 15 | 0.73 (0.36; 0.049) | 1.38 (0.23; 0.031) | 18 (9.1; 1.23) |
| D5 | Sealed test tube | 71 | 50 | 10 | 15 | 0.81 (0.37; 0.044) | 1.40 (0.22; 0.026) | 19 (8.9; 1.06) |
| D6 | Sealed test tube | 87 | 50 | 20 | 15 | 0.88 (0.29; 0.031) | 1.43 (0.17; 0.019) | 20.6 (7.0; 0.76) |
| D7 | Open crystallizer | 10 | 50 | 20 | 150 | 0.36 (0.10; 0.032) | 1.15 (0.05; 0.014) | 8.0 (2.3; 0.73) |
| D8 | Sealed crystallizer | 10 | 50 | 20 | 150 | 0.46 (0.09; 0.027) | 1.19 (0.04; 0.013) | 10.4 (2.0; 0.62) |
| Parameters | MZW | |||||||
|---|---|---|---|---|---|---|---|---|
| No. | Vessel type | Experiments | T eq [°C] | −dT/dt [°C h−1] | V soln [ml] | [RTlnS]avg (SD; SE) [kJ mol−1] | S avg (SD; SE) | ΔTavg (SD; SE) [°C] |
| E1 | Sealed test tube | 126 | 50 | 5 | 15 | 0.94 (0.34; 0.030) | 1.47 (0.21; 0.019) | 17.6 (6.7; 0.60) |
| E2 | Sealed test tube | 65 | 45 | 5 | 15 | 1.11 (0.40; 0.049) | 1.60 (0.29; 0.036) | 22 (8.5; 1.05) |
| E3 | Sealed test tube | 140 | 50 | 10 | 15 | 1.34 (0.36; 0.030) | 1.75 (0.28; 0.024) | 25.8 (7.6; 0.65) |
| E4 | Sealed test tube | 140 | 50 | 20 | 15 | 1.23 (0.41; 0.035) | 1.67 (0.30; 0.025) | 23.5 (8.5; 0.72) |
| E5 | Open crystallizer | 10 | 50 | 20 | 150 | 0.84 (0.30; 0.095) | 1.40 (0.18; 0.056) | 16 (5.9; 1.86) |
| E6 | Sealed crystallizer | 10 | 50 | 20 | 150 | 1.0 (0.32; 0.103) | 1.48 (0.19; 0.061) | 18 (6.4; 2.02) |
As shown in Tables 1–5 and in Fig. 2, the nucleation event distributions are very broad, especially in acetic acid and ethyl acetate, reaching a range of variation of about 35 °C. At the 15 ml scale for a cooling rate of 5 °C h−1, the average metastable zone width in acetonitrile is less than 10 °C and decreases when the saturation temperature/concentration is decreased. In methanol the metastable zone width is slightly wider and does not systematically change with the saturation temperature. In acetone, the MZW is between 10 and 20 °C and tends to decrease when the temperature is increased. In ethyl acetate and acetic acid the widest metastable zone widths are found.
Although the traditional way of presenting the metastable zone widths in terms of the degree of undercooling is useful from an industrial perspective, an analysis in terms of the chemical potential driving force or a corresponding simplified measure, eqn (2), is required in order to advance the understanding of the effect of various conditions on nucleation. In Fig. 3 the above distributions of the nucleation events are shown in terms of RTlnS. The driving force distributions obtained for each solvent are qualitatively similar to the corresponding ΔT-distributions (Fig. 2.) However, comparing the experiments in the 15 ml scale with a cooling rate of 5 °C h−1 reveals that nucleation in acetone requires the lowest average driving force, followed by methanol, acetonitrile and ethyl acetate, with the highest driving force required for nucleation in acetic acid; this order deviates from that obtained with respect to the degree of undercooling. This reflects the influence of the slope of the solubility curve, which is investigated in more detail below. It is notable that the distributions of the nucleation events with respect to RTlnS are relatively wide, and not markedly more compacted than the undercooling distributions, which is in contrast to the behaviour observed for other chemically related compounds.15–17
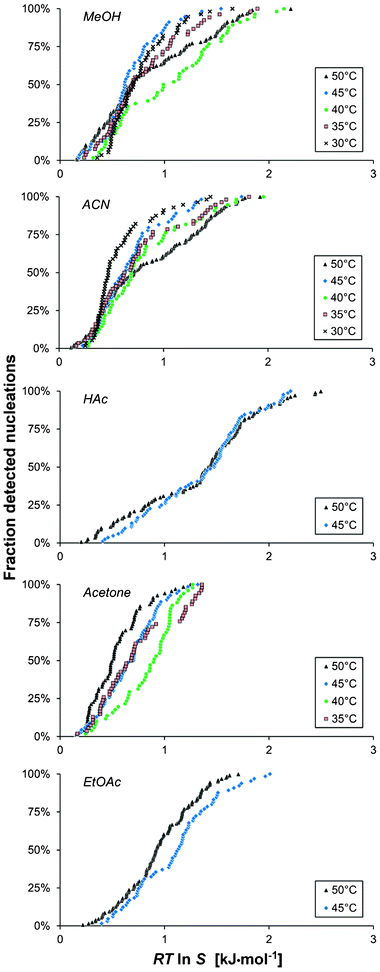 | ||
| Fig. 3 The cumulative distribution of the detected nucleation events with driving force for the nucleation, shown for five solvents (Vsoln = 15 ml and −dT/dt = 5 °C h−1) for different saturation temperatures: 50 °C (A1, black triangles), 45 °C (A2, blue diamonds), 40 °C (A3, green circles), 35 °C (A4, red boxes) and 30 °C (A5, crosses). | ||
Within each series of experiments performed under identical experimental conditions (Vsoln = 15 ml, Teq = 50 °C and −dT/dt = 5 °C h−1), the supersaturation ratio at nucleation spans a range from 1.08 to 2.97 in acetic acid and from 1.06 to 1.67 in acetone, corresponding to a driving force ranging from 0.20 to 2.50 kJ mol−1 in acetic acid and from 0.16 to 1.25 kJ mol−1 in acetone. The case is similar for the other three solvents.
The distribution of the nucleation events is a manifestation of the stochastic nature of nucleation in these experiments observed under dynamic conditions of decreasing temperature. When the temperature is decreased the driving force for the nucleation increases, and the kinetics of the various rate processes leading to the nucleation change with temperature as well. As a consequence, no simple statistical distribution is expected to provide a strictly valid representation. In the present work, it has been empirically found that the arithmetic mean of RTlnS corresponds closely to the mode of the distribution. In Fig. 4, the mean thermodynamic driving force at nucleation is shown graphically for all experimental series, together with the associated 95% confidence limits calculated by approximating normal distributions.
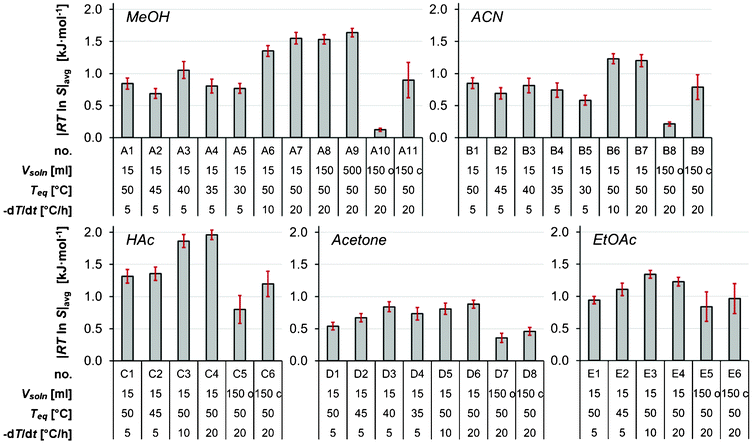 | ||
| Fig. 4 The average thermodynamic driving force for nucleation for all experimental series, with error bars showing 95% confidence intervals. | ||
With the possible exceptions of cooling crystallizations in methanol and acetonitrile in open crystallizers (A10–A11 and B8–B9), the variation in the onset of nucleation elucidates the problems associated with the concept of a constant MZW for a given set of experimental conditions. As shown in Fig. 5 there is a linear correlation between the magnitude of the width of the distribution and the average supersaturation ratio, Savg. The coefficient of variation around the straight line, given as 100·SD/(Savg − 1), equals 44%.
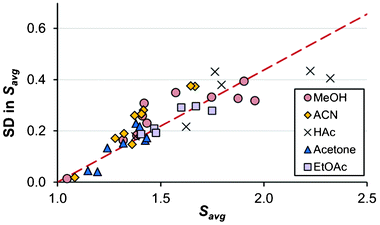 | ||
| Fig. 5 The relationship between the supersaturation at the average onset of nucleation (x-axis) and its associated standard deviation (y-axis) for solutions of methanol (red circles), acetonitrile (yellow diamonds), acetic acid (crosses), acetone (blue triangles) and ethyl acetate (purple boxes). Data from all experimental conditions (Tables 1–5). | ||
Analysis and discussion
In the following analysis, the focus is on analysing the impact of various process variables. No distinction is made of whether the nucleation is homogeneous or heterogeneous; it is sufficient for the purpose of this analysis that the basic functional forms of the equations used are the same as outlined in the theory section.The influence of the saturation temperature and cooling rate
In acetone as shown in Fig. 4, the mean driving force required for nucleation increases with a decrease in the saturation temperature down to Teq = 40 °C, in the 15 ml scale at a cooling rate of 5 °C h−1. This is in accordance with expectations, since the rates of various kinetic phenomena are slower at lower temperatures. The same observation is made for the more limited data in ethyl acetate. However, it is noted that the trend is not sustained with further decreases of Teq in acetone, and in acetic acid, methanol and acetonitrile there is no clear trend at all.The influence of the cooling rate on the MZW is shown in Fig. 6 as the average degree of undercooling versus the cooling rate for five solvents. As expected, the metastable zone width increases with an increasing cooling rate. This effect was particularly evident when comparing the cooling rates of 5 and 10 °C h−1, and in methanol and acetone. It has been suggested6,18 that there should be a linear relationship between lnΔT and ln(−dT/dt). Obviously, no clear linear correlation can be observed in Fig. 6, and consequently we have refrained from estimating the apparent nucleation order by the approach proposed by Nývlt.7
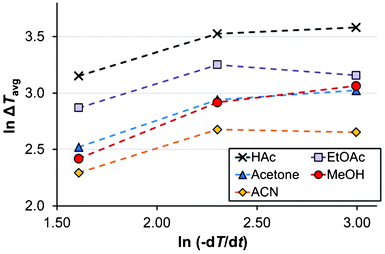 | ||
| Fig. 6 The relationship between undercooling at the average onset of nucleation and the cooling rate (Vsoln = 15 ml, Teq = 50 °C) in methanol (red, circles), acetonitrile (yellow, diamonds), acetic acid (black, crosses), acetone (blue, triangles) and ethyl acetate (purple, boxes). Lines are tie-lines only. | ||
The influence of the solution volume
The effect of the solution volume on the MZW of salicylamide was investigated in methanol at a cooling rate of 20 °C h−1 (A7–A9 in Table 1) using three different solution volumes, viz. 15, 150 and 500 ml. As shown in Fig. 7, both the average onset of nucleation as well as the overall shape and spread of the distribution were found to be essentially unaffected by the solution volume. Interestingly, the observed lack of influence of the solution volume on the MZW distribution is in contradiction with results reported by Kadam et al.19,20 and with the proposed single nucleus mechanism, wherein it is assumed that as soon as one single nucleus is formed and has grown to sufficient size it undergoes massive secondary nucleation. Given the assumption that the probability of a single primary nucleation event occurring in a solution within a given space of time dt is proportional to JVdt,21 a single nucleus mechanism entails that the average metastable zone width should be smaller in a larger volume and the distribution of nucleation events should have a lower coefficient of variation; a behaviour which is completely absent from the distributions shown in Fig. 7.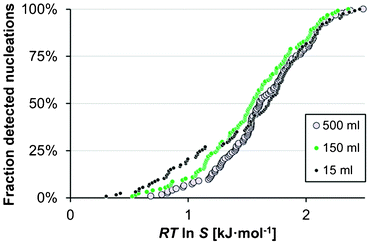 | ||
| Fig. 7 The cumulative distribution of the detected nucleation events in methanol (Teq = 50 °C, −dT/dt = 20 °C h−1) in 15 ml (A7, black), 150 ml (A8, green) and 500 ml (A9, white). | ||
The influence of the crystallizer design
In the present work, the nucleation experiments in methanol at the 150 ml scale show a decreased MZW of salicylamide when switching from a sealed bottle to a sealed jacketed crystallizer. The MZW of salicylamide in methanol in the crystallizers amounted to Savg = 1.43 ± 0.17 (A11), compared to Savg = 1.87 ± 0.06 (A8) in the bottles, corresponding to driving forces for nucleation of 0.90 ± 0.28 kJ mol−1 and 1.53 ± 0.07 kJ mol−1, respectively (95% confidence limits in parentheses). Although only 10 experiments were repeated in the jacketed crystallizers and acknowledging the large spread in the data, the difference is sufficiently significant not to be disregarded as merely a statistical artifact. As the cooling crystallizations were performed using identical experimental conditions, i.e. cooling rate, saturation temperature, solution volume and stirring rate, the difference in the MZW is attributed to the differences in the vessel design, which results in differences in the hydrodynamic conditions and a varying degree of inhomogeneities in temperature and concentration.Measurements of the MZW were also conducted in open jacketed crystallizers where the solution was exposed to the surrounding air (using no crystallizer lid), as opposed to the standard procedure in this work where evaporation was prevented by using airtight caps. The results are shown in Fig. 8. Depending on solvent, the results reveal a sometimes dramatic change in the MZW distributions: the mean values of RTlnS at nucleation decrease from 0.90 (A11) to 0.12 (A10) in methanol, and from 0.79 (B9) to 0.21 (B8) in acetonitrile upon the removal of the crystallizer lid, with a corresponding reduction in the associated standard deviations from 0.38 to 0.03 in methanol and from 0.27 to 0.04 in acetonitrile. Thus, a significantly increased repeatability is obtained in the observed onset of nucleation for open crystallizers. The corresponding behaviour in acetic acid, acetone and ethyl acetate is not as notable. Although for all three solvents the average MZW did decrease to some extent in the experiments where the crystallizer lid was removed, the differences when considering the entire distributions of the nucleation events are not that significant.
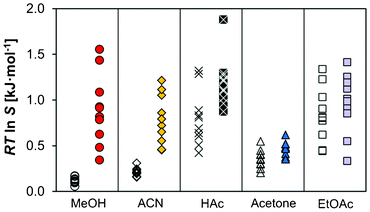 | ||
| Fig. 8 A comparison of the driving force required for nucleation in open (hollow symbols) and sealed (filled symbols) crystallizers (Teq = 50 °C, −dT/dt = 20 °C h−1) in methanol (A10, A11), acetonitrile (B8, B9), acetic acid (C5, C6), acetone (D7, D8) and ethyl acetate (E5, E6). | ||
The significant difference in the onset of nucleation of salicylamide in solutions of methanol and acetonitrile between crystallizers with and without lid suggests that in these cases, the evaporation of the solvent has a major influence on the nucleation kinetics. The evaporation of the solvent will result in a concentration gradient as well as a temperature gradient in the solution close to the surface, which may provide localized regions of higher supersaturation which in turn facilitate nucleation. The significant difference in the onset of nucleation of salicylamide in solutions of methanol and acetonitrile between crystallizers with and without lid suggests that in these cases, the evaporation of the solvent has a major influence on the nucleation kinetics. However, the absence of a significant difference in the MZW between open and closed crystallizers in acetic acid, acetone and ethyl acetate suggests that the effects of the solvent evaporation are less important for these solvents. It might have been expected that the nucleation in acetone, with the lowest boiling point and highest volatility of the investigated solvents, should be substantially facilitated by evaporation, but this was not observed, nor is there a correlation to the surface tension of the solvent.
It is possible that the reduction in the MZW in solutions of methanol and acetonitrile in open crystallizers could be due to the effect of a different nucleation mechanism in these solvents, where incidentally the mole fraction solubility is the lowest. The onset of nucleation in methanol and acetonitrile in open crystallizers was always seen to be preceded by a thin layer of crystals forming on the glass wall adjacent to the solution surface, but such a scaling process was never observed for the closed crystallizers or in the other three solvents.
The influence of the solvent
Of all the investigated experimental parameters, the choice of solvent was arguably found to exert the strongest effect on the onset of nucleation of salicylamide. The cumulative distributions in different solvents are compared in Fig. 9 for different saturation temperatures. The narrowest MZW was obtained in acetone, where the mean nucleation driving force (15 ml, Teq = 50 °C, −dT/dt = 5 °C h−1) is 0.54 kJ mol−1, which corresponds to an undercooling of 12.4 °C. For similar experimental conditions acetic acid resulted in the widest MZW of all the investigated solvents, with a mean nucleation driving force of 1.32 kJ mol−1, which corresponds to an undercooling of 23.4 °C. Intermediate values were obtained in acetonitrile, methanol and ethyl acetate, where the distributions for this set of experimental conditions overlap and the differences cannot be resolved with statistical significance. However, experiments at lower saturation temperatures indicate that the driving force for nucleation increases in the order acetonitrile < methanol < ethyl acetate.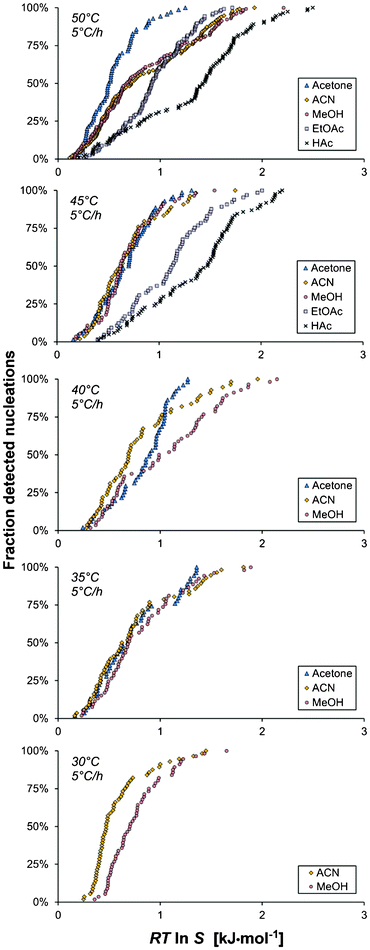 | ||
| Fig. 9 The cumulative distribution of the detected nucleation events with driving force for nucleation, shown for five saturation temperatures (Vsoln = 15 ml and −dT/dt = 5 °C h−1) for different solvents: methanol (A1–A5, red circles), acetonitrile (B1–B5, yellow diamonds), acetic acid (C1–C2, crosses), acetone (D1–D4, blue triangles) and ethyl acetate (E1–E2, purple boxes). | ||
For a given cooling rate, supersaturation will be generated at a different rate in different solvents. In Fig. 10a, the supersaturation is shown as a function of undercooling temperature for all five solvents for the experiments with a saturation temperature of 50 °C, with nucleation events for the experiments carried out at a cooling rate of 5 °C h−1 plotted on each curve. The rate of generation of RTlnS is approximately constant in all solvents over the investigated temperature range. In Fig. 10b, the average change in supersaturation with undercooling is plotted against lnxeq,50 °C. The rate of supersaturation generation decreases in the order acetonitrile > methanol > acetic acid > ethyl acetate > acetone, and shows a relatively clear inverse correlation to the mole fraction solubility4 (which is highest in acetone, followed by acetic acid, ethyl acetate, and then by methanol and acetonitrile). Such a correlation is expected22 and has been observed for similar compounds.15,17 However, there is no correlation between the ease of nucleation, in terms of the mean RTlnS, neither with the solubility nor with the rate of supersaturation generation. Apparently, the solvent influence on the nucleation of salicylamide has a more complex behaviour.
 | ||
| Fig. 10 a) The generated nucleation driving force vs. the undercooling temperature for the five solvents with the nucleation events plotted on the respective curve, and b) the temperature derivative of the nucleation driving force vs. the mole fraction solubility (Teq = 50 °C, −dT/dt = 5 °C h−1). | ||
In nucleation from melts, it has been reported that with an increased undercooling, the anticipated increase in the nucleation rate due to an increasing driving force can be counteracted by an increase in the viscosity, resulting in the nucleation rate reaching a maximum value at a certain level of undercooling beyond which it decreases.29 Such behaviour has also been observed for viscous supersaturated solutions of citric acid30 as well as for the protein crystallization of lysozyme.31 In the present study, no clear correlation could be established between the average MZW and the various individual physicochemical properties of the solvent, viz. boiling point, polarity, viscosity, density or molecular weight. However, as is shown in Fig. 11, for all three cooling rates there is a clear linear correlation (R2 > 0.95) between the average supersaturation ratio at the onset of nucleation and the viscosity of the solvent divided by the solute concentration in solution (mol m−3) times the square root of the solvent molar mass; a parameter group appearing in eqn (10). There is little difference in the linear slope obtained for the three cooling rates, but there is a displacement such that a higher supersaturation is systematically required for nucleation at higher cooling rates.
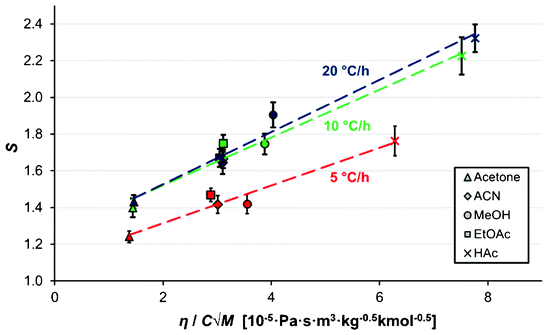 | ||
| Fig. 11 The dependence of the average supersaturation at nucleation on the solvent viscosity, molar mass and solute molar concentration (Vsoln = 15 ml, Teq = 50 °C), for cooling rates of 5 °C h−1 (red) 10 °C h−1 (green) and 20 °C h−1 (dark blue). The error bars represent 95% confidence limits. The viscosity values are from Xiang et al. (2006),23 Nikam et al. (1998),24 Narayan et al. (1988),25 Moreno et al. (2001),26 Hazra and Venkateswarlu (1978),27 and Bleazard et al. (1996).28 | ||
As discussed in the theory section, the parameter group used as the independent parameter in Fig. 11 originates from the attachment frequency factor. The square root of the solvent molecular weight divided by the viscosity is proportional to the diffusivity via the Stokes–Einstein equation and hence to the molecular mobility in the solution, and dividing by the concentration gives a parameter related to the frequency by which the free solute molecules collide with a cluster surface.  increases in the order acetone < ethyl acetate < acetonitrile < methanol < acetic acid. Among these solvents the viscosity is lowest in acetonitrile but the saturation concentration of salicylamide is about twice as high in acetone, which might explain why nucleation is easiest in this solvent. At the other end of the scale, in acetic acid the solubility is quite high, but due to a high viscosity the molecular mobility will be significantly lower. Naturally, at a molecular level more complex mechanisms could also contribute; the solvent has been shown to influence the aggregation of the molecules in solution32,33 and the relative growth rate of different crystal faces through selective adsorption.34 It is worth noting that when exchanging S for RTlnS the linear fits are only marginally worse, and also that a similar kind of correlation has been reported for the nucleation of the two polymorphs of the compound m-hydroxybenzoic acid.15
Conclusions
The metastable zone width for the nucleation of salicylamide at a constant cooling rate is shown to be fairly independent upon saturation temperature in the interval of 30–50 °C, while an increased cooling rate is shown to lead to a larger metastable zone in five common organic solvents. The average metastable zone width is found to decrease when the solvent is allowed to evaporate during the cooling crystallization compared to the case of a sealed crystallizer; in two out of five solvents (methanol and acetonitrile) this change is dramatic. No detectable influence on the metastable zone width of the crystallizer volume in the range 15–500 ml is seen for nucleations in methanol, but switching from a sealed bottle to a sealed, jacketed crystallizer resulted in a statistically significant decrease in the metastable zone width.Of the investigated parameters, the choice of solvent is shown to exert the strongest influence on the metastable zone width. A correlation has been found between the average supersaturation ratio at nucleation and a representation of the attachment frequency factor. This correlation holds for all solvents at different cooling rates.
The onset of nucleation of salicylamide is found to vary significantly between reproducibly conducted experiments. A fairly constant coefficient of variation with respect to the mean supersaturation ratio is observed in the different experiments, with a value of 44% obtained overall.
Notation
| a | Solute activity |
| C | Concentration of solute molecules |
| C* | Concentration of critical nuclei |
| C ns | Concentration of all molecules in solution |
| D | Diffusivity |
| f* | Molecular attachment frequency to critical cluster |
| ΔG* | Critical nucleus Gibbs free energy |
| J | Nucleation rate |
| J 0 | Nucleation rate pre-exponential factor |
| k | Boltzmann constant |
| M | Solvent molecular weight |
| R | Gas constant |
| r* | Critical nucleus radius |
| S | Supersaturation ratio |
| T | Temperature |
| t | Time |
| ΔT | Undercooling temperature |
| V | Volume |
| V m | Solute molar volume |
| x | Solute mole fraction |
| Z | Zeldovich correction factor |
| γ | Activity coefficient |
| η | Solvent viscosity |
| κ | Sticking coefficient |
| μ | Chemical potential |
| Δμ | Chemical potential driving force for nucleation |
| σ | Interfacial energy |
Subscripts, superscripts
| avg | Average (mean value) |
| eq | Equilibrium |
| soln | Solution |
Acknowledgements
M. S. gratefully acknowledges funding of the Swedish Research Council (621-2010-5391). Å. R. acknowledges the support of the Science Foundation Ireland (10/IN.1/B3038).Notes and references
- F. L. Nordström, M. Svärd, B. Malmberg and Å. C. Rasmuson, Cryst. Growth Des., 2012, 12, 4340 Search PubMed.
- S. Gracin, M. Uusi-Penttilä and Å. C. Rasmuson, Cryst. Growth Des., 2005, 5, 1787 CAS.
- A. F. Izmailov, A. S. Myerson and S. Arnold, J. Cryst. Growth, 1999, 196, 234 CrossRef CAS.
- F. L. Nordström and Å. C. Rasmuson, J. Chem. Eng. Data, 2006, 51, 1775 CrossRef.
- Y. Sasada, T. Takano and M. Kakudo, Bull. Chem. Soc. Jpn., 1964, 37, 940 CrossRef CAS.
- N. Kubota, J. Cryst. Growth, 2008, 310, 629 CrossRef CAS.
- J. Nývlt, J. Cryst. Growth, 1968, 3–4, 377 CrossRef.
- D. Kashchiev and G. M. van Rosmalen, Cryst. Res. Technol., 2003, 38, 555 CrossRef CAS.
- A. G. Walton, in Nucleation, ed. A. C. Zettlemoyer, Marcel Dekker, New York, 1969, p. 225 Search PubMed.
- I. V. Markov, Crystal Growth for Beginners, World Scientific, Singapore, 2003 Search PubMed.
- P. Bennema and O. Söhnel, J. Cryst. Growth, 1990, 102, 547 CrossRef CAS.
- A. Mersmann, J. Cryst. Growth, 1990, 102, 841 CrossRef CAS.
- A. S. Myerson and A. F. Izmailov, in Handbook of Crystal Growth, ed. D. T. J. Hurle, North-Holland, Amsterdam, 1993, vol. 1A, p. 249 Search PubMed.
- A. Mersmann, Chem. Eng. Res. Des., 1996, 74, 812 CAS.
- M. Svärd and Å. C. Rasmuson, Cryst. Growth Des., 2013, 13, 1140 Search PubMed.
- M. Svärd, F. L. Nordström, T. Jasnobulka and Å. C. Rasmuson, Cryst. Growth Des., 2010, 10, 195 Search PubMed.
- M. Svärd, F. L. Nordström, E.-M. Hoffmann, B. Aziz and Å. C. Rasmuson, CrystEngComm, 2013, 15, 5020 RSC.
- J. Nývlt, Collect. Czech. Chem. Commun., 1983, 48, 1977 CrossRef.
- S. S. Kadam, H. J. M. Kramer and J. H. ter Horst, Cryst. Growth Des., 2011, 11, 1271 CAS.
- S. S. Kadam, S. A. Kulkarni, R. C. Ribera, A. I. Stankiewicz, J. H. ter Horst and H. J. M. Kramer, Chem. Eng. Sci., 2012, 72, 10 CrossRef CAS.
- A. A. Chernov, Modern Crystallography III—Crystal Growth, Springer-Verlag, New York, 1984 Search PubMed.
- F. L. Nordström and Å. C. Rasmuson, Eur. J. Pharm. Sci., 2009, 36, 330 CrossRef.
- H. W. Xiang, A. Laesecke and M. L. Huber, J. Phys. Chem. Ref. Data, 2006, 35, 1597 CrossRef CAS.
- P. S. Nikam, T. R. Mahale and M. Hasan, J. Chem. Eng. Data, 1998, 43, 436 CrossRef CAS.
- J. Narayan, R. K. Wanchoo, G. K. Raina and G. A. Wani, Can. J. Chem. Eng., 1988, 66, 1021 CrossRef CAS.
- R. Moreno, A. Camacho, P. Olea, S. Canzonieri and M. Postigo, Rev. Boliv. Quim., 2001, 18, 79 Search PubMed.
- S. K. Hazra and C. Venkateswarlu, Chem. Petro-Chem. J., 1978, 9, 29 CAS.
- J. G. Bleazard, T. F. Sun and A. S. Teja, Int. J. Thermophys., 1996, 17, 111 CrossRef CAS.
- D. Turnbull and J. C. Fisher, J. Chem. Phys., 1949, 17, 71 CrossRef CAS.
- J. W. Mullin and C. L. Leci, J. Cryst. Growth, 1969, 5, 75 CrossRef CAS.
- W. Pan, A. B. Kolomeisky and P. G. Vekilov, J. Chem. Phys., 2005, 122, 174905 CrossRef.
- R. J. Davey, N. Blagden, S. Righini, H. Alison, M. J. Quayle and S. Fuller, Cryst. Growth Des., 2001, 1, 59 CAS.
- S. Hamad, C. Moon, C. R. A. Catlow, A. T. Hulme and S. L. Price, J. Phys. Chem. B, 2006, 110, 3323 CrossRef CAS.
- C. S. Towler, R. J. Davey, R. W. Lancaster and C. J. Price, J. Am. Chem. Soc., 2004, 126, 13347 CrossRef CAS.
| This journal is © The Royal Society of Chemistry 2013 |
