DOI:
10.1039/C3CE26984A
(Paper)
CrystEngComm, 2013,
15, 5020-5031
Thermodynamics and nucleation of the enantiotropic compound p-aminobenzoic acid
Received
7th December 2012
, Accepted 5th February 2013
First published on 7th February 2013
Abstract
In this work, the thermodynamic interrelationship of the two known polymorphs of p-aminobenzoic acid has been explored, and primary nucleation in different organic solvents investigated. The solubility of both polymorphs in several solvents at different temperatures has been determined and the isobaric solid-state heat capacities have been measured by DSC. The transition temperature below which form α is metastable is estimated to be 16 °C by interpolation of solubility data and the melting temperature of form β is estimated to be 140 °C by extrapolation of solubility data. Using experimental calorimetry and solubility data the thermodynamic stability relationship between the two polymorphs has been estimated at room temperature to the melting point. At the transition temperature, the estimated enthalpy difference between the polymorphs is 2.84 kJ mol−1 and the entropy difference is 9.80 J mol−1 K−1. At the estimated melting point of form β the difference in Gibbs free energy and enthalpy is 1.6 kJ mol−1 and 5.0 kJ mol−1, respectively. It is found that the entropic contribution to the free energy difference is relatively high, which explains the unusually low transition temperature. A total of 330 nucleation experiments have been performed, with constant cooling rate in three different solvents and with different saturation temperatures, and multiple experiments have been carried out for each set of conditions in order to obtain statistically significant results. All performed experiments resulted in the crystallization of the high-temperature stable α-polymorph, which is kinetically favoured under all evaluated experimental conditions. The thermodynamic driving force required for nucleation is found to depend chiefly on the solvent, and to be inversely correlated to both solvent polarity and to solubility.
Introduction
In unseeded cooling crystallizations, it is the initial step of primary nucleation which chiefly governs the outcome in terms of product size, shape and polymorph. Unfortunately, it is also the least understood step, depending in a complex way on thermodynamic as well as kinetic factors. Thermodynamically, it is quite straightforward – when a solution is brought to a state of supersaturation with respect to a given crystalline phase, this structure becomes a more stable state for the system than the pure solution, and nucleation and growth become theoretically possible. Because of kinetics, the process of primary nucleation becomes much more uncertain, especially in those cases where there are multiple competing polymorphs to be considered. Knowledge is lacking of the exact mechanism of how solute molecules desolvate and aggregate to form clusters which grow into nuclei. In the classical theory of nucleation, owing to the works of Gibbs,1,2 Volmer3 and others,4,5 individual molecules are assumed to continually attach to and detach from crystalline clusters, and the probability of a cluster growing into a viable nucleus and thence into a crystal will depend on its size and the interplay of the favourable bulk energy and the unfavourable interfacial energy. This theory suffers from several over-simplifying assumptions and is frequently found to predict nucleation rates which are orders of magnitude too high.6,7 One alternative theory which has been found to be applicable in a number of different cases, including occasional crystallization of small organic molecules from solution,6 states that nucleation proceeds in two steps; first by the emergence of clusters or droplets of higher solute concentration, followed by a reordering within these clusters into a crystalline structure. Another subject of debate is the relative importance of homogeneous and heterogeneous primary nucleation, and secondary nucleation effects. Nucleation has a strong stochastic component, generally resulting in a large spread in nucleation data carried out under identical conditions, but comparison of experiments done at a different scale have suggested that rapidly after the formation of the first few nuclei by primary nucleation, attrition can cause an outburst of secondary nuclei to form.8
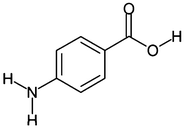
Aminobenzoic acids form a chemically simple class of molecules with industrial importance, exhibiting a strong tendency for crystal polymorphism. Recently,9 we investigated the polymorphism of m-aminobenzoic acid, a compound which so far has been found to possess at least five polymorphs,10 from a thermodynamic as well as a nucleation kinetic perspective. The three known polymorphs of the ortho-substituted isomer have recently been extensively studied.11,12 With regards to the para-isomer it is perhaps the least studied system from the point of view of crystallization. pABA (Fig. 1) is mainly used in the pharmaceutical industry, e.g. as a local anaesthetic. Two polymorphs are known, the α-form (Fα) and the β-form (Fβ), both with solved crystal structures.13,14 Unlike the meta-isomer, pABA exists predominantly in its non-zwitterionic form in aqueous solution,15 and neither crystal structure is zwitterionic.
In a previous study16 we presented solubility data of both polymorphs in water and ethyl acetate, and gave an account of various crystallization experiments in different solvents. Based on solubility data, the enantiotropic transition temperature was estimated to be 25 °C, and the enthalpy and entropy of the transition to be 5.5 kJ mol−1 and 19 J mol−1 K−1, respectively. In further work17 we investigated the influence of ultrasound on the polymorphic outcome. In more recent work18 the transition temperature has been reported to be lower than our estimate. Accordingly, there is a need for a refined analysis of the thermodynamic relationship between the two polymorphs. In addition, there has to our knowledge been no previous systematic work done on the nucleation of this compound, and in our earlier work16 it was made clear that a significant number of repeated experiments are needed at each set of conditions in order to obtain statistically valid data. In this contribution, we present reliable solubility data over a range of temperatures for Fα in seven different solvents and for Fβ in three solvents. These data are used to determine the difference in Gibbs free energy, enthalpy and entropy between Fα and Fβ from room temperature up to the melting point, to re-determine the stability transition temperature, and to obtain an estimate of the experimentally inaccessible melting temperature of Fβ. The work also contains a comprehensive investigation of the nucleation of pABA in three different solvents: ethyl acetate, acetonitrile and methanol. In total, 330 nucleation experiments are reported and the statistics of nucleation evaluated. In the course of this work, some of the data published previously,16e.g. solid-state heat capacities, have been re-determined with improved statistical confidence.
Experimental
Materials
p-Aminobenzoic acid (CAS reg. no. 150-13-0, purity > 99%) was purchased from Sigma-Aldrich, and used as obtained. The following solvents were purchased from VWR: ethyl acetate (>99.8%), acetic acid (>96%), acetonitrile (>99.8%), methanol (>99.9%), 2-propanol (>99.5%) and acetone (>99.8%). Ethanol (>99.7%) was purchased from Solveco. All organic solvents were used as obtained. Water used as solvent was deionised and filtered through a cellulose acetate membrane (pore size 0.2 μm).
Polymorph preparation and identification
Fourier transform infrared spectroscopy (FTIR) with an attenuated total reflectance module (Perkin Elmer Spectrum One) equipped with a ZnSe window, has been used for polymorph identification, using a scanning range of 650–2000 cm−1 and a resolution of 4 cm−1. The FTIR spectra of the two polymorphs (Fig. 2) exhibit sufficient dissimilarity from one another to be used for polymorph identification, in particular the presence of a peak at ∼1698 cm−1 in the Fβ-spectrum. The commercially unavailable Fβ was prepared by recrystallization from aqueous solution, in a 2.0 L jacketed batch glass crystallizer. A solution was created by dissolving Fα at 45 °C to a concentration corresponding to saturation at 25 °C. The solution was brought to 25 °C and seeded with a small amount of Fβ-crystals before cooling slowly at a rate of 1.5 °C h−1 until a sufficient number of crystals had formed.
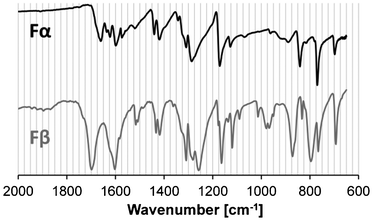 |
| | Fig. 2 FTIR spectra of the two pABA polymorphs: Fα (black, upper) and Fβ (grey, lower). | |
Solubility
Solubility data for both polymorphs in several solvents at different temperatures were measured using a gravimetric method. Solutions containing excess crystalline material were prepared in sealed 250 ml bottles and 20 ml glass vials agitated by PTFE-coated magnetic bars at 300 rpm, and were allowed to equilibrate by dissolution at different temperatures. The temperature was controlled with a Julabo FP-50 thermostatic bath to within ±0.01 °C. At each temperature, samples of 3–6 ml of clear solution were collected, using pre-heated syringes, and filters (PTFE, 0.2 μm) as needed, in glass vials. The solvent was then evaporated in a ventilated fume hood at room temperature. The mass of the solution and of the dry crystals were recorded with a precision of ±0.1 mg. Multiple samples were collected at each temperature. The polymorph at equilibrium with the solution was verified by FTIR.
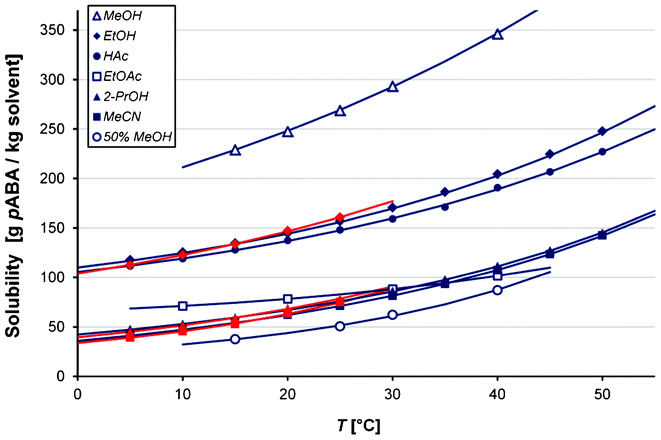
The solubility of Fα was determined in the range 5–50 °C with temperature increments of 5 °C in acetic acid, acetonitrile, ethanol and 2-propanol, in the range 15–40 °C at some temperature values in pure methanol and in a 50.0 vol% methanol–water solution, and between 10–40 °C in increments of 10 °C in ethyl acetate. The solubility of Fβ was determined in the range 5–25 °C in acetonitrile, ethanol and 2-propanol. Polymorph transformation precluded measurement of the solubility of Fβ at higher temperatures and in other solvents. In acetone, crystals of pABA invariably transformed into a solvate, the crystal structure and solubility of which will be reported separately.
Heat capacity
The specific heat capacity CP was determined for each polymorph by modulated DSC (TA Instruments DSC 2920) in a temperature ranging from 5 °C and upwards until either melting or polymorph transformation occurred. A modulation period of 80 s and an amplitude of ±0.5 °C were chosen, and the heat capacity was measured at different temperatures with the quasi-isothermal method using hermetic aluminium sample pans. The temperature was increased in steps of 5 °C and the scan time at each temperature was 20 min. Three samples of each polymorph were scanned. The temperature and calorimetric response signals were calibrated against the melting properties of indium, and the heat capacity signal was calibrated against a sapphire sample using a linear calibration model. Pan selection was done so as to keep the difference in weight between sample pan and reference pan as small as possible, and samples of 12–14 mg were used.
Primary nucleation
Saturated solutions (with respect to Fα) were prepared in 500 ml bottles at different saturation temperatures (Tsat), and then apportioned into sealed glass vials agitated with PTFE-coated magnetic bars (200 rpm), about 15 ml in each vial, in batches of 30 vials. Pre-heated syringes equipped with membrane filters (0.2 μm; PTFE or CA) were used. Before each experiment the solution concentration was verified gravimetrically as described above. Each batch was then kept at a temperature of Tsat + 10 °C for exactly 18 h in order to minimize the risk of solution memory influence.19,20 The temperature was then reduced at a constant cooling rate, and the visible onset temperature of each nucleation event recorded by means of a Sony DCR-SR72e camcorder. Nucleation was observed as a transition from clear to cloudy solution, and in all cases this transition was rapid in comparison with the slow cooling rate and the variation in nucleation temperature between individual vials, typically occurring with an uncertainty of the order of a minute or less. As soon as each vial had nucleated its contents were filtered through Munktell grade 00A filter paper and quickly dried in a ventilated fume hood, and the polymorph identified by FTIR.
Results and discussion
Thermodynamics
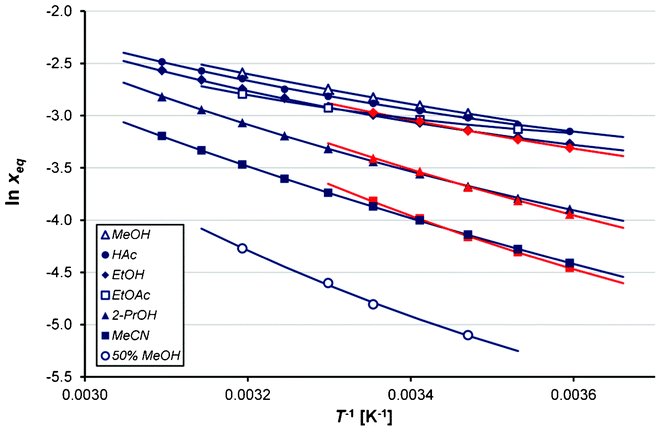
The solubility data are presented in Table 1. An empirical, three-parameter regression model was fitted to the data using the software Origin 6.1: xeq is the mole fraction solubility and T the temperature in Kelvin. The coefficients A, B and C are listed together with the corresponding goodness of fit (χ2) in Table 2. The experimental solubility data are shown together with the regression curves in Fig. 3. No transformation of Fα into Fβ was ever detected in the solubility experiments in any solvent. As regards transformations in the other directions, it was seen to occur readily in all the solvents above room temperature, which agrees with observations by Hao et al.18 The rate is higher in solvents with high solubility, and in acetonitrile and 2-propanol the transformation is slowest. In no solvent could the solubility of Fβ be reliably measured at temperatures above 20 °C, however. The mole fraction solubility is highest in methanol, followed in decreasing order by ethanol > acetic acid > ethyl acetate > 2-propanol > acetonitrile > 50% methanol–water and finally water.16 In the temperature range investigated the maximum mole fraction solubility observed in any solvent is less than 10%. In Fig. 4, the solubility is shown in a van't Hoff plot. It is notable that the van't Hoff enthalpy of solution shows a slight temperature dependence over the temperature range investigated.
Table 1 Solubility of the polymorphs of pABA given as average values together with 95% confidence limits, with the number of samples in brackets (also shown in Fig. 3)
|
|
Solubility [number of samples] in g pABA Fα kg−1 solvent |
|
T [°C] |
Acetic acid |
Acetonitrile |
Ethanol |
2-Propanol |
Methanol |
50% Methanol |
Ethyl acetate |
| 5 |
111.61 ± 0.41 [4] |
41.12 ± 0.18 [4] |
117.73 ± 0.33 [4] |
47.50 ± 0.68 [4] |
|
|
|
| 10 |
119.17 ± 0.64 [4] |
47.10 ± 0.10 [4] |
125.51 ± 0.35 [4] |
52.70 ± 0.75 [4] |
|
|
71.16 ± 0.90 [8] |
| 15 |
128.00 ± 0.53 [4] |
54.19 ± 0.56 [4] |
134.65 ± 0.33 [4] |
59.26 ± 0.84 [4] |
228.95 ± 0.21 [18] |
37.62 ± 1.49 [18] |
|
| 20 |
137.49 ± 0.08 [4] |
62.17 ± 0.54 [4] |
144.95 ± 0.25 [4] |
66.94 ± 0.76 [4] |
247.36 ± 0.09 [18] |
|
78.26 ± 0.30 [8] |
| 25 |
148.14 ± 0.62 [4] |
71.22 ± 0.62 [4] |
156.96 ± 0.27 [4] |
75.65 ± 0.78 [4] |
268.73 ± 0.32 [27] |
50.63 ± 0.40 [27] |
|
| 30 |
159.21 ± 2.26 [4] |
81.38 ± 0.67 [4] |
170.57 ± 0.18 [4] |
85.96 ± 0.80 [4] |
293.25 ± 0.63 [24] |
62.16 ± 1.14 [15] |
88.20 ± 0.33 [8] |
| 35 |
171.07 ± 0.67 [4] |
93.34 ± 0.11 [4] |
186.29 ± 0.40 [4] |
97.72 ± 0.57 [4] |
|
|
|
| 40 |
190.66 ± 0.53 [4] |
107.39 ± 0.10 [4] |
204.39 ± 0.53 [4] |
111.41 ± 0.54 [4] |
346.08 ± 0.82 [18] |
87.08 ± 2.26 [9] |
101.64 ± 1.02 [10] |
| 45 |
206.60 ± 1.58 [4] |
123.58 ± 0.19 [4] |
224.53 ± 0.57 [4] |
127.12 ± 0.38 [4] |
|
|
|
| 50 |
227.12 ± 2.10 [4] |
142.55 ± 0.50 [3] |
247.67 ± 1.03 [4] |
144.90 ± 0.03 [4] |
|
|
|
|
|
Solubility [number of samples] in g pABA Fβ kg−1 solvent |
|
T [°C] |
|
Acetonitrile |
Ethanol |
2-Propanol |
|
|
|
| 5 |
|
39.21 ± 0.23 [10] |
112.77 ± 0.74 [5] |
45.14 ± 0.72 [6] |
|
|
|
| 10 |
|
45.72 ± 0.28 [8] |
122.74 ± 0.31 [6] |
51.57 ± 0.38 [8] |
|
|
|
| 15 |
|
52.94 ± 0.28 [5] |
133.75 ± 0.25 [8] |
58.75 ± 0.17 [6] |
|
|
|
| 20 |
|
63.32 ± 0.53 [4] |
147.14 ± 0.95 [4] |
68.63 ± 0.20 [7] |
|
|
|
| 25 |
|
75.15 ± 0.35 [6] |
160.64 ± 4.27 [4] |
78.12 ± 0.57 [8] |
|
|
|
Table 2 Solubility regression coefficients for both polymorphs in different solvents
| Polymorph, solvent |
A
|
B
|
C
|
χ
2
|
| Fα |
|
|
|
|
| Acetic acid |
1591.08 |
−17.8982 |
0.03247 |
0.00002 |
| Acetonitrile |
55.19 |
−12.2594 |
0.02751 |
0.00006 |
| Ethanol |
1990.35 |
−20.9456 |
0.03780 |
0.00000 |
| 2-Propanol |
1179.45 |
−18.4843 |
0.03905 |
0.00001 |
| Methanol |
318.95 |
−9.5971 |
0.01912 |
0.00001 |
| 50% methanol |
3489.99 |
−38.0332 |
0.07224 |
0.00067 |
| Ethyl acetate |
2845.94 |
−25.4587 |
0.04336 |
0.00000 |
|
|
| Fβ |
|
|
|
|
| Acetonitrile |
2535.84 |
−30.9134 |
0.06233 |
0.00006 |
| Ethanol |
1183.11 |
−16.2470 |
0.03122 |
0.00001 |
| 2-Propanol |
999.93 |
−18.4005 |
0.03905 |
0.00008 |
The heat capacity has been determined as a function of temperature, for each polymorph using data from three DSC scans correlated by a linear regression model:
where
T is the temperature in Kelvin. The coefficients
k1 and
k2 are listed in
Table 3. The heat capacity of Fα at room temperature is approx. 17 J mol
−1 K
−1 (≈12%) higher than the corresponding value for Fβ. The data for both polymorphs are close to the previously published data.
16 No attempts to determine the heat capacity of the melt or of the solid forms at higher temperatures have been made because of material losses due to
sublimation and
evaporation.
Table 3 Heat capacity regression coefficients for both polymorphs together with Pearson R-values
| Polymorph |
T-interval [K] |
k
1 [J mol−1 K−2] |
k
2 [J mol−1 K−1] |
R
2
|
| Fα |
280–440 |
0.4623 |
12.70 |
0.998 |
| Fβ |
280–350 |
0.4440 |
1.25 |
0.996 |
Estimation of the stability transition temperature, Ttr
A comparison of the solubility of Fα and Fβ at different temperatures shows that the stability transition temperature below which Fβ is stable is located slightly below room temperature. At the transition temperature the ratio of the mole fraction solubility of Fβ![[thin space (1/6-em)]](https://www.rsc.org/images/entities/char_2009.gif) :
:![[thin space (1/6-em)]](https://www.rsc.org/images/entities/char_2009.gif) Fα in any solvent is by definition equal to unity. In Fig. 5 the solubility ratio is plotted for three solvents at temperatures where experimental values are available. From the figure we can read that: i) the ratio in all solvents is close to unity, as solubility values of the two polymorphs are very close (within a few per cent) in this temperature interval, and ii) the value of the ratio at each temperature is similar in the different solvents, indicating that it is acceptable as a first approximation to neglect the concentration dependence of the activity coefficients. As shown in Fig. 5, data in all three solvents indicate that the transition occurs around 290 K. A simple linear regression over all data:
Fα in any solvent is by definition equal to unity. In Fig. 5 the solubility ratio is plotted for three solvents at temperatures where experimental values are available. From the figure we can read that: i) the ratio in all solvents is close to unity, as solubility values of the two polymorphs are very close (within a few per cent) in this temperature interval, and ii) the value of the ratio at each temperature is similar in the different solvents, indicating that it is acceptable as a first approximation to neglect the concentration dependence of the activity coefficients. As shown in Fig. 5, data in all three solvents indicate that the transition occurs around 290 K. A simple linear regression over all data: | |  | (3) |
yields a Ttr of 289.0 K (15.9 °C) for a solubility ratio of unity. It is notable in Fig. 5 that data in the three solvents coincide at approx. 293 K, but at that temperature the solubility ratio is almost 1.02. The transition temperature can also be computed using eqn (1) with parameters from Table 2 for each polymorph, by setting ln xeq,α = lnxeq,β, and then solving the resulting second order equation for Ttr for each solvent. This results in the values listed in the first three rows of Table 4. For comparison, based on a slurry conversion experiment in ethanol, a temperature interval for the transition of 13–15 °C was recently reported,18 and the values in Table 4 are fairly close. All things considered, there can be no doubt that pABA Fα + Fβ constitutes an enantiotropic system with a transition point below room temperature; a rare phenomenon sometimes assumed not to exist.21
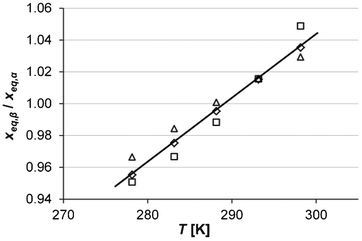 |
| | Fig. 5 Mole fraction solubility ratio of the two polymorphs at different temperatures in acetonitrile (squares), 2-propanol (diamonds) and ethanol (triangles), together with linear regression over all the data. | |
Table 4 Estimations of the transition temperature and the melting point of Fβ from solubility data
| Solvent |
T
tr [°C] |
T
m,β [°C] |
| Ethanol |
14.7 |
159.7 |
| 2-Propanol |
16.2 |
135.4 |
| Acetonitrile |
17.3 |
119.1 |
| Average |
16.1 |
138.1 |
| Estimated using eqn (3) |
15.9 |
|
| From ref. 18 |
13.8 |
|
Estimation of the melting temperature of Fβ, Tm,β
The reported melting temperature of Fα is 187.3 °C16 but no data on the melting point of Fβ have been recorded. An estimate of the melting point of Fβ can be obtained by extrapolation of solubility data in different solvents. Inserting the value lnxeq = 0 into eqn (1) and solving the resulting second order equation, eqn (4), for T using the parameters in Table 2 results in predicted values of the melting point ranging from 119–160 °C depending on the solvent, as given in Table 4. As expected, this method of estimating the melting point only gives a very approximate result, and does depend on the functional form of the equation used to correlate the solubility data.22 It is reasonable to expect better approximations for solvents where the solubility is high, resulting in a smaller van't Hoff plot curvature (cf.Fig. 4). Notably, the predicted Tm actually increases with increasing solubility among the three solvents. | |  | (4) |
Estimation of the relative thermodynamic stability as a function of temperature
For the polymorphic transformation Fβ → Fα, the Gibbs free energy is equal to: | | | ΔGβ→α = Gα − Gβ = ΔHβ→α− TΔSβ→α = Hα − Hβ − T[Sα − Sβ] | (5) |
where the enthalpies and entropies can be obtained by integration of the heat capacities from the respective values at some reference temperature Tref: | |  | (6) |
| |  | (7) |
At the transition temperature, Ttr, ΔGβ→α = 0. Combining eqn (5)–(7) using Ttr as reference results in:
| |  | (8) |
Neither the enthalpy difference nor the entropy difference between the polymorphs at the transition temperature are known, and must be estimated. For the polymorphic transformation Fβ → Fα:
| |  | (9) |
The free energy difference between the polymorphs can be expressed in terms of their solid-state activities, aα and aβ:
| |  | (10) |
where the last approximation is subject to the assumptions i) that the ratio of activity coefficients is approximately equal to unity at temperatures close to
Ttr, and ii) that the difference in temperature derivatives of the activity coefficient in saturated solutions of the two respective phases can be neglected. Combining
eqn (9) and
(10) results in:
| |  | (11) |
Experimental solubility data in a sufficiently small temperature interval centred on Ttr can now be used to estimate ΔSβ→α (Ttr). In Fig. 6RTln(xeq,α/xeq,β) is plotted against T at five temperatures (Table 1). From this data, the entropy difference was obtained as the slope of a linear function fitted to the data, in each separate solvent and in all three solvents, respectively (R2-factors between 0.92–0.99). Using eqn (5) and the fact that ΔGβ→α (Ttr) = 0, the enthalpy difference ΔHβ→α (Ttr) can now be calculated from the ΔSβ→α (Ttr) values and the transition temperatures obtained in each solvent (Table 4). The results are given in Table 5. The correlation is strongest in the two alcohols, which also result in the lowest values of the enthalpy and entropy of transition.
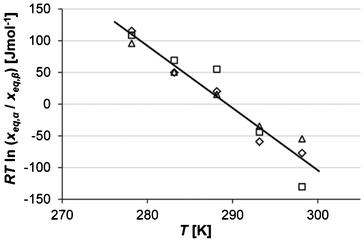 |
| | Fig. 6 Values of RTln(xeq,α/xeq,β) at different temperatures in acetonitrile (squares), 2-propanol (diamonds) and ethanol (triangles), together with a linear regression over all the data. | |
Table 5 Estimated values of the enthalpy and entropy of transformation at the transition point and Pearson R-values for the linear correlation
| Solvent |
ΔHβ→α [kJ mol−1] |
ΔSβ→α [J mol−1 K−1] |
R
2
|
| Ethanol |
2.22 |
7.72 |
0.986 |
| 2-Propanol |
2.86 |
9.88 |
0.970 |
| Acetonitrile |
3.43 |
11.82 |
0.923 |
| All solvents |
2.84 |
9.80 |
0.923 |
The last row in Table 5 gives the entropy of transformation obtained with a regression over all the data in the three solvents, 9.80 J mol−1 K−1, and the corresponding value of the enthalpy, 2.84 kJ mol−1, calculated using Ttr = 289.2 K. Notably, these values are markedly lower than those obtained from extrapolation of the slopes of the solubility curves in ethyl acetate and water,16 using a transition temperature of 298 K. Insertion into eqn (8) allows the free energy difference of the two polymorphs to be calculated as a function of temperature. The enthalpic and entropic components are calculated using eqn (6) and (7). Fig. 7 shows the resulting estimate of how the thermodynamic functions ΔGβ→α, ΔHβ→α, and −TΔSβ→α depend on temperature, extrapolated from 0 °C up to the melting temperature of Fα. The estimated Gibbs free energy difference diverges from the transition point with increasing temperature, reaching a value at the estimated melting point of Fβ (411 K) of about −1.6 kJ mol−1, with corresponding values of the enthalpy and entropy terms of 5.0 kJ mol−1 and 6.6 kJ mol−1, respectively. With regards to the entropy term, it is quite high, and this of course forms an important part of the explanation for the unusually low transition temperature. A value of 3.1 kJ mol−1 at 300 K can tentatively be compared to a reported estimation,21 based on lattice dynamical calculations on 204 polymorphic pairs of organic molecules, that the TΔS-term at room temperature in the vast majority of cases is below 2.4 kJ mol−1. For comparison, we have previously reported16 an experimental value of the enthalpy of transformation, 2.54 kJ mol−1 at T = 86.1 °C, measured with DSC (albeit with significant uncertainty). Using eqn (6), a value of 4.0 kJ mol−1 is obtained at the same temperature, which is consistent with the underestimation of the enthalpy that is to be expected from the DSC treatment.
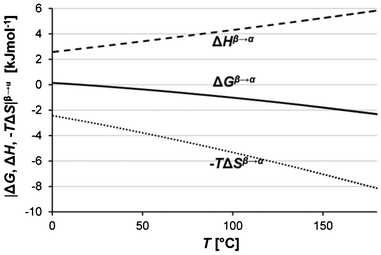 |
| | Fig. 7 Estimated values of the Gibbs free energy of transformation (Fβ → Fα) and its components plotted against temperature: ΔGβ→α (solid line), ΔHβ→α (dashed line) and −TΔSβ→α (dotted line). | |
Primary nucleation
Seven experimental series, each comprising one or two batches of 30 crystallization experiments, with three different solvents and different cooling rates and saturation temperatures, were carried out. The experimental details are listed in Table 6. All experiments resulted in the nucleation of Fα. The table also lists the average chemical potential driving force at nucleation with respect to Fα, and in the last two columns the maximum nucleation driving force that was reached by a sample during cooling before nucleation occurred, with respect to both polymorphs, calculated using eqn (12) and regressed solubility data: | |  | (12) |
Table 6 Summary of cooling crystallization experiments, with the number of samples (N), the average metastable zone width with respect to saturation of Fα and the average value of RTlns at nucleation with respect to Fα given with 95% confidence limits, and the maximum driving force reached with respect to both polymorphs
|
|
|
|
|
|
|
|
RTlnsmax [kJ mol−1] |
| Series |
Solvent |
T
sat [°C] |
−dT/dt [°C h−1] |
N
|
MZW [°C] |
RTln sα,nucl [kJ mol−1] |
Fα |
Fβ |
| 1 |
Ethyl acetate |
30 |
3 |
60 |
16.9 ± 1.4 |
0.41 ± 0.02 |
0.57 |
0.68 |
| 2 |
Ethyl acetate |
20 |
3 |
60 |
18.2 ± 1.4 |
0.39 ± 0.02 |
0.49 |
0.70 |
| 3 |
Ethyl acetate |
30 |
5 |
30 |
21.3 ± 4.1 |
0.47 ± 0.05 |
0.65 |
0.84 |
| 4 |
Acetonitrile |
20 |
3 |
60 |
5.6 ± 0.4 |
0.35 ± 0.02 |
0.68 |
0.76 |
| 5 |
Acetonitrile |
15 |
3 |
60 |
5.4 ± 0.5 |
0.38 ± 0.02 |
0.59 |
0.69 |
| 6 |
Methanol |
20 |
3 |
30 |
4.6 ± 0.4 |
0.17 ± 0.01 |
0.21 |
0.22 |
| 7 |
Methanol |
15 |
3 |
30 |
4.4 ± 0.3 |
0.16 ± 0.01 |
0.20 |
0.27 |
The last approximation in eqn (12) assumes that the concentration dependence at constant T of the activity coefficient (γ) can be neglected.
In Fig. 8(a) are shown the cumulative distributions of series 1, 2 and 3, all carried out in ethyl acetate solution but differing with respect to saturation temperature and cooling rate. It can be seen that the effect of saturation temperature is weak, with distributions overlapping somewhat, whereas a faster cooling leads to a more distended distribution. In Fig. 8(b) the distributions in different solvents at equal saturation and cooling rate are compared, showing that the driving force required for nucleation increases in the order methanol < acetonitrile < ethyl acetate. In Fig. 9, the individual nucleation events are superimposed on a graph showing how the nucleation driving force for each respective polymorph increases with increasing temperature of undercooling with respect to saturation of Fα, ΔTuc (starting at the right edge and moving left). The solubility of Fβ in solvents where no data are available was estimated using the average ratio of solubilities Fβ![[thin space (1/6-em)]](https://www.rsc.org/images/entities/char_2009.gif) :
:![[thin space (1/6-em)]](https://www.rsc.org/images/entities/char_2009.gif) Fα in ethanol, 2-propanol and acetonitrile, eqn (3). The rationale for this is that the small difference in solubility between the polymorphs in the temperature range of interest in this work should lead to the influence of the activity coefficients on the solubility ratio being small.
Fα in ethanol, 2-propanol and acetonitrile, eqn (3). The rationale for this is that the small difference in solubility between the polymorphs in the temperature range of interest in this work should lead to the influence of the activity coefficients on the solubility ratio being small.
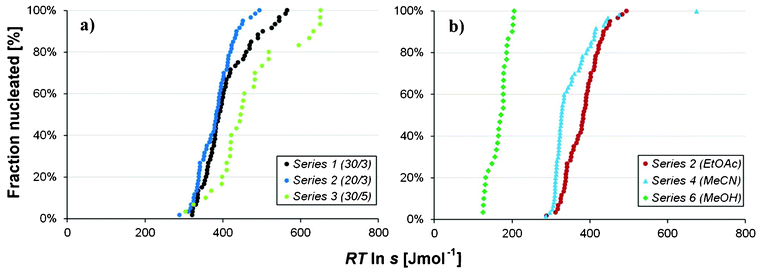 |
| | Fig. 8 Cumulative distribution of nucleations for a) series 1–3 in ethyl acetate with differing saturation temperature and cooling rate, and b) series 2, 4 and 6 in different solvents with equal saturation temperature and cooling rate. | |
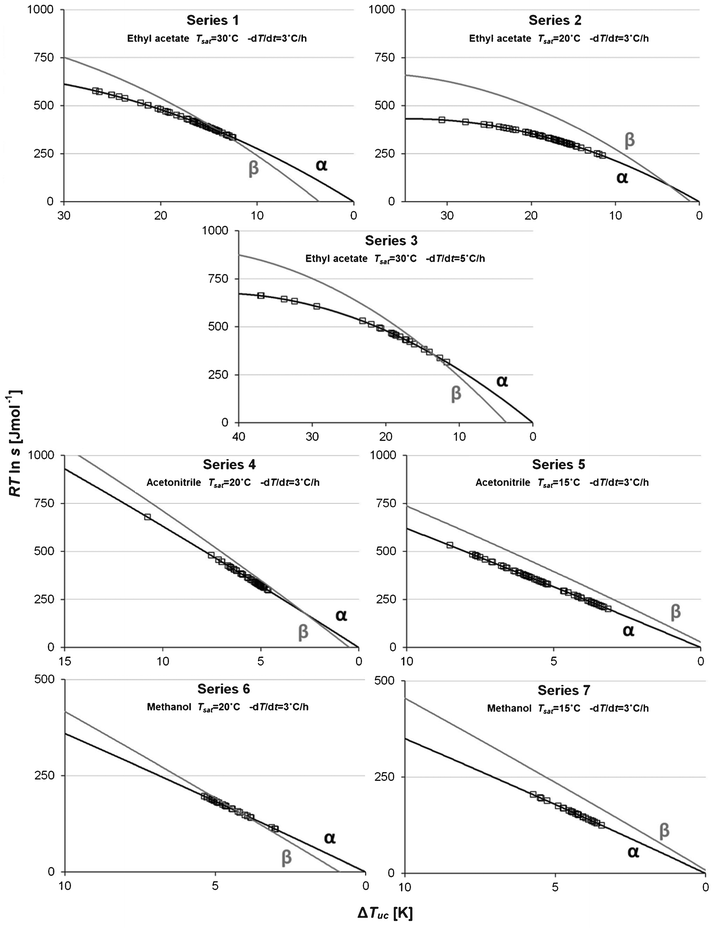 |
| | Fig. 9 Estimated driving force (solid lines) and nucleation events (squares) for Fα (black) and Fβ (grey) for each experimental series, with the temperature of undercooling on the abscissa. | |
In terms of temperature, the metastable zone is much wider in ethyl acetate than in the other two solvents, while in terms of chemical potential the difference is not as dramatic. Naturally, the reason for this behaviour is connected with the shape of the solubility curve. The average slope of the solubility curve increases in the order ethyl acetate < methanol < acetonitrile, as shown in Fig. 10. Approximating linear curves, it is found, in agreement with theory,22 that the slope shows an inverse correlation to the solubility; for methanol and ethyl acetate with the highest mole fraction solubilities the temperature dependence of the supersaturation is smallest, while it is higher in acetonitrile where the solubility is the lowest. In other words, a much bigger change in temperature is needed to reach the same driving force in ethyl acetate as in e.g. acetonitrile.
As regards cooling rate, an increase from 3 to 5 °C h−1 leads to a substantial increase in the MZW and the average driving force required for nucleation of Fα in ethyl acetate solution, and has allowed the driving force with respect to Fβ to be pushed to the highest value achieved in these experiments, viz. 0.87 kJ mol−1. This observation suggests that the time scales for conversion of clusters into crystal nuclei and for these to grow to a detectable size are of the same order as the time scale of temperature change.
Despite varying the experimental conditions to allow significant driving force with respect to nucleation of Fβ to be reached, this polymorph was not obtained at all in the nucleation experiments. In Table 6 it can be seen that the driving force at the end of the process was higher for Fβ than for Fα in all series, and in two of the series (5 and 7) the driving force with respect to nucleation of Fβ was higher than the corresponding value for Fα during the entire cooling step. It is apparent that the α-polymorph is strongly kinetically favoured in all the investigated solvents; the only way that Fβ was obtained during the course of this work without seeding was when a solution with an excess amount of crystals of Fα was cooled to −10 °C and kept at that temperature for 70 hours under agitation. In our previous work, it was shown that Fβ-seeded crystallizations in methanol would only lead to crystallization of Fβ if the cooling rate was less than 1 °C h−1, pointing to a very slow growth of this polymorph. Furthermore, it was shown that for unseeded crystallizations in ethyl acetate it is possible to obtain Fβ at a cooling rate of 3 °C h−1 for a Tsat of 15 °C, albeit with a slightly different experimental setup than in the present work. A comparison with series 2 (Tsat = 20 °C, −dT/dt = 3 °C h−1) indicates that a difference of just 5 °C in saturation temperature can have a strong impact on the polymorphic outcome.
The overall impression from Fig. 9 is that the preference of nucleation of Fα extends to either side of the transition point, i.e. Fα nucleates regardless of whether it is the stable or the metastable phase. In four of the series (2, 4, 5 and 7) all nucleations occurred below Ttr, and occasional nucleations in ethyl acetate were observed more than 20 °C below Ttr. Altogether, this suggests that simplified explanations based either on a lower nucleation energy barrier due to a lower interfacial energy for a metastable phase (nucleation of Fα below Ttr), or on a higher driving force for a stable phase (nucleation of Fα above Ttr) are insufficient. Fα appears to be favoured for reasons related to structuring and interactions in solution.
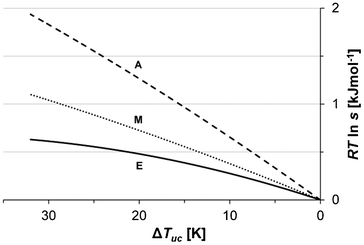
Fig. 11 shows the main structural features of Fα and Fβ; the former based on the common carboxylic dimer motif while in the latter every molecule is linked to three others through a network of hydrogen bonds. As discussed in our previous contribution,16 a reasonable starting hypothesis is that the pre-existence of dimers in the solution (a very strong23 and common24 motif for monocarboxylic acid molecules) facilitates formation of the dimer-based Fα. As shown in Fig. 13, for these three solvents the average driving force required for nucleation of Fα is well correlated to the polarity of the solvent (as measured by the Reichardt polarity parameter25ETN), decreasing with increasing solvent polarity. Furthermore, the results show some correlation to the hydrogen bond donating ability of the solvent, with the lowest driving force required for nucleation in the lone protic solvent. This might appear a bit counter-intuitive; for a dimer-based structure such as Fα we might have expected that a solvent such as methanol, which presumably interacts more strongly through hydrogen bonding with the carboxyl group of the solute, would make nucleation more difficult. However, the results actually show the opposite trend, indicating that the rate-determining step might not be the formation of dimers.
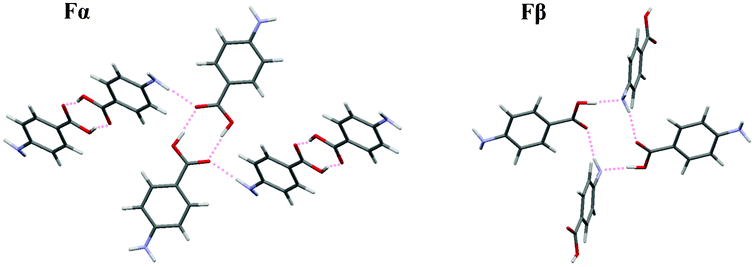 |
| | Fig. 11 Main hydrogen bonding motifs in the structures of Fα and Fβ. | |
In order to provide deeper insight into the intermolecular interactions responsible for the strong kinetic bias for Fα, the electrostatic potential around each molecule have been calculated at the MP2/6-311+(d)-level, shown for the pABA-molecule, the dimer and the three solvents in Fig. 12. In essence, the ethyl acetate molecule is significantly bigger than the other solvents, with a large part of its accessible surface being non-polar. Furthermore, only methanol is a clear hydrogen bond donating solvent, although the methyl hydrogens of acetonitrile are quite positive. All three solvent molecules are potential hydrogen bond acceptors. It is likely that these differences between the investigated solvents will influence primary nucleation of pABA, conceivably through the structuring of solvent molecules in the solvation shell and at the solid–liquid interface. The driving force for nucleation in the three solvents decreases with increasing solvent cohesive energy density25 and with increasing solvent enthalpy of vaporization.26 Methanol has the highest values of these properties, reflecting a significant degree of hydrogen bonding between the solvent molecules, which leads to a lower entropy in the liquid state and a high free energy penalty involved in changing the solvent structure to form a solvation cavity. Conversely, while ethyl acetate molecules cannot hydrogen bond with each other, they are quite capable of forming hydrogen bonds with pABA molecules.
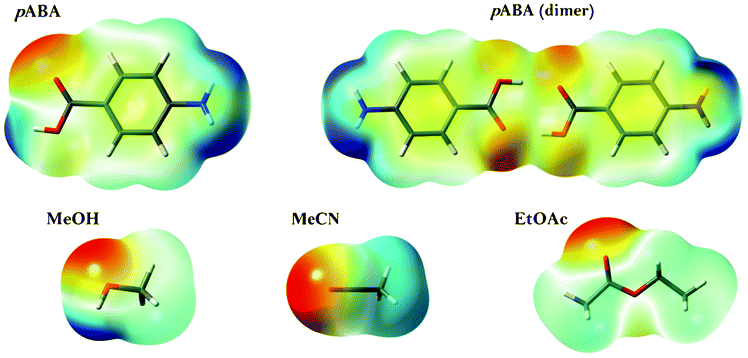 |
| | Fig. 12 Electrostatic potential mapped onto electron density isosurfaces of pABA (monomer and dimer) and the three solvent molecules. Red represents negative, green neutral and blue positive charge. | |
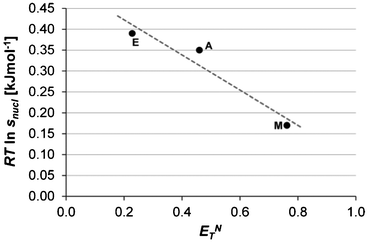 |
| | Fig. 13 Average driving force for nucleation of Fα (Tsat = 20 °C, −dT/dt = 3 °C h−1) plotted against the Reichardt polarity index (ETN) for methanol (M), acetonitrile (A) and ethyl acetate (E). | |
It has been shown27–29 for different inorganic solutes in aqueous solution that an inverse correlation between solubility and solvent–solute interfacial energy can be expected. Whether the corresponding relationship holds for the same solute in different solvents has not been established, but if the interfacial energy in different solvents decreases with increasing solubility, we should expect to find a lower nucleation energy barrier in solvents where the solubility is high. In addition to this, the higher the absolute concentration of solute molecules, the greater should be the likelihood of molecular encounters, in turn facilitating the formation and growth of nuclei. In Fig. 14 the average driving force for nucleation is plotted against the solubility (in mol m−3). It can be seen that in methanol, where the solubility is much higher than in the other solvents, the average driving force required for nucleation is lowest, while nucleation in ethyl acetate and acetonitrile where the solubility is approximately equal, requires fairly similar, but higher, driving force.
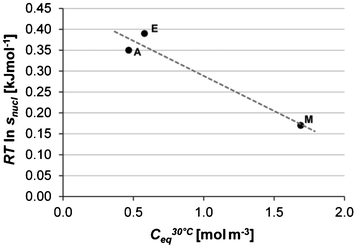 |
| | Fig. 14 Average driving force for nucleation of Fα (Tsat = 20 °C, −dT/dt = 3 °C h−1) plotted against the solubility at 30 °C for methanol (M), acetonitrile (A) and ethyl acetate (E). | |
In the determination of the temperature of visible onset of nucleation, two temperature values were recorded for each nucleating sample; the lowest temperature where no change in the solution was observable, and the highest temperature where crystals could with certainty be observed. The onset temperature of the sample was then taken as the average of the two values. Table 7 lists the average size of the uncertainty window in terms of temperature for each series of experiments.
Table 7 Average uncertainty window in estimations of onset of nucleation
| Series |
ΔTnucl [°C] |
Δ(RTlnsnucl) [J mol−1] |
| 1 |
0.21 |
4.5 |
| 2 |
0.35 |
7.6 |
| 3 |
0.57 |
12.4 |
| 4 |
0.03 |
1.7 |
| 5 |
0.09 |
5.3 |
| 6 |
0.06 |
2.2 |
| 7 |
0.04 |
1.6 |
The last column in Table 7 lists the estimated corresponding uncertainty in terms of chemical potential, computed by approximating a linear dependence between ΔTuc and RTlns. The first thing to note is that the uncertainties in temperature terms are overall fairly small. With the exception of ethyl acetate, it can safely be claimed that the visible onset of nucleation could be recorded to within a precision of at least ±0.1 °C, corresponding to an uncertainty in the determination of RTlnsnucl of less than 2%. Hence, the error introduced by approximating the actual onset of nucleation with the visible increase in turbidity should be small. Furthermore, when translating temperatures into driving force terms, because of a weaker solubility temperature dependence the disparity between ethyl acetate and the other solvents is reduced. When comparing with the average and the spread in nucleation temperatures and corresponding driving forces, the data in Table 7 suggest that growth of Fα-nuclei to visibility is rapid in these solvents. However, it is interesting to note that the growth rate of Fα in ethyl acetate, where nucleation overall is comparatively hampered, is apparently much lower than in methanol and acetonitrile. The slow crystal growth in this solvent could be an indication that the attachment frequency of molecules, to a sub-critical cluster as well as to a nascent crystal, is lower overall than in the two other solvents.
Conclusions
The mole fraction solubility of pABA in different solvents decreases in the order methanol > ethanol > acetic acid > ethyl acetate > 2-propanol > acetonitrile > 50% methanol–water. In methanol, the mole fraction solubility is less than 10% throughout the investigated temperature range. The van't Hoff curves in all solvents exhibit a non-linear temperature dependence. Based on solubility data for both polymorphs in three solvents, the enantiotropic stability transition point is estimated to be 16.1 °C. Through extrapolation of solubility data the experimentally inaccessible melting temperature of Fβ is estimated to be approximately 140 °C; significantly lower than the value for Fα. Based on thermodynamic data, the thermodynamic stability interrelationship of the two polymorphs is presented as a function of temperature from room temperature to the melting point of Fβ. At the transition temperature, the enthalpy difference between the polymorphs is 2.84 kJ mol−1 and the entropy difference is 9.80 J mol−1 K−1. At the melting temperature of Fβ, ΔG, ΔH and TΔS for the transformation Fβ → Fα amount to −1.6 kJ mol−1, 5.0 kJ mol−1 and 6.6 kJ mol−1, respectively. At room temperature, the entropic term is 3.1 kJ mol−1; a relatively high value which is an important reason for the unusually low transition temperature of this system.
The 330 nucleation experiments performed in ethyl acetate, acetonitrile and methanol, primarily resulting in nucleation below the transition temperature, have failed to produce Fβ, reaffirming that Fα is strongly kinetically favoured under a variety of different conditions. The metastable zone of Fα is found to depend chiefly on the solvent, and to be less sensitive to changes in cooling rate and saturation temperature. The average driving force required for nucleation is highest in ethyl acetate, followed by acetonitrile, and is lowest in methanol (0.39 kJ mol−1, 0.35 kJ mol−1 and 0.17 kJ mol−1, respectively, at comparable experimental conditions). Correlations are found between decreasing driving force required for nucleation and increasing solvent polarity, hydrogen-bond donating ability and solubility. An analysis of the rate of turbidity change in the different solutions has shown that the growth to visibility is rapid in ethanol and acetonitrile, where the visible onset of nucleation could be determined to within ±0.1 °C but appreciably slower in ethyl acetate.
Acknowledgements
Gratefully acknowledged is the support of the Swedish Research Council (621-2010-5391). Å.R. acknowledges the support of the Science Foundation Ireland (10/IN.1/B3038).
References
- J. W. Gibbs, Trans. Conn. Acad. Arts Sci., 1876, 3, 108 Search PubMed.
- J. W. Gibbs, Trans. Conn. Acad. Arts Sci., 1878, 16, 343 Search PubMed.
-
M. Volmer, Kinetik der Phasenbildung, Steinkopff, Dresden, 1939 Search PubMed.
- R. Becker and W. Döring, Ann. Phys., 1935, 24, 719 CAS.
- Y. B. Zeldovich, Acta Physicochim. URSS, 1943, 18, 1 Search PubMed.
- P. G. Vekilov, Cryst. Growth Des., 2010, 10, 5007 CrossRef CAS.
- J. Chen, B. Sarma, J. M. B. Evans and A. S. Myerson, Cryst. Growth Des., 2011, 11, 887 CrossRef CAS.
- S. S. Kadam, H. J. M. Kramer and J. H. ter Horst, Cryst. Growth Des., 2011, 11, 1271 CrossRef CAS.
- M. Svärd, F. L. Nordström, T. Jasnobulka and Å. C. Rasmuson, Cryst. Growth Des., 2009, 10, 195.
- P. A. Williams, C. E. Hughes, G. K. Lim, B. M. Kariuki and K. D. M. Harris, Cryst. Growth Des., 2012, 12, 3104 CrossRef CAS.
- S. Jiang, P. J. Jansens and J. H. ter Horst, Cryst. Growth Des., 2010, 10, 2123 CrossRef CAS.
- S. Jiang, P. J. Jansens and J. H. ter Horst, Cryst. Growth Des., 2010, 10, 2541 CrossRef CAS.
- S. Gracin and A. Fischer, Acta Crystallogr., Sect. E: Struct. Rep. Online, 2005, 61, o1242 CrossRef.
- T. F. Lai and R. E. Marsh, Acta Crystallogr., 1967, 22, 885 CrossRef CAS.
- L. Gopal, C. I. Jose and A. B. Biswas, Spectrochim. Acta, Part A, 1967, 23, 513 CrossRef CAS.
- S. Gracin and Å. C. Rasmuson, Cryst. Growth Des., 2004, 4, 1013 CrossRef CAS.
- S. Gracin, M. Uusi-Penttilä and Å. C. Rasmuson, Cryst. Growth Des., 2005, 5, 1787 CrossRef CAS.
- H. Hao, M. Barrett, Y. Hu, W. Su, S. Ferguson, B. Wood and B. Glennon, Org. Process Res. Dev., 2012, 16, 35 Search PubMed.
- J. Nývlt, Collect. Czech. Chem. Commun., 1984, 49, 2045 Search PubMed.
- F. L. Nordström, M. Svärd, B. Malmberg and Å. C. Rasmuson, Cryst. Growth Des., 2012, 12, 4340 Search PubMed.
- A. Gavezzotti and G. Filippini, J. Am. Chem. Soc., 1995, 117, 12299 CrossRef CAS.
- F. L. Nordström and Å. C. Rasmuson, Eur. J. Pharm. Sci., 2009, 36, 330 Search PubMed.
- A. Gavezzotti, Acta Crystallogr., Sect. B: Struct. Sci., 2008, 64, 401 CrossRef.
- L. Leiserowitz, Acta Crystallogr., Sect. B: Struct. Crystallogr. Cryst. Chem., 1976, 32, 775 CrossRef.
-
C. Reichardt, Solvents and Solvent Effects in Organic Chemistry, Wiley-VCH, Weinheim, 2003 Search PubMed.
- J. S. Chickos and W. E. Acree Jr, J. Phys. Chem. Ref. Data, 2003, 32, 519 CrossRef CAS.
- A. E. Nielsen and O. Söhnel, J. Cryst. Growth, 1971, 11, 233 CrossRef.
- P. Bennema and O. Söhnel, J. Cryst. Growth, 1990, 102, 547 Search PubMed.
- A. Mersmann, J. Cryst. Growth, 1990, 102, 841 CrossRef CAS.
|
| This journal is © The Royal Society of Chemistry 2013 |
Click here to see how this site uses Cookies. View our privacy policy here.  Open Access Article

![[thin space (1/6-em)]](https://www.rsc.org/images/entities/char_2009.gif) :
:![[thin space (1/6-em)]](https://www.rsc.org/images/entities/char_2009.gif) Fα in any solvent is by definition equal to unity. In Fig. 5 the solubility ratio is plotted for three solvents at temperatures where experimental values are available. From the figure we can read that: i) the ratio in all solvents is close to unity, as solubility values of the two polymorphs are very close (within a few per cent) in this temperature interval, and ii) the value of the ratio at each temperature is similar in the different solvents, indicating that it is acceptable as a first approximation to neglect the concentration dependence of the activity coefficients. As shown in Fig. 5, data in all three solvents indicate that the transition occurs around 290 K. A simple linear regression over all data:
Fα in any solvent is by definition equal to unity. In Fig. 5 the solubility ratio is plotted for three solvents at temperatures where experimental values are available. From the figure we can read that: i) the ratio in all solvents is close to unity, as solubility values of the two polymorphs are very close (within a few per cent) in this temperature interval, and ii) the value of the ratio at each temperature is similar in the different solvents, indicating that it is acceptable as a first approximation to neglect the concentration dependence of the activity coefficients. As shown in Fig. 5, data in all three solvents indicate that the transition occurs around 290 K. A simple linear regression over all data: 


![[thin space (1/6-em)]](https://www.rsc.org/images/entities/char_2009.gif) :
:![[thin space (1/6-em)]](https://www.rsc.org/images/entities/char_2009.gif) Fα in ethanol, 2-propanol and acetonitrile, eqn (3). The rationale for this is that the small difference in solubility between the polymorphs in the temperature range of interest in this work should lead to the influence of the activity coefficients on the solubility ratio being small.
Fα in ethanol, 2-propanol and acetonitrile, eqn (3). The rationale for this is that the small difference in solubility between the polymorphs in the temperature range of interest in this work should lead to the influence of the activity coefficients on the solubility ratio being small.

