Evaluating the non-isothermal crystallization behavior of organic molecules from the undercooled melt state using rapid heat/cool calorimetry
Jared A.
Baird
ab,
Leonard C.
Thomas
c,
Steven R.
Aubuchon
d and
Lynne S.
Taylor
*a
aDepartment of Industrial and Physical Pharmacy, School of Pharmacy, Purdue University, West Lafayette, Indiana, 47907, USA. E-mail: lstaylor@purdue.edu; Fax: +1 765 494 6545; Tel: +1 765 496 6614
bProduct Formulation Development, Allergan, Inc., Irvine, California, 92612, USA
cTechnical Advisor, TA Instruments, Inc., New Castle, Delaware, 19720, USA
dTA Instruments, Inc., New Castle, Delaware, 19720, USA
First published on 16th October 2012
Abstract
Understanding the inherent crystallization tendency of organic molecules from the undercooled melt state is an important criterion to assess the glass-forming ability of a compound, and hence the ability to produce and maintain amorphous materials, an important area for drug delivery of poorly water-soluble therapeutics. The main objective of this study was to determine the critical cooling (Rcrit,cool) and/or critical heating (Rcrit,heat) rates to inhibit crystallization for a group of compounds with diverse chemistries and different crystallization tendencies. Compounds were cooled at various cooling/heating rates using a prototype rapid heat/cool (RHC) calorimeter, and crystallization (or lack thereof) from the undercooled melt was recorded. Results showed some compounds have very high crystallization tendencies [class (I–A)] from the undercooled melt state, with Rcrit,cool rates above 1000 °C min−1, while some compounds with low crystallization tendencies upon cooling [class (II) compounds] exhibited very high crystallization tendencies (Rcrit,heat > 1000 °C min−1) upon subsequent reheating from the amorphous state. The pronounced asymmetry observed between Rcrit,cool and Rcrit,heat rates for class (II) compounds was greatly reduced by rapidly quenching the compound from the melt state, preventing the formation of quenched-in nuclei during cooling and initiating crystallization upon reheating. The ability to apply controlled rapid heating and cooling rates to organic compounds thus provides useful insight into the crystallization tendency of organic compounds.
Introduction
Organic amorphous solids are important for several technological applications including electronics,1 bio-preservation2 and drug delivery.3 With regard to the latter area, current drug discovery methods have led to the prevalence of new chemical entities with poor aqueous solubility and slow dissolution kinetics, necessitating strategies to improve the dissolution rate and/or apparent solubility for oral route dosing.4–6 Disrupting the long-range crystalline order of the compound, rendering the drug amorphous, is an attractive approach.7 To enhance the physical stability of the amorphous phase against de-vitrification to a more thermodynamically stable crystalline phase, amorphous drugs are typically blended with additives (e.g. polymers) to form an amorphous “solid dispersion”. Unfortunately, maintaining physical stability of the amorphous drug during the shelf-life of the product is still an enduring problem limiting the use of amorphous solids as a drug delivery approach.For amorphous pharmaceuticals produced via melt cooling, e.g. melt extrusion, understanding the inherent crystallization tendency of the drug from the undercooled melt state is an important criterion to assess a drug compound's suitability for an amorphous formulation. Recently,8 the crystallization tendency of various organic molecules with drug-like structures upon cooling and/or reheating from the undercooled melt state were measured and separated into three classes [class (I)—crystallized upon cooling, class (II)—crystallized upon reheating, class (III)—no crystallization upon cooling or reheating] using a conventional differential scanning calorimeter (DSC). Class (I) compounds were further delineated by their crystallization tendency during quench cooling in liquid N2, whereby class (I–A) compounds crystallized while class (I–B) compounds could be trapped in the amorphous state. For organic systems, crystallization either during cooling and/or reheating is extremely time dependent and can be potentially suppressed by employing fast scanning rates. However, due to the inability of conventional laboratory DSC instruments to cool/heat samples at controlled faster rates, in addition to the uncontrolled nature of quench cooling in liquid N2, further separation of the crystallization tendencies of compounds within these classes by measuring the critical cooling rates (Rcrit,cool) was not possible.
Thus to fully understand the crystallization behavior of these compounds, rapid cooling and/or heating rates are needed. High Performance DSC (HPer DSC or HDSC) is one fast-scanning calorimetric technique that can achieve controlled cooling/heating rates up to hundreds of degrees per minute using very small amounts (sub-milligram) of material.9,10 Due to the enhanced sensitivity of detecting the glass transition event at rapid heating rates, this technique has been extensively used to detect and quantify low levels of amorphous content in predominately crystalline systems.11,12 Another available technique is called chip calorimetry, whereby a very thin film of the sample is spin coated onto the surface of a microscopic chip containing a thermocouple and temperature sensor.13 The direct contact of the temperature and sensing components with the sample, in addition to the minimal heat transfer gradients through the sample film, enable tremendously rapid cooling/heating rates (up to 107 °C s−1) to be obtained, allowing the kinetics of materials with very fast crystallization processes to be studied.14 This technique has been used primarily in the polymeric field to study crystallization of linear polymers with very high crystallization tendencies.15,16 Recently a new DSC technique that can achieve much higher scanning rates (2000 °C min−1) than attainable by HPer DSC, known as project rapid heat/cool (RHC), has been developed.13 Preliminary studies on organic systems13,17 have shown this technique to be potentially useful to assess the crystallization kinetics of compounds from the undercooled melt state both during cooling and/or reheating, thus could be an ideal technique to further study the crystallization tendencies of organic compounds.
The purpose of this study was to determine or estimate the critical cooling (Rcrit,cool) and/or critical heating (Rcrit,heat) rates for class (I–A), class (I–B), and class (II) compounds from the undercooled melt state using both conventional and rapid heat/cool (RHC) DSC. For compounds with low crystallization tendencies upon cooling but high crystallization tendencies upon reheating, rapid cooling/heating experiments were conducted using the RHC-DSC instrument to elucidate the presence of quenched-in nuclei for these systems. A test set of eight class (I–A), seven class (I–B), and ten class (II) compounds were used for these experiments.
Materials and methods
Atenolol, benzocaine, dibucaine, lidocaine, and tolbutamide were obtained commercially from Spectrum Chemical, Gardena, CA, USA. 4-Biphenylmethanol, 4-biphenylcarboxaldehyde, acetaminophen, antipyrin, benzamide, bifonazole, chlorpropamide, cinnarizine, clofoctol, droperidol, felbinac (4-biphenylacetic acid), flufenamic acid, haloperidol, indoprofen, phenacetin (p-acetophenetidide), D(−) salicin, and tolazamide were obtained commercially from Sigma-Aldrich Inc., St. Louis, MO, USA. Carbamazepine and nifedipine was purchased from Hawkins, Inc, Minneapolis, MN, USA. Celecoxib was a kind gift from Pfizer, Inc., Groton, CT, USA.Conventional differential scanning calorimetry (DSC)
Drug crystallization during cooling and/or reheating of compounds were measured in triplicate in a previous study8 using a TA Q2000 DSC equipped with a refrigerated cooling accessory (TA Instruments, New Castle, DE, USA). The instrument was calibrated for temperature using benzophenone, indium, and tin. The enthalpic response was calibrated using indium. Nitrogen, 50 ml min−1, served as the purge gas. For the class (II) drug compounds, samples weighing approximately 3–5 mg were prepared in hermetically-sealed pans, heated at 10 °C min−1 to approximately 10 °C above the melting temperature, held isothermally for 3 minutes, cooled at a rate of 20 °C min−1 to −75 °C, and reheated at various heating rates (ranging from 10 to 200 °C min−1). The heating rate required to inhibit recrystallization upon reheating or critical heating rate (Rcrit,heat) (if observed) was recorded for each compound.Prototype rapid heat/cool differential scanning calorimetry (RHC-DSC)
Drug crystallization during very rapid cooling and/or reheating of class (I–A), (I–B), and (II) compounds was investigated using a prototype rapid heat/cool (RHC) DSC (TA Instruments, New Castle, DE, USA). The instrument was calibrated for temperature and enthalpic response by indium at heating rates spanning several orders of magnitude (10 to 1700 °C min−1). Helium, 10 ml min−1, served as the purge gas. Single crystalline particles weighing approximately 30–50 μg were loaded into specially-designed Tzero pans using a stereomicroscope, crimped, heated at 10 °C min−1 to approximately 10 °C above the melting temperature, and held isothermally for 3 minutes. For class (I–A) and (I–B) compounds, samples were then cooled at the maximum cooling rate obtainable to measure (if possible) the Rcrit,cool rates to inhibit crystallization. For class (I–B) compounds in which crystallization inhibition was observed during cooling as well as class (II) compounds, the Rcrit,heat rates to inhibit crystallization upon reheating (if possible) was measured after maximum cooling.Results
In order to expand upon the classification system created in a previous study,8 which separates the general crystallization tendency behavior of organic compounds from the undercooled melt state into classes [very high-class (I–A), high-class (I–B), moderate-class (II), low-class (III)], a more complete delineation of the relative differences in crystallization tendency for the various compounds within the same general crystallization classification is desirable. Attempts were therefore made to more accurately determine the Rcrit,cool rates to inhibit crystallization for class (I–A) and class (I–B) compounds, which readily crystallize upon cooling from the melt. For class (II) compounds, which form glasses at relatively modest cooling rates, but crystallize on reheating above the glass transition temperature, the parameter of interest was the Rcrit,heat rate, which is the heating rate necessary to inhibit crystallization on reheating through the undercooled melt regime. Physical properties of class (I–A), class (I–B), and class (II) compounds evaluated in this study are shown in Table 1.| Classification | Molecule | MW (g mol−1) | T m (°C) | T g (°C) |
|---|---|---|---|---|
| a Estimated (denoted) and measured Tg values taken from ref. 8. | ||||
| Class (I–A) | 4-Biphenylmethanol | 184.2 | 99 | −22a |
| Atenolol | 266.3 | 153 | 22a | |
| Benzamide | 121.1 | 127 | −10a | |
| Benzocaine | 165.2 | 89 | −31a | |
| Felbinac | 212.5 | 164 | 24a | |
| Haloperidol | 375.9 | 152 | 33a | |
| Lidocaine | 234.3 | 68 | −39a | |
| Phenacetin | 179.2 | 136 | 2a | |
| Class (I–B) | 4-Biphenylcarboxaldehyde | 182.2 | 59 | −50a |
| Antipyrin | 188.2 | 111 | −22 | |
| Carbamazepine | 236.3 | 192 | 61 | |
| Chlorpropamide | 276.7 | 124 | 16 | |
| Flufenamic acid | 281.2 | 135 | 17 | |
| Indoprofen | 281.3 | 212 | 50 | |
| Tolbutamide | 270.3 | 129 | 4 | |
| Class (II) | Acetaminophen | 151.2 | 170 | 24 |
| Bifonazole | 310.4 | 151 | 17 | |
| Celecoxib | 381.4 | 163 | 58 | |
| Cinnarizine | 368.5 | 121 | 7 | |
| Clofoctol | 365.3 | 88 | −4 | |
| Dibucaine | 343.5 | 68 | −39 | |
| Droperidol | 379.4 | 143 | 29 | |
| Nifedipine | 346.3 | 173 | 45 | |
| D (−) Salicin | 286.3 | 201 | 58 | |
| Tolazamide | 311.4 | 172 | 18 | |
Critical cooling rates (Rcrit,cool)
For all class (I–A) compounds, crystallization from the undercooled melt state was still observed at the maximum cooling rates obtainable in the RHC-DSC. Table 2 lists the cooling rates achieved in the RHC-DSC at the point of crystallization, and the Rcrit,cool rates are therefore higher than these values. It can be observed that even cooling rates of greater than 1000 °C min−1 were insufficient to suppress crystallization of the class (I–A) compounds, confirming their very high crystallization tendencies observed previously.8| 5 °C min−1 | 100 °C min−1 | 500 °C min−1 | Max cooling rate | ||
|---|---|---|---|---|---|
| Molecule | Undercooling (°C) | Undercooling (°C) | Undercooling (°C) | Undercooling (°C) | Max cooling rate (°C min−1) |
| a Undercooling defined as (Tm − Tcryst) as observed in DSC thermogram 5 °C min−1 cooling rate data collected on TA Q2000 from previous study.8 b Denotes class (I–B) compound. c Partial crystallization occurred during cooling. | |||||
| 4-Biphenylmethanol | 9.5 (1.8) | 12.2 | 15.1 | 17.5 (0.5) | 800 |
| Atenolol | 11.3 (0.5) | 14.4 | 20.7 | 28.8 | 1024 |
| Benzamide | 32.3 (0.3) | 28.5 | 36.5 | 42.9 | 1004 |
| Benzocaine | 31.9 (4.1) | 41.9 (4.7) | 55.2 (0.8) | 58.1 (9.9) | 815 |
| Felbinac | 10.0 (4.1) | 13.2 | 17.8 | 30.4 | 1100 |
| Haloperidol | 31.3 (2.6) | 78.8 | 90.8 | 109.9 | 913 |
| Lidocaine | 43.3 (2.9) | 39.4 (1.2) | 45.1 (1.0) | 45.5 (2.0) | 839 |
| Phenacetin | 13.5 (0.9) | 21.3 | 25.5 | 28.8 | 1026 |
| 4-Biphenylcarboxaldehydeb | 40.0 (0.3)c | 45.0c | 49.8c | 55.1c | 687 |
| Carbamazepineb | 14.9 (0.2) | 27.2 | 47.5 | 70.3 (0.8)c | 1220 |
| Indoprofenb | 13.5 (0.9) | 21.3 | 25.5 | 28.8 | 1026 |
The general crystallization behavior for class (I–A) compounds within this class is exemplified in Fig. 1a and b by phenacetin and benzamide, respectively, whereby it can be observed that increasing the cooling rate resulted in a depression to a lower temperature (but not elimination) of the observed crystallization exotherm.
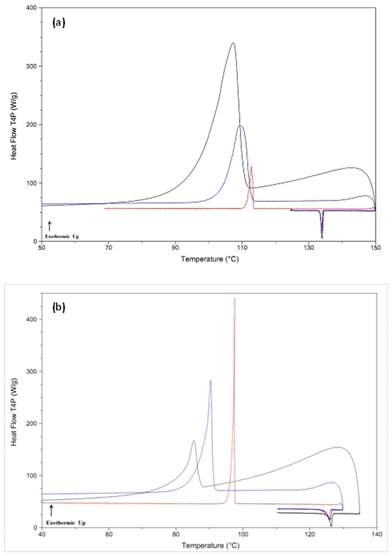 | ||
| Fig. 1 DSC thermograms for select class (I–A) compounds at different cooling rates from the melt state. Panel (a): phenacetin, panel (b): benzamide. Cooling rates (red = 100 °C min−1, blue = 500 °C min−1, black = max cooling rate (phenacetin = 1026 °C min−1, benzamide = 1004 °C min−1). The exothermic event is due to crystallization of the compound. | ||
Table 2 summarizes the degree of undercooling achieved prior to the crystallization event as a function of the cooling rate, and from the data collected two general observations can be made: first, there is a large disparity in the relative extent of undercooling achieved before crystallization occurs between the various compounds. For example, at a cooling rate of 500 °C min−1, 4-biphenylmethanol could only be cooled 15 °C below its melting point before crystallization occurred, whereas haloperidol could be undercooled by 91 °C. Second, as the cooling rate was increased, the relative change in the degree of undercooling before crystallization was observed varied significantly between the class (I–A) compounds. For instance, increasing the cooling rate by two orders of magnitude (5 °C to 500 °C min−1) decreased the crystallization temperature for 4-biphenylmethanol by only approximately 6 °C, compared to benzocaine where the crystallization temperature was depressed by approximately 23 °C. These differences also seemed to correlate with the absolute degree of undercooling achieved before crystallization occurred for a majority of the compounds, although there were some exceptions. In other words, compounds which crystallized at temperatures closer to their melting temperatures tended to have smaller changes in the extent of undercooling prior to crystallization as the cooling rate increased. Although compounds within this class crystallized during quench cooling in liquid N2 and therefore these observations were not completely unexpected, these results are important in that the controlled rapid cooling rates from the RHC-DSC gives a tangible estimate of the relative crystallization rates for these materials.
For a majority of the class (I–B) compounds, cooling from the undercooled melt state at the maximum cooling rates inhibited crystallization; however, some compounds exhibited either partial (4-biphenylcarboxaldehyde, carbamazepine) or complete (indoprofen) crystallization even at the fastest obtainable cooling rates. For compounds which did not exhibit crystallization at the maximum cooling rates (antipyrin, chlorpropamide, flufenamic acid, tolbutamide), slower cooling rates were progressively employed and it was found that crystallization was inhibited even at moderate cooling rates (25 °C min−1). Given the moderate cooling rate needed to inhibit crystallization, these compounds may be more appropriately classified as borderline class (I–B)/class (II) compounds. This is an important result as it indicates that compounds which were classified as class (I–B) actually exhibit quite different crystallization tendencies upon cooling from the melt state, with orders of magnitude difference in Rcrit,cool observed for compounds within this class; these observations were not picked up in our original study due to the limited maximum controlled cooling rate of 20 °C min−1 attainable by our conventional laboratory DSC instrument.
Interestingly, partial crystallization was observed for 4-biphenylcarboxaldehyde and carbamazepine when cooled at the maximum achievable cooling rates (687 and 1220 °C min−1, respectively), similar to that observed for chlorpropamide, flufenamic acid, and tolbutamide cooled at 20 °C min−1.8 Since the latter three drug compounds exhibited partial crystallization at a cooling rate close to their Rcrit,cool (around 25 °C min−1), it may be conjectured that the critical cooling rates for 4-biphenylcarboxaldehyde and carbamazepine are probably only slightly faster than the maximum cooling rates achieved in the RHC-DSC. This is also consistent with the observation that quenching of the melt in liquid N2 for these compounds yielded a glass.8 These results indicate that compounds classified as class (I–B) may have very different temperature dependencies of nucleation and/or growth rates, resulting in diverse crystallization tendencies from the undercooled melt state.
Since the Rcrit,cool rates for all class (I–A) as well as a few class (I–B) compounds could not be directly measured, the DSC methods established by Barandiarán & Colmenero18 (denoted BC) and Cabral19 were again evaluated as methods to indirectly estimate Rcrit,cool rates using eqn (1) and (2), respectively,
| Rcrit = exp(A) | (1) |
 | (2) |
| Molecule | A (K min−1) | B (K2) | r 2 | R crit,BC (K min−1) | R crit,cabral (K min−1) | ||
|---|---|---|---|---|---|---|---|
| a Denotes class (I–B) compound. | |||||||
| 4-Biphenylmethanol | 8. | 665 | 0.99 | 8.1 × 10³ | 8.1 × 10³ | ||
| Atenolol | 8.1 | 803 | 0.99 | 3.2 × 10³ | 3.2 × 10³ | ||
| Benzamide | r 2 < 0.55 | ||||||
| Benzocaine | 8.7 | 7264 | 0.99 | 6.2 × 10³ | 5.9 × 10³ | ||
| Felbinac | 8.0 | 768 | 0.93 | 3.0 × 10³ | 3.0 × 10³ | ||
| Haloperidol | 6.5 | 4866 | 0.89 | 6.6 × 10³ | 6.5 × 10³ | ||
| Lidocaine | r 2 < 0.55 | ||||||
| Phenacetin | 7.9 | 1170 | 0.96 | 2.7 × 10³ | 2.7 × 10³ | ||
| Indoprofena | r 2 < 0.55 | ||||||
It can be seen from the r2 values in Table 3 that, similar to the previous study, the BC and Cabral methods appear to model the crystallization data well for some compounds (r2 ≥ 0.9); however there are also some compounds (benzamide, lidocaine, indoprofen) for which the methods are clearly inappropriate (r2 < 0.55). The methods fail for these three compounds due to the fact that the degree of undercooling at the crystallization point was erratic, both increasing and decreasing with increasing cooling rate. Obviously, for these methods to be applicable, increasing the cooling rate must result in a decrease in the measured crystallization temperature. For benzamide and lidocaine, this same variability was also observed over a much smaller range of cooling rates (2 °C to 20 °C min−1), and most likely arises due to the stochastic nature of the nucleation process as well as the difficulty of avoiding heterogeneous nucleation during cooling in the DSC pans.
For the compounds in which the data could be modeled, the estimated Rcrit,cool rates (with the exception of haloperidol), shown in Table 3, were much larger than the maximum cooling rates attainable using the RHC DSC, and thus may be reasonable estimates of the actual Rcrit,cool rates to inhibit crystallization.
Furthermore, using crystallization temperatures measured over a larger range of cooling rates seems to improve the fit of the models. For example, data measured for three compounds (atenolol, benzocaine, felbinac) over a small range of cooling rates (2–20 °C min−1) resulted in very poor fits (r2 < 0.55);8 however, data collected over a larger range of cooling rates (5–800 °C min−1) gave much better fits (r2 ≥ 0.93) with reasonable Rcrit,cool estimates. However, for pharmaceutical systems, it is probably sufficient to know that if Rcritcool rates exceed 500 °C min−1, it will be difficult to render and maintain a compound amorphous; thus estimation of Rcrit,cool rates for these types of systems from the BC and Cabral methods is not needed.
Critical heating rates (Rcrit,heat)
Compounds which exhibited a low crystallization tendency upon cooling from the undercooled melt have been previously8 delineated based upon the observation of crystallization [class (II)] or lack thereof [class (III)] upon reheating from a glass back through the undercooled melt regime. To determine the critical heating rate to avoid crystallization (Rcrit,heat), class (II) compounds were reheated in both a conventional DSC as well as the RHC-DSC at various heating rates following glass formation at a cooling rate of 20 °C min−1. From Table 4, a huge variation in the crystallization tendency for class (II) compounds upon reheating through the undercooled liquid can be observed, with Rcrit,heat rates spanning several orders of magnitude. For instance, Rcrit,heat rates to inhibit crystallization for bifonazole and celecoxib were 12.5 and 15 °C min−1, respectively, after slow cooling (20 °C min−1) while for acetaminophen a very rapid heating rate of 1910 °C min−1 was insufficient to inhibit crystallization. Similar to the cooling rate experiments for class (I–A) compounds, these results give information pertaining to both the growth rates as well as the temperature dependencies of both nucleation and growth processes for these materials. Since crystallization was not observed for these compounds at slow cooling rates from the undercooled melt state, it is likely that the nucleation and growth processes do not overlap significantly as a function of temperature, and it can be surmised that crystal growth occurred only during reheating through the undercooled liquid regime.| Classification | Molecule | R crit,cool (°C min−1) | R crit,cool a (°C min−1) | R crit,cool b (°C min−1) |
|---|---|---|---|---|
| a Critical heating rate measured after slow cooling (20 °C min−1). b Critical heating rate measured after rapid cooling (max cooling rate obtainable). | ||||
| Class (I–B) | Antipyrin | 25 | >2000 | 2000 |
| Chlorpropamide | 25 | >2000 | 1000 | |
| Flufenamic acid | 25 | >1900 | >1900 | |
| Tolbutamide | 25 | >1500 | >1500 | |
| Class (II) | Acetaminophen | <1 | >1910 | >1910 |
| Bifonazole | <1 | 12.5 | <10 | |
| Celecoxib | 5 | 15 | <10 | |
| Cinnarizine | <1 | 300 | 135 | |
| Clofoctol | <1 | 400 | 200 | |
| Dibucaine | 5 | >1000 | 300 | |
| Droperidol | <1 | 175 | 125 | |
| Nifedipine | 5 | >500 | 250 | |
| D (−) Salicin | <1 | <50 | N/A | |
| Tolazamide | <1 | 35 | 30 | |
Therefore differences in observed Rcrit,heat rates can be inferred as differences in the relative nucleation and/or growth rates of these materials. Using this logic, one can see that compounds classified as class (II) compounds can have orders of magnitude differences in their relative crystallization kinetics.
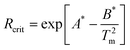
Further evaluation of Table 4 reveals a pronounced asymmetry in the Rcrit,cool rates required to inhibit crystallization upon cooling from the melt compared to the Rcrit,heat rates needed to inhibit crystallization upon reheating of the glass for both class (I–B) and class (II) compounds. For example, acetaminophen exhibits a very low crystallization tendency upon cooling from the undercooled melt state (Rcrit,cool < 1 °C min−1), however exhibits a very high crystallization tendency upon reheating of the glass (Rcrit,heat > 1910 °C min−1), a difference of over 3 orders of magnitude. Interestingly, many of the other compounds listed in Table 4 showed a similar trend. This asymmetry in Rcrit,cool and Rcrit,heat rates is further illustrated in Fig. 2a and b for flufenamic acid, a class (I–B) compound. Fig. 2a shows the absence of crystallization for this compound at a cooling rate of 25 °C min−1 as well as the presence of a glass transition event upon reheating, indicating that a glassy material was formed during cooling from the melt state. Fig. 2b depicts the asymmetry in the Rcrit,heat rate for this compound, whereby crystallization was still observed at the fastest obtainable heating rate (1900 °C min−1) after being rapidly cooled in the RHC calorimeter (1025 °C min−1). Similar asymmetries between Rcrit,cool and Rcrit,heat rates have been observed experimentally in inorganic bulk metallic glass-forming systems,20 however to the best of the authors' knowledge this is the first such reported observations for organic systems.
 | ||
| Fig. 2 DSC thermograms for flufenamic acid, a class (I–B) compound. Panel (a): cooling rate of 25 °C min−1, illustrating the critical cooling rate to inhibit crystallization during cooling. Panel (b): rapid cooling (1025 °C min−1) and subsequent rapid reheating (1900 °C min−1), illustrating that the critical heating rate to prevent re-crystallization during the heating stage is faster than the employed heating rate of 1900 °C min−1. | ||
R crit,heat rates following cooling at different rates
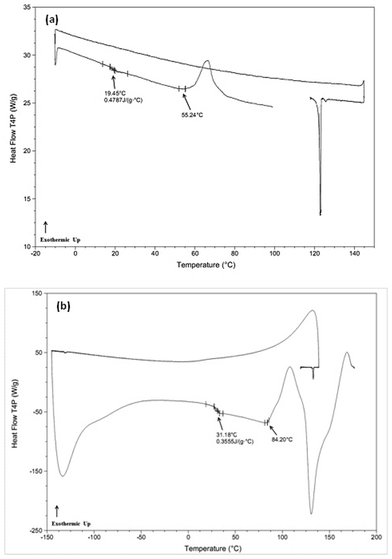
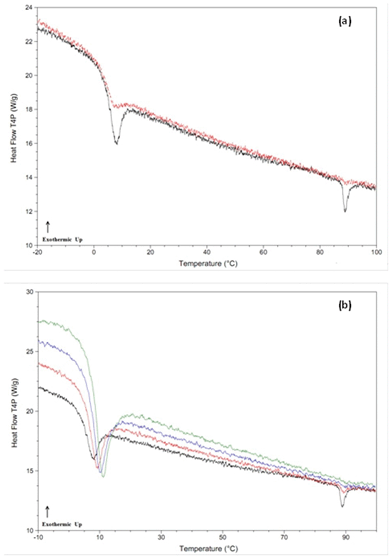
It has been suggested previously, that if the cooling rate is faster than the critical rate for crystallization, but slower than the critical nucleation rate, then glasses containing quenched-in nuclei can be formed.21 It was further suggested that class (II) compounds de-vitrified on heating in part due to the presence of such quenched-in nuclei.8 In order to further probe this issue, a variety of experiments with different cooling and heating rates were conducted. In particular, Rcrit,heat rates were determined following cooling at the maximum attainable cooling rate. Table 4 shows that when the cooling rate was increased from 20 °C min−1 to the maximum possible experimental rate (>500 °C min−1 in all cases, see Table 2), for many compounds, Rcrit,heat was reduced, suggesting a reduction in the number of nuclei formed. For example, dibucaine (Fig. 3a and b) recrystallized even when heated at 1000 °C min−1 after moderate cooling (20 °C min−1); however a heating rate of 300 °C min−1 was sufficient to inhibit recrystallization after quench cooling (800 °C min−1). This asymmetry can also be seen by comparing the reheating thermograms for clofoctol at a constant heating rate (200 °C min−1) after both moderate (20 °C min−1) and quench (860 °C min−1) cooling from the melt state (Fig. 4a).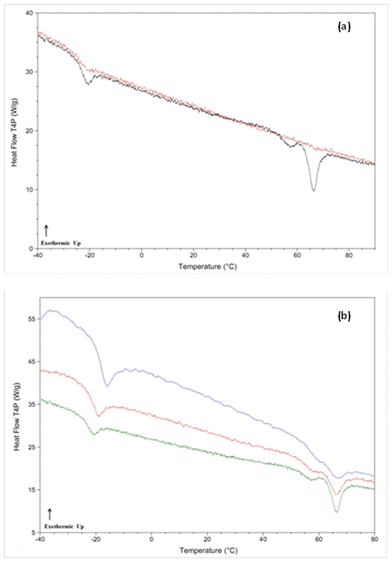 | ||
| Fig. 3 DSC thermograms for dibucaine, a class (II) compound. Panel (a): thermogram after cooling from the melt state (black = 20 °C min−1, red = 800 °C min−1) and reheated at a rate of 300 °C min−1. Panel (b): thermograms after cooling from the melt state (20 °C min−1) and reheated at various rates (green = 300 °C min−1, red = 500 °C min−1, blue = 1000 °C min−1). | ||
 | ||
| Fig. 4 DSC thermograms for clofoctol, a class (II) compound. Panel (a): thermogram after cooling from the melt state (black = 20 °C min−1, red = 860 °C min−1) and reheated at a rate of 200 °C min−1. Panel (b): thermograms after cooling from the melt state (20 °C min−1) and reheated at various rates (black = 200 °C min−1, red = 300 °C min−1, blue = 400 °C min−1, green = 500 °C min−1). | ||
After moderate cooling, the presence of some recrystallized material was observed upon reheating, as indicated by the presence of a small endotherm at the melting temperature; however this melting endotherm was absent during reheating following rapid cooling in the calorimeter.
To demonstrate that the recrystallization observed for clofoctol occurred during the reheating step rather than during cooling, samples were cooled from the melt state at a constant rate (20 °C min−1) and reheated at varying rates. The results are shown in Fig. 4b, whereby increasing the heating rate from 200 °C min−1 to 500 °C min−1 completely eliminates the melting endotherm. Assuming that the same number of nuclei formed in each sample during constant cooling, the results confirm that crystallization occurred during the reheating step for clofoctol and is most likely linked to the presence of quenched-in nuclei. These observed decreases in asymmetry between Rcrit,cool and Rcrit,heat rates upon quench cooling rather than slow cooling from the melt state for some class (II) compounds strongly suggests that quenched-in nuclei are generated during the slower cooling rates for these systems. As an aside, the Rcrit,heat rates for bifonazole and celecoxib were both less than 10 °C min−1 after quench cooling. Since compounds were delineated as either class (II) or class (III) based upon the presence/absence of crystallization at a heating rate of 10 °C min−1, this indicates that both bifonazole and celecoxib are borderline class (II)/class (III) compounds depending on the cooling rate employed from the melt state.
Discussion
Crystallization is a complex process dependent on two separate but inter-dependent steps; nucleation followed by crystal growth, each of which have their own relative rates as well as temperature dependencies below the melting temperature. Thus for class (I–A) compounds, the observation of crystallization at the fastest obtainable cooling rates indicate that these compounds all have very rapid nucleation and/or growth rates which overlap significantly as a function of temperature, as depicted schematically in Fig. 5a. Hence as the temperature of these systems reach a region where the nucleation rate for the material is high, the growth rate for these compounds are sufficiently fast enough to result in rapid growth of nuclei resulting in crystallization being observed. Interestingly, differences in the extent of undercooling observed before crystallization occurred for some compounds suggest that there are differences in the temperature dependencies of both nucleation and growth rates below the melting temperature.![Schematic illustration of the possible relative nucleation and growth rate temperature dependencies in the undercooled melt regime for compounds with very high crystallization tendencies upon cooling [class (I–A), panel (a)] and compounds with low crystallization tendencies upon cooling, but high crystallization tendencies upon reheating [class (I–B), class (II), panel (b)].](/image/article/2013/CE/c2ce26448j/c2ce26448j-f5.gif) | ||
| Fig. 5 Schematic illustration of the possible relative nucleation and growth rate temperature dependencies in the undercooled melt regime for compounds with very high crystallization tendencies upon cooling [class (I–A), panel (a)] and compounds with low crystallization tendencies upon cooling, but high crystallization tendencies upon reheating [class (I–B), class (II), panel (b)]. | ||
For example, at a cooling rate of 5 °C min−1 4-biphenylmethanol crystallized at a degree of undercooling ≈ 9.5 °C, while benzocaine crystallized at a degree of undercooling ≈ 31.9 °C at the same cooling rate. Thus for these two compounds it can be surmised that at a degree of undercooling of ≈ 9.5 °C the relative nucleation and/or growth rates for 4-biphenylmethanol are significantly higher than those for benzocaine, resulting in crystallization being observed at a lower degree of undercooling for the former compound.
For compounds in which crystallization can be inhibited upon cooling from the undercooled melt state [class (I–B), class (II)], making inferences about the temperature dependencies of the nucleation and growth processes as well as their relative rates is more challenging. Fortunately, the Rcrit,heat rates and the observed asymmetry between Rcrit,cool and Rcrit,heat rates gives valuable information pertaining to the relative temperature dependencies of the nucleation and growth processes as well as their relative rates. For example, assuming the nucleation and growth rate curves overlap significantly for class (I–B) and class (II) compounds similar to Fig. 5a, for crystallization to be inhibited at modest cooling rates either the nucleation rate and/or the growth rates must be sufficiently low enough that crystallization does not occur. Furthermore, one would not expect a large asymmetry between Rcrit,cool and Rcrit,heat rates since the nucleation and growth processes overlap as a function of temperature. However, this scenario was not observed experimentally, whereby Rcrit,heat rates were much higher than Rcrit,cool rates, indicating that compared to class (I–A) compounds, the overlap between the nucleation and growth rate curves occurs to a lesser extent for class (I–B) compounds and is minimal for some class (II) compounds, as illustrated schematically for class (II) drugs in Fig. 5b.
In fact, a minimal overlap in nucleation and growth processes as a function of temperature (as illustrated in Fig. 5b) can account for the formation of quenched-in nuclei during cooling and subsequent asymmetry between Rcrit,cool and Rcrit,heat rates observed. This can be rationalized by considering a scenario for a material with a Rcrit,cool rate of X °C min−1: cooling from the melt through the glass transition temperature (Tg) at a rate of X °C min−1 and subsequent reheating from the amorphous glass back through the melting temperature at a rate of X °C min−1. Assuming that the nucleation rate maximum occurs at a considerably lower temperature compared to the maximum growth rate (Fig. 5b), as the material is cooled from the melting temperature it will pass through a temperature region where the crystalline growth rate is maximum, however the nucleation rate is relatively low and thus few nuclei are formed. Upon further cooling, the material enters a temperature regime where the nucleation rate is maximum resulting in the formation of nuclei. However, these nuclei are in a temperature regime where the growth rate is sufficiently low and the viscosity of the undercooled melt is high, thus minimal growth of these nuclei occurs and crystallization is not observed. As the amorphous glass (containing quenched-in nuclei) is heated at a rate of X °C min−1 from the glassy state, the material again passes through the temperature regime where the nucleation rate is high and growth rate is low, resulting in the further formation of nuclei with minimal growth of these nuclei. Upon further reheating these nuclei enter a temperature regime where the growth rate is high and the viscosity of the undercooled melt is lower, hence the heating rate of X °C min−1 is not fast enough to prevent growth of these nuclei, resulting in crystallization being observed. Assuming steady-state nucleation occurs during both cooling and heating, the same number of nuclei are formed during both cooling and reheating; however, an asymmetry in the Rcrit,cool and Rcrit,heat rates is observed due to the nuclei formed during reheating being exposed to higher growth rates than the nuclei formed during cooling.
Considering the effect of cooling rate on Rcrit,heat rates gives further evidence for the presence of quenched-in nuclei. Although it is well known that cooling rate alone can change the properties of a glassy solid, which could affect the de-vitrification tendency of the amorphous material below Tg,22 heating the material back through the glass transition temperature should in principle erase any thermal history from the cooling step. Thus if nuclei do not form on cooling and become trapped in the amorphous glass, cooling rate alone should have no effect on the crystallization tendency of the material upon reheating through the undercooled liquid regime; however this outcome was not observed experimentally. By rapidly cooling from the melt state, the system spends very little time in the undercooled melt regime before crossing into the glassy state and therefore minimizes the probability of nuclei formation during the cooling step. Assuming rapid cooling produces an amorphous glass free of quenched-in nuclei, for crystallization to occur during reheating, nuclei must first form and then grow to a detectable limit. This is compared to reheating of a glass containing quenched-in nuclei, whereby only growth of nuclei is required for crystallization to occur. Thus the Rcrit,heat rates after both moderate and quench cooling give information pertaining to the relative nucleation and growth rates of the material.
Conclusions
In this study, the crystallization tendency of a variety of organic molecules during rapid cooling and heating has been assessed using differential scanning calorimetry. Rapid cooling experiments showed that class (I–A) compounds have very high crystallization tendencies upon cooling from the undercooled melt state, with cooling rates of over 1000 °C min−1 failing to prevent crystallization. Class (I–A) molecules, which tend to be lower molecular weight compounds with simple structures, are thus poor glass formers. While class (I–B) and class (II) compounds formed glasses when cooled at adequate rates, there is evidence for the presence of quenched-in nuclei formed during cooling, which likely contribute to their very high crystallization tendencies upon even very rapid reheating from the glassy state. Thus class (I–B) and class (II) compounds may form glasses that have a high tendency to crystallize during storage due to the presence of crystal nuclei, formed during cooling. Thus this study highlights that in-depth evaluation of a drug compound's inherent crystallization tendency, using tools such as thermal analysis, is critical to understand the likelihood of an amorphous drug delivery formulation remaining stable against crystallization over time. In addition, the results show that rapid heat/cool (RHC) DSC in combination with traditional DSC, can be valuable tools to investigate the crystallization tendency of new chemical entities in early drug development, thus allowing more informed decisions to be made regarding formulation development.Acknowledgements
Niraj Trasi is acknowledged for preparing and running confirmation samples on the RHC unit at TA Instruments. The authors would like to thank the National Science Foundation Engineering Research Center for Structured Organic Particulate Systems (NSF ERC-SOPS) (EEC-0540855) for financial support. This work was funded in part by a grant from the Lilly Endowment, Inc, to Purdue University College of Pharmacy. The American Foundation for Pharmaceutical Education (AFPE) is acknowledged for a fellowship to JAB. The Purdue Graduate School is acknowledged for the Ross fellowship to JAB.References
- K. Nomura, H. Ohta, A. Takagi, T. Kamiya, M. Hirano and H. Hosono, Nature, 2004, 432, 488–492 CrossRef CAS.
- K. Fox, Science, 1995, 267, 1922 CrossRef CAS.
- A. M. Kaushal, P. Gupta and A. K. Bansal, Crit. Rev. Ther. Drug Carrier Syst., 2004, 21, 133–193 CrossRef CAS.
- C. A. Lipinski, F. Lombardo, B. W. Dominy and P. J. Feeney, Adv. Drug Delivery Rev., 1997, 23, 3–25 CrossRef.
- C. A. Lipinski, J. Pharmacol. Toxicol. Methods, 2000, 44, 235–249 CrossRef CAS.
- A. Fahr and X. Liu, Expert Opin. Drug Delivery, 2007, 4, 403–416 Search PubMed.
- T. Vasconcelos, B. Sarmento and P. Costa, Drug Discovery Today, 2007, 12, 1068–1075 CrossRef CAS.
- J. A. Baird, B. van Eerdenbrugh and L. S. Taylor, J. Pharm. Sci., 99, 3787–3806 Search PubMed.
- T. F. J. Pijpers, V. B. F. Mathot, B. Goderis, R. L. Scherrenberg and E. W. van der Vegte, Macromolecules, 2002, 35, 3601–3613 CrossRef.
- V. B. F. Mathot, G. V. Poel and T. F. J. Pijpers, Am. Lab., 2006, 38, 21–25 Search PubMed.
- M. Saunders, K. Podluii, S. Shergill, G. Buckton and P. Royall, Int. J. Pharm., 2004, 274, 35–40 Search PubMed.
- M. Lappalainen, I. Pitkanen and P. Harjunen, Int. J. Pharm., 2006, 307, 150–155 Search PubMed.
- R. L. Danley, P. A. Caulfield and S. R. Aubuchon, Am. Lab., 2008, 40, 9–11 CAS.
- M. Y. Efremov, E. A. Olson, M. Zhang, S. L. Lai, F. Schiettekatte and Z. S. Zhang ad L. H. Allen, Thermochim. Acta, 2004, 412, 13–23 CrossRef.
- A. Gradys, P. Sajkiewicz, A. A. Minakov, S. Admovsky, C. Schick, T. Hashimoto and K. Saijo, Mater. Sci. Eng., A, 2005, 413, 442–446 Search PubMed.
- S. Guns, P. Kayaert, J. A. Martens, J. van Humbeeck, V. Mathot, T. Pijpers, E. Zhuravlev, C. Schick and G. van den Mooter, Eur. J. Pharm. Biopharm., 2010, 74, 239–247 Search PubMed.
- S. Gaisford, Eur. Biopharm. Rev., 2008, 13, 83–89 Search PubMed.
- J. M. Barandiaran and J. Colmenero, J. Non-Cryst. Solids, 1981, 46, 277–287 Search PubMed.
- A. A. Cabral, A. A. D. Cardoso and E. D. Zanotto, J. Non-Cryst. Solids, 2003, 320, 1–8 CrossRef CAS.
- J. Schroers, A. Masuhr, W. L. Johnson and R. Busch, Phys. Rev. B: Condens. Matter, 1999, 60, 11855–11858 CrossRef CAS.
- C. A. Angell, MRS Bull., 2008, 33, 544–555 CAS.
- L. Yu, Adv. Drug Delivery Rev., 2001, 48, 27–42 CrossRef CAS.
| This journal is © The Royal Society of Chemistry 2013 |