 Open Access Article
Creative Commons Attribution 3.0 Unported Licence
Tuning CO2 electroreduction efficiency at Pd shells on Au nanocores†
Daniela Planaa, Jonathan Flórez-Montañob, Veronica Celorrioa, Elena Pastor*b and David J. Fermín*a
aSchool of Chemistry, University of Bristol, Cantocks Close, Bristol BS8 1TS, UK. E-mail: david.fermin@bristol.ac.uk; Tel: +44 (0)117 928981
bUniversidad de La Laguna, Dpto. de Química-Física, Instituto de Materiales y Nanotecnología, Avda. Astrofísico Francisco Sánchez s/n, 38071 La Laguna, Spain. E-mail: epastor@ull.es; Tel: +34 92 2318028
First published on 14th October 2013
Abstract
The faradaic efficiency of CO2 electroreduction is significantly affected by the thickness of Pd nanoshells on Au cores. The ratio of hydrogen evolution to CO2 reduction was determined by differential electrochemical mass spectrometry. Decreasing the Pd shell thickness from 10 to 1 nm leads to a twofold increase in faradaic efficiency.
It is estimated that chemical transformation of carbon dioxide, such as thermo- and electrocatalysis, can reduce CO2 emissions by 5 to 10%.1 The electrochemical reduction of CO2 has attracted considerable attention, particularly using electrodes with high overpotentials for hydrogen evolution, with special emphasis on copper.2–7 Recent studies have shown that the efficiency can be affected by the presence of copper oxide8 or the stabilisation of intermediates by the use of molecular systems.9,10 The mechanisms involved and product selectivity remain to be fully resolved, however. An important limitation is the low solubility of CO2 in aqueous systems, which leads to slow reduction rates and small molecules as products;11,12 the use of nanostructured carbon supports for catalytic metallic centres has been suggested to increase local CO2 concentration.12,13
Materials with low hydrogen overpotentials, such as Pt or Pd, have been studied more scarcely, mainly due to the loss of efficiency produced by hydrogen evolution and the self-poisoning phenomena by CO adsorption observed on Pt surfaces. In contrast to other electrocatalytic applications, Pd and Pt have exhibited significantly different behaviour towards CO2 reduction,11,14,15 due to differing interactions with adsorbed intermediates, such as COads or COOHads, and the presence of absorbed hydrogen in Pd.14,16,17 On Pd, CO and formic acid have been reported as products at low overpotentials, while a range of alkanes from methane to hexane have been observed at higher potentials.18,19
The faradaic efficiency for CO2 reduction is limited by the rate of the hydrogen evolution reaction (HOR); a process reported to be affected by the thickness of Pd overlayers on Au substrates.20,21 In this communication, we show for the first time an acute thickness dependence of the CO2 electroreduction faradaic efficiency at Au–Pd core–shell nanostructures, with values above 90% for shells with thickness of the order of 1 nm. The faradaic efficiency is determined by quantitative analysis of hydrogen generation employing differential electrochemical mass spectrometry (DEMS). The thickness dependence of the effective lattice strain of Pd nanoshells on Au cores and its correlation with hydrogen adsorption–absorption properties, CO tolerance and catalytic activity towards HCOOH oxidation have been investigated in detailed in previous reports.22–25 Our results clearly show a delicate balance between the adsorption of CO2 electroreduction intermediates and the rate of HOR.
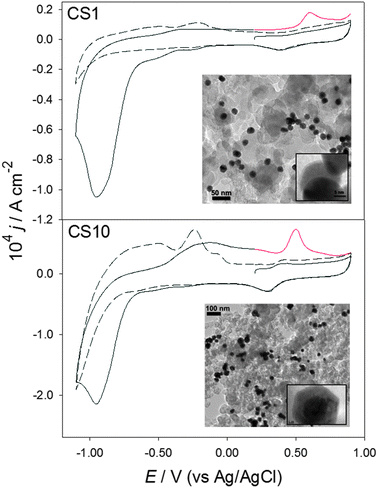
The preparation and characterisation of the electrocatalysts have been previously described22,24–26 and are summarised in the ESI.† TEM images of the catalysts are shown as insets in Fig. 1. Au–Pd core–shell nanoparticles of 1.3 and 9.9 ± 1.0 nm shell thickness (CS1 and CS10, respectively) on 19.3 ± 1.0 nm diameter cores were prepared and used to study the influence of Pd thickness on the electrochemical reduction of CO2. They were attached on carbon supports aiming for an approximate metal loading of 20% (21.1 and 20.2 ± 2.0% for CS1 and CS10, respectively). The effective Pd surface area, used for normalising current responses, was determined in each catalyst by the charge associated with electro-oxidation of a CO monolayer in acid solution (see ESI†).
 | ||
| Fig. 1 Cyclic voltammograms at 20 mV s−1 in pH 4 0.1 M Na2SO4, on Vulcan-supported CS1 and CS10 nanostructures. The dashed lines were performed in Ar-saturated solutions; the full black and red lines show the first and partial second scans in CO2-saturated solutions, respectively. | ||
Fig. 1 shows cyclic voltammograms in CO2 (full black line) and Ar-saturated (dashed lines) solutions, using CS1 and CS10 supported catalysts. Responses associated with Pd oxide formation and reduction are clearly seen at positive potentials in the absence of CO2. At negative potentials, signals related to the adsorption, absorption and evolution of hydrogen can be observed in the negative going scan, while hydrogen oxidation and desorption are evident on the positive direction. The hydrogen response is significantly larger on the thicker Pd shells (CS10), in agreement with previous studies.22,25 Upon saturation with CO2 (full black lines), the Pd oxide signals remain the same, however, a large cathodic current starts at approximately −0.60 V, with a peak observed at −0.95 V (all potentials are quoted versus Ag/AgCl). At the peak, the current density is almost an order of magnitude higher than in the absence of CO2. Two pre-peaks can be seen starting just negative of −0.10 V, particularly on the CS1 sample. The cathodic currents are indicative of CO2 reduction catalysed by the bi-metallic nanostructures (voltammograms in the absence of metal particles show negligible currents); reduction of CO2 has been previously observed at similar potentials on bulk Pd surfaces.15,17
Upon reversing the scan, the oxidation and desorption of hydrogen are much less significant than in the Ar-saturated solutions, indicating that either hydrogen takes part in CO2 reduction or that the adsorption sites were blocked by CO2 or intermediates/products. Additionally, a prominent peak can be seen in the region of Pd oxide formation; this last is due to the oxidation of adsorbed intermediates formed during the reduction of carbon dioxide. The signal has similar shape and appears at the potentials expected for the electro-oxidation of COads to CO2 on this type of catalysts (at the onset of Pd oxide formation, roughly 200 mV more positive than the Pd oxide reduction peak).24 This response has been ascribed to bridge-bonded CO on Pd bulk surfaces and has recently been reported at thin Pd films on Au substrates.15,27 The current densities of this peak, as well as that of CO2 reduction (−0.95 V), are approximately double for CS10 in comparison to CS1.
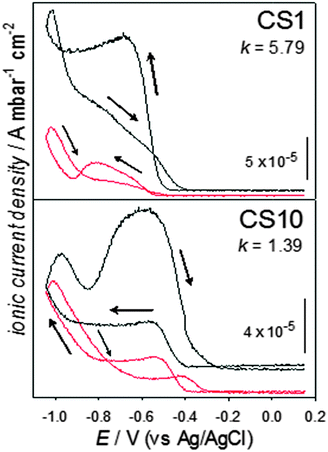
Fig. 2 shows the ionic current density for hydrogen (m/z = 2), on CS1 and CS10. Mass spectrometer constant values (k) for the HOR in each catalyst in the set-up used are also presented; their determination is detailed in the ESI.† In the absence of CO2 (black curves), an initially flat signal begins to rise at potentials close to −0.40 V, with a sharp increase at potentials more negative than −0.80 V, consistent with the electrochemical hydrogen contributions in Fig. 1. Upon scan reversal, clear differences are apparent. For CS1, hydrogen production continues increasing during the first 50 mV and then slowly diminishes with a change in the slope of decrease around −0.90 V, before the signal returns to its original level. For CS10, hydrogen production increases developing a peak at 0.95 V and then a broad contribution around 0.60 V, finally achieving the background level. This second contribution, which is only apparent for the thicker Pd shells, is likely due to hydrogen absorbed in the Pd lattice being expelled.
 | ||
| Fig. 2 Mass spectrometric cyclic voltammograms, for the m/z = 2 signal, at 5 mV s−1, in Ar- or CO2-saturated solutions (black and red curves, respectively) using Vulcan-supported CS1 and CS10 nanostructures. | ||
Significant differences can be observed in the presence of CO2, clearly indicating that hydrogen processes are affected by the presence and reaction of carbon dioxide. The most notable change is seen in the back scan, where the hydrogen signal sharply decreases in the presence of CO2. Electrochemical and infrared spectroscopy studies on bulk Pd, have suggested that absorbed hydrogen takes part in CO2 electroreduction, producing molecules such as HCOOH.14,16
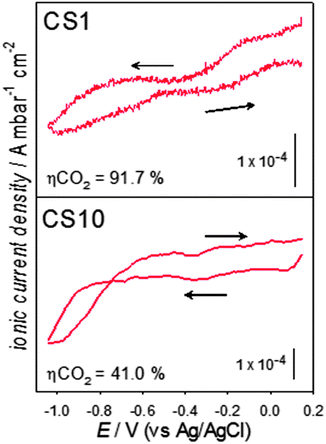
Fig. 3 shows the signal with a charge to mass ratio of 44, indicative of carbon dioxide. A high background signal is obtained on both catalysts, as the system is saturated with CO2. A decrease in the CO2 background signal become noticeable from potentials more negative than −0.65 V, which is consistent with onset of CO2 reduction in Fig. 1 for both samples. It is interesting to note that the current responses between −0.2 and −0.5 V for CS1 (Fig. 1) coincides with a decrease in the CO2 ionic current (Fig. 3), confirming a lower overpotential for the electroreduction at the CS1 nanostructures.
 | ||
| Fig. 3 Mass spectrometric cyclic voltammograms, for the m/z = 44 signal, at 5 mV s−1, in CO2-saturated solutions on the CS1 and CS10 catalysts. | ||
The faradaic efficiency for CO2 reduction (ηCO2), as estimated from integration of the faradaic and ionic current (m/z = 2) densities are also indicated in Fig. 3. As discussed in the ESI,† quantitative estimations can be achieved employing the hydrogen signal due to its low background signal and strong potential dependence. On the present conditions, CS1 exhibits a remarkable ηCO2 above 90% in comparison to the ca. 40% observed for CS10. Careful analysis of the trends in Fig. 2 and Fig. S1 (ESI†) suggests the high faradaic efficiency of CS1 particles is related to a strong inhibition of the HOR in the presence of CO2 rather than higher CO2 conversion turn-over rate. Similar efficiencies have been obtained employing potential steps at −0.90 and −1.05 V over a timescale of 300 s.
In summary, a remarkable thickness dependence of the faradaic efficiency for CO2 electroreduction at Pd nanoshells on Au cores is reported for the first time. Electrochemical and DEMS responses clearly show that the CS1 catalyst exhibits lower overpotential for CO2 reduction than CS10. Quantitative analysis of DEMS responses for m/z = 2 indicate that hydrogen absorption and evolution play a fundamental role in the contrasting reactivity of the Pd nanoshells. A key descriptor in this system is the effective lattice strain of the Pd shell, which decreases from 3.5 to less than 1% upon increasing the Pd thickness from ca. 1 to 10 nm.20 For instance, this decrease in lattice strain is responsible for a three-fold increase in the average CO coverage at the Pd shells.19,21 We believe this trend is responsible for the lower COads oxidation current density observed for CS1 in Fig. 1. In this respect, a recent study using Cu overlayers on Pt has shown that lattice strain has a significant effect on carbon dioxide reactivity and selectivity.28
The authors thank Dr M. G. Montes de Oca, J. Stephenson and J. A. Jones for their contributions to this project. We acknowledge EPSRC (EP/H046305/1) and Spanish MINECO (CTQ2011-28913-C02-02) for financial support.
Notes and references
- M. Aresta and A. Dibenedetto, Catal. Today, 2004, 98, 455–462 CrossRef CAS PubMed.
- Y. Hori, O. Koga, H. Yamazaki and T. Matsuo, Electrochim. Acta, 1995, 40, 2617–2622 CrossRef CAS.
- I. Takahashi, O. Koga, N. Hoshi and Y. Hori, J. Electroanal. Chem., 2002, 533, 135–143 CrossRef CAS.
- Y. Hori, H. Konishi, T. Futamura, A. Murata, O. Koga, H. Sakurai and K. Oguma, Electrochim. Acta, 2005, 50, 5354–5369 CrossRef CAS PubMed.
- K. J. P. Schouten, Y. Kwon, C. J. M. van der Ham, Z. Qin and M. T. M. Koper, Chem. Sci., 2011, 2, 1902–1909 RSC.
- R. Kortlever, K. H. Tan, Y. Kwon and M. T. M. Koper, J. Solid State Electrochem., 2013, 17, 1843–1849 CrossRef CAS PubMed.
- K. P. Kuhl, E. R. Cave, D. N. Abram and T. F. Jaramillo, Energy Environ. Sci., 2012, 5, 7050–7059 CAS.
- C. W. Li and M. W. Kanan, J. Am. Chem. Soc., 2012, 134, 7231–7234 CrossRef CAS PubMed.
- B. A. Rosen, A. Salehi-Khojin, M. R. Thorson, W. Zhu, D. T. Whipple, P. J. A. Kenis and R. I. Masel, Science, 2011, 334, 643–644 CrossRef CAS PubMed.
- J. A. Keith and E. A. Carter, Chem. Sci., 2013, 4, 1490–1496 RSC.
- M. Spichiger-Ulmann and J. Augustynski, J. Chem. Soc., Faraday Trans. 1, 1985, 81, 713–716 RSC.
- G. Centi and S. Perathoner, Top. Catal., 2009, 52, 948–961 CrossRef CAS.
- S. Perez-Rodriguez, G. Garcia, L. Calvillo, V. Celorrio, E. Pastor and M. J. Lazaro, Int. J. Electrochem., 2011, 249804 Search PubMed.
- N. Hoshi, M. Noma, T. Suzuki and Y. Hori, J. Electroanal. Chem., 1997, 421, 15–18 CrossRef CAS.
- S. Taguchi, A. Aramata and M. Enyo, J. Electroanal. Chem., 1994, 372, 161–169 CrossRef CAS.
- K. Ohkawa, K. Hashimoto, A. Fujishima, Y. Noguchi and S. Nakayama, J. Electroanal. Chem., 1993, 345, 445–456 CrossRef CAS.
- D. Kolbe and W. Vielstich, Electrochim. Acta, 1996, 41, 2457–2460 CrossRef CAS.
- B. I. Podlovchenko, E. A. Kolyadko and S. G. Lu, J. Electroanal. Chem., 1994, 373, 185–187 CrossRef CAS.
- M. Azuma, K. Hashimoto, M. Watanabe and T. Sakata, J. Electroanal. Chem., 1990, 294, 299–303 CrossRef CAS.
- A. Bonnefont, A. N. Simonov, S. N. Pronkin, E. Y. Gerasimov, P. A. Pyrjaev, V. N. Parmon and E. R. Savinova, Catal. Today, 2013, 202, 70–78 CrossRef CAS PubMed.
- P. Quaino, E. Santos, H. Wolfschmidt, M. A. Montero and U. Stimming, Catal. Today, 2011, 177, 55–63 CrossRef CAS PubMed.
- M. G. Montes de Oca, H. Kurnarakuru, D. Cherns and D. J. Fermin, J. Phys. Chem. C, 2011, 115, 10489–10496 CAS.
- V. Celorrio, M. G. Montes de Oca, D. Plana, R. Moliner, D. J. Fermin and M. J. Lazaro, Int. J. Hydrogen Energy, 2012, 37, 7152–7160 CrossRef CAS PubMed.
- V. Celorrio, M. G. Montes de Oca, D. Plana, R. Moliner, M. J. Lazaro and D. J. Fermin, J. Phys. Chem. C, 2012, 116, 6275–6282 CAS.
- M. G. Montes de Oca, D. Plana, V. Ceorrio, M. J. Lazaro and D. J. Fermin, J. Phys. Chem. C, 2012, 116, 692–699 CAS.
- J.-W. Hu, Y. Zhang, J.-F. Li, Z. Liu, B. Ren, S.-G. Sun, Z.-Q. Tian and T. Lian, Chem. Phys. Lett., 2005, 408, 354–359 CrossRef CAS PubMed.
- M. D. Obradović and S. L. Gojković, Electrochim. Acta, 2013, 88, 384–389 CrossRef PubMed.
- R. Reske, M. Duca, M. Oezaslan, K. J. P. Schouten, M. T. M. Koper and P. Strasser, J. Phys. Chem. Lett., 2013, 4, 2410–2413 CrossRef CAS.
Footnote |
| † Electronic supplementary information (ESI) available: Experimental details, as well as determination of k values and faradaic efficiency. See DOI: 10.1039/c3cc46543h |
| This journal is © The Royal Society of Chemistry 2013 |
