 Open Access Article
 This Open Access Article is licensed under a
 Creative Commons Attribution 3.0 Unported Licence
Graphene oxide: efficiency of reducing agents
Siegfried
Eigler
*a,
Stefan
Grimm
a,
Michael
Enzelberger-Heim
b,
Paul
Müller
b and
Andreas
Hirsch
a
aDepartment of Chemistry and Pharmacy and Institute of Advanced Materials and Processes (ZMP), Friedrich-Alexander-Universität Erlangen-Nürnberg (FAU), Dr.-Mack Str. 81, 90762 Fürth, Germany. E-mail: siegfried.eigler@zmp.uni-erlangen.de; Fax: +49 (0)911 6507865015; Tel: +49 (0)911 6507865005
bDepartment of Physics and Interdisciplinary Center for Molecular Materials, Friedrich-Alexander-Universität Erlangen-Nürnberg (FAU), Erwin-Rommel-Str. 1, 91058 Erlangen, Germany
First published on 21st June 2013
Abstract
The efficiency of reducing agents for the reduction of graphene oxide (GO) could be probed by scanning Raman spectroscopy. A film of graphene flakes derived from GO was probed to be graphene like. We also focus on the surface quality of reduced GO (rGO).
Graphene is a polymer structure made of fused six membered sp2-hybridized carbon atoms and is the building block of graphite.1 Despite graphite being ubiquitous, graphene is difficult to exfoliate in large quantities. In contrast to graphite, graphite oxide, the oxidation product yielded from graphite, can easily delaminate into graphene oxide (GO). This form of graphene may develop into the cheap precursor of choice to yield processable graphene in large quantities.2–4 Another benefit of GO is its high potential to be the most versatile starting material for the preparation of functionalized graphene.5 Thereby, possibly even the exciting properties of graphene can be extended to meet the demands for electronic devices,6 selective sensors,7 functional composite materials,8 solar cells,9 or energy storage.10 GO is a single layer of graphite oxide decorated with epoxy and hydroxyl groups. The structure of GO has been studied for more than a century but still needs further clarification, which emerges from the recent discovery of highly reducible GO or organosulfate as part of its structure.11,12
While GO is heterogeneously decorated with functional groups and almost every second carbon atom is sp3-hybridized additional defects are invisible for common spectroscopic methods. After reduction of GO to rGO functional groups are removed and defects dominate the structure that can be probed by Raman spectroscopy.13 Nevertheless, the reduction product of conventional GO that was prepared by the protocol introduced by Charpy and later Hummers and Offeman can only provide graphene with numerous defects.14,15 The reason for that is the completely destroyed honeycomb lattice by holes, additional atoms or a reorganized carbon lattice, such as five membered rings.2,3 However, there have been tremendous attempts to find a highly efficient reducing agent for GO to yield rGO of enhanced quality.2,3 Thus, besides thermal treatment (up to 1100 °C) in vacuo or reducing atmospheres, the chemical approach utilizes reducing agents, such as hydrazine, hydrides, hydroxides, metals, redox active sulfur species, reductive acids, or even enzymatic reduction. The reason why these attempts failed are defects already present in GO due to the oxidation process. Therefore, the yielded reduction product was described as Swiss cheese.16
Recently, we discovered a new method to produce a new GO (GO-n) that exhibits a preserved hexagonal σ-framework of C-atoms and thus is an efficient precursor of graphene with very few defects.11 Because of the limited quality of conventional GO (GO-c) it was impossible to evaluate reducing agents being more or less effective in reducing GO-c. In contrast GO-n provides the ability to be reduced to graphene with a very low defect density and the distance between two defects was found to be up to 10–14 nm.11 The defect distance in GO-c is generally of about 1 nm and thus is graphene that is dominated by defects.
Here we show using GO-n that it is possible to determine the effectiveness of reducing agents. By using scanning Raman spectroscopy we can determine the effectiveness of reducing agents and in addition we focus on the surface quality which is of great importance. Thus, the development of reducing agents should also be focused on being not only effective but also able to yield a clean graphene surface.
Flakes of GO-n with a size of about 3–5 μm were prepared according to the method described before.11 The study presented here is based on single layered films prepared by the Langmuir–Blodgett method.11 The substrates used are Si-wafers/300 nm SiO2 suitable for making single layers of graphene visible by optical microscopy.17–19 The quality of the final graphene was determined by Raman spectroscopy (using laser for excitation at 532 nm), a method that is well established. The method is based on a study where graphene is treated with different doses of Ar-ions and the evolution of peaks in Raman spectra was studied.20 The most important spectral features are the defect induced D-peak, in addition to the G-peak. Further, in graphene the most prominent peak is the 2D peak (second order of the D-peak) and its intensity not only declines with increasing defect-density, but also the full width at half maximum (Γ) broadens. Finally, it is possible to translate these spectral properties to determine the distance between distorted regions caused by defects and to define the degree of functionalization.20–22
In this communication we concentrate on the most commonly used reduction methods to prepare rGO. One of the most favored methods for the reduction of GO is thermal annealing.23,24 However, even if that method is easily achieved, it comes along with a tremendous weight-loss of about 30% up to 200 °C which is accompanied by formation of CO and CO2 which results in a highly disordered structure. We heated the samples in air on a hot-plate up to 200 °C.25 Another method is based on the reduction with hydrazine vapor even if hydrazine is toxic. Thus, we used a stream of hydrazine in nitrogen to reduce GO deposited on the surface.26 Due to the toxicity of hydrazine vitamin C was found to be a highly effective reducing agent and it was claimed to be an ideal substitute for hydrazine.27 We deposited a drop of vitamin C (10 mg ml−1) on the rGO-n film at 80 °C for 1 h followed by rinsing with water and methanol. Another reducing agent is hydriodic acid which is often used in combination with other strong acids.28,29 We used it in the same way as reported earlier.11 The efficiency of the reduction of GO is often proved by thermogravimetry, X-ray diffraction, photoelectron spectroscopy, Raman spectroscopy or by the C/O ratio. Especially the C/O ratio is not able to identify distorted regions in the carbon lattice. Thus, here we concentrate on Raman spectroscopy (Fig. 1).
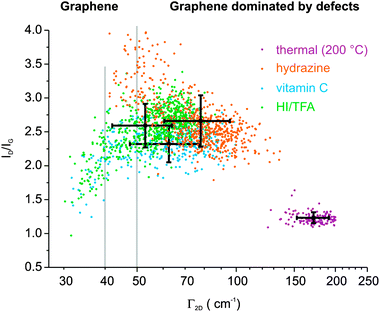 | ||
| Fig. 1 Raman analysis of the overall quality of rGO-n films prepared by four different reduction techniques. | ||
Using a statistical approach, we are able to make different reducing agents with comparable reduction efficiency for GO-n because of its intact σ-framework. This is conducted by scanning the surface area of 100 × 100 μm2 with an increment of 2.5 μm. Finally, 1600 spectra were filtered by the intensity of the G-peak, which varies with the number of layers, to gain information from single rGO-n layers. Subsequently, peak intensities of the D peak and the G peak and the full width at half maximum of the 2D peak (Γ2D) were analyzed. We found that plotting the ratio of the intensity of the D peak and the G peak vs. Γ of the 2D peak makes the differences in yielded quality of rGO-n visible. The Γ2D for graphene is about 32 cm−1 on SiO2.30 We find that it varies between 32 cm−1 and 200 cm−1 for rGO-n depending on the reduction method. The less efficient method is thermal reduction. After thermal annealing at 200 °C a highly distorted material is obtained with Γ2D = 172 ± 19 cm−1 and an ID/IG = 1.2 ± 0.1. These data demonstrate the highly distorted character of thermally converted GO. If vapor of hydrazine hydrate is used at 80 °C followed by annealing at 160 °C an enhanced quality is obtained with the Γ2D = 78 ± 18 cm−1 and an ID/IG = 2.7 ± 0.4. Using hydrazine the distance between distorted regions is about 2–3 nm and very close to the transition of graphene that is no longer dominated by defects. If vitamin C at 80 °C is used an even more enhanced quality is obtained with the Γ2D = 62 ± 15 cm−1 and an ID/IG = 2.3 ± 0.3. In addition 7.9% of spectra exhibit spectral features of graphene with a Γ2D < 40 cm−1 which is a clear measure of single layers of graphene, while the Γ2D of double layers is larger.20,31 If the vapor of hydriodic acid in combination with trifluoro acetic acid (HI–TFA) is used at 80 °C the best performance is found and the Γ2D = 58 ± 11 cm−1 and ID/IG = 2.6 ± 0.3 and 9.5% of spectra exhibit a Γ2D < 40 cm−1 (Table 1). This average quality represents the transition from graphene dominated by defects to graphene that is no longer dominated by defects. With the distance between distorted regions being larger than 3 nm a Γ2D ∼ 50 cm−1 is expected (Fig. 1).20
| Reduction method for GO-n | Γ 2D (cm−1) | I D/IG | % Γ2D < 50 cm−1 | % Γ2D < 40 cm−1 | L D (nm) |
|---|---|---|---|---|---|
| a Optimized GO-n. b L D = average distance between defects.20 | |||||
| Thermal | 172 ± 19 | 1.2 ± 0.1 | 0.0 | 0.0% | ∼1 |
| Hydrazine | 78 ± 18 | 2.7 ± 0.4 | 5.5 | 0.0% | 2–3 |
| Vitamin C | 62 ± 15 | 2.3 ± 0.3 | 23.0 | 7.9 | 2–3 |
| HI–TFA | 58 ± 1 | 2.6 ± 0.3 | 25.0 | 9.5 | 3 |
| HI–TFAa | 49 ± 9 | 2.8 ± 0.4 | 59.2 | 17.4 | 5 |
We conclude, neither thermal reduction nor reduction with hydrazine are efficient methods to exploit the full potential of GO-n. Vitamin C and HI–TFA appear to be efficient for yielding graphene. Comparing the maximum of ID/IG ratios found it is obvious that the highest ID/IG ratios are found for hydrazine (ID/IG ∼ 4) while the ID/IG ∼ 3 for vitamin C rGO-n. One reason for that may be adsorbates on the surface of graphene. Therefore, we had a closer look at the surface of rGO-n utilizing AFM. We note that the rGO-n surfaces were cleaned by immersing rGO in distilled water and methanol for 15 minutes.
After drying AFM reveals the highest surface roughness of 2 nm and an overall thickness of 4 nm for individual flakes of vitamin C rGO-n. These surface adsorbates could not be removed by washing procedures using common organic solvents. The analysis of the surfaces reveals that HI–TFA exhibits the smoothest surface for rGO-n. However, the flake thickness remains larger than that of pristine graphene (Fig. 3).
Finally, we found HI–TFA is an efficient method for the reduction of GO-n and superior to using vitamin C or hydrazine. The limiting factor to yield perfect graphene from GO-n is distorted regions still present in GO-n. Thus, we altered the work-up procedure during graphite oxidation making the hydrolysis of the reduction mixture at 0 °C instead of 10 °C. The finally prepared rGO-n film was analyzed by Raman spectroscopy also. Now we find that the obtained film can be termed as a film of graphene flakes because the Γ2D = 49 ± 9 cm−1 and ID/IG = 2.8 ± 0.4. Thus, the average distance between defects is about 5 nm (Fig. 2).
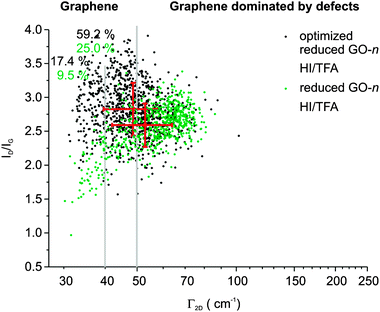 | ||
| Fig. 2 Raman analysis of an rGO-n film prepared from optimized GO-n and compared to normal GO-n. | ||
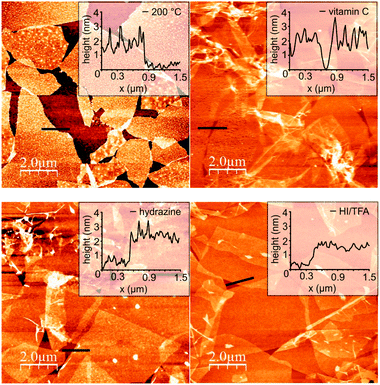 | ||
| Fig. 3 AFM images of differently prepared rGO-n; inset: height profile along the back line. | ||
Furthermore, 17.4% of spectra are due to a high quality of graphene with Γ2D < 40 cm−1 while 59.2% of spectra belong to a quality that is no longer dominated by distorted regions and thus exhibits a Γ2D < 50 cm−1.
We conclude that for yielding high quality graphene from GO there are two factors that limit the final quality. First, the quality of GO is crucial because intrinsic and permanent structural defects in the σ-framework of C-atoms introduced by the preparation process limit the potential of reduction. Further on, this type of reducing method was identified to be more or less efficient. Reduction that comes along with carbon-loss appears to be worse compared to reducing agents such as hydrazine. Best results were obtained using a reducing agent in combination with acid. Furthermore, the latter appears to be beneficial in terms of surface quality also. Finally, we show that probing the graphene quality by scanning Raman spectroscopy can result in visible enhancements in the preparation of rGO-n, as shown for an optimized film that could be identified as a film of graphene flakes. Beyond that, we identify surface adsorbates on rGO that limit the purity of graphene. We want to point to that topic that needs to be addressed more in future work to find methods to purify graphene surfaces while the quality of graphene is preserved.
The authors thank the Deutsche Forschungsgemeinschaft (DFG – SFB 953, Project A1, B5 “Synthetic Carbon Allotropes”), the European Research Council (ERC; grant 246622 – GRAPHENOCHEM), and the Cluster of Excellence ‘Engineering of Advanced Materials (EAM)’ for financial support.
Notes and references
- A. K. Geim and K. S. Novoselov, Nat. Mater., 2007, 6, 183–191 CrossRef CAS.
- S. Pei and H.-M. Cheng, Carbon, 2012, 50, 3210–3228 CrossRef CAS.
- S. Mao, H. Pu and J. Chen, RSC Adv., 2012, 2, 2643–2662 RSC.
- Y. Zhu, S. Murali, W. Cai, X. Li, J. W. Suk, J. R. Potts and R. S. Ruoff, Adv. Mater., 2010, 22, 3906–3924 CrossRef CAS.
- T. Kuila, S. Bose, A. K. Mishra, P. Khanra, N. H. Kim and J. H. Lee, Prog. Mater. Sci., 2012, 57, 1061–1105 CrossRef CAS.
- Q. He, S. Wu, S. Gao, X. Cao, Z. Yin, H. Li, P. Chen and H. Zhang, ACS Nano, 2011, 5, 5038–5044 CrossRef CAS.
- Y. Shao, J. Wang, H. Wu, J. Liu, I. A. Aksay and Y. Lin, Electroanalysis, 2010, 22, 1027–1036 CrossRef CAS.
- X. Huang, X. Qi, F. Boey and H. Zhang, Chem. Soc. Rev., 2012, 41, 666–686 RSC.
- Z. Yin, S. Sun, T. Salim, S. Wu, X. Huang, Q. He, Y. M. Lam and H. Zhang, ACS Nano, 2010, 4, 5263–5268 CrossRef CAS.
- M. Pumera, Energy Environ. Sci., 2011, 4, 668–674 CAS.
- S. Eigler, M. Enzelberger, S. Grimm, P. Hofmann, W. Kroener, A. Geworski, C. Dotzer, M. Röckert, J. Xiao, C. Papp, O. Lytken, H.-P. Steinrück, P. Müller and A. Hirsch, Adv. Mater., 2013, 25, 3583–3587 CrossRef CAS.
- S. Eigler, C. Dotzer, F. Hof, W. Bauer and A. Hirsch, Chem.–Eur. J., 2013, 19, 9490–9496 CrossRef CAS.
- S. Eigler, C. Dotzer and A. Hirsch, Carbon, 2012, 50, 3666–3673 CrossRef CAS.
- G. Charpy, C. R. Hebd. Seances Acad. Sci., 1909, 148, 920–923 CAS.
- J. William, S. Hummers and R. E. Offeman, J. Am. Chem. Soc., 1958, 80, 1339 CrossRef.
- I. Jung, D. A. Dikin, R. D. Piner and R. S. Ruoff, Nano Lett., 2008, 8, 4283–4287 CrossRef CAS.
- L. J. Cote, F. Kim and J. Huang, J. Am. Chem. Soc., 2009, 131, 1043–1049 CrossRef CAS.
- S. Roddaro, P. Pingue, V. Piazza, V. Pellegrini and F. Beltram, Nano Lett., 2007, 7, 2707–2710 CrossRef CAS.
- C. Casiraghi, A. Hartschuh, E. Lidorikis, H. Qian, H. Harutyunyan, T. Gokus, K. S. Novoselov and A. C. Ferrari, Nano Lett., 2007, 7, 2711–2717 CrossRef CAS.
- L. G. Cançado, A. Jorio, E. H. M. Ferreira, F. Stavale, C. A. Achete, R. B. Capaz, M. V. O. Moutinho, A. Lombardo, T. S. Kulmala and A. C. Ferrari, Nano Lett., 2011, 11, 3190–3196 CrossRef.
- M. M. Lucchese, F. Stavale, E. H. M. Ferreira, C. Vilani, M. V. O. Moutinho, R. B. Capaz, C. A. Achete and A. Jorio, Carbon, 2010, 48, 1592–1597 CrossRef CAS.
- J. M. Englert, P. Vecera, K. C. Knirsch, R. A. Schäfer, F. Hauke and A. Hirsch, ACS Nano, 2013, 7, 5472–5482 CrossRef CAS.
- H. A. Becerril, J. Mao, Z. Liu, R. M. Stoltenberg, Z. Bao and Y. Chen, ACS Nano, 2008, 2, 463–470 CrossRef CAS.
- A. Bagri, C. Mattevi, M. Acik, Y. J. Chabal, M. Chhowalla and V. B. Shenoy, Nat. Chem., 2010, 2, 581–587 CrossRef CAS.
- S. Eigler, C. Dotzer, A. Hirsch, M. Enzelberger and P. Müller, Chem. Mater., 2012, 24, 1276–1282 CrossRef CAS.
- X. Gao, J. Jang and S. Nagase, J. Phys. Chem. C, 2010, 114, 832–842 CAS.
- M. J. Fernández-Merino, L. Guardia, J. I. Paredes, S. Villar-Rodil, P. Solís-Fernández, A. Martínez-Alonso and J. M. D. Tascón, J. Phys. Chem. C, 2010, 114, 6426–6432 Search PubMed.
- I. K. Moon, J. Lee, R. S. Ruoff and H. Lee, Nat. Commun., 2010, 1, 73 CrossRef.
- P. Cui, J. Lee, E. Hwang and H. Lee, Chem. Commun., 2011, 47, 12370–12372 RSC.
- Y. Y. Wang, Z. H. Ni, T. Yu, Z. X. Shen, H. M. Wang, Y. H. Wu, W. Chen and A. T. S. Wee, J. Phys. Chem. C, 2008, 112, 10637–10640 CAS.
- S. Chen, W. Cai, R. D. Piner, J. W. Suk, Y. Wu, Y. Ren, J. Kang and R. S. Ruoff, Nano Lett., 2011, 11, 3519–3525 CrossRef CAS.
| This journal is © The Royal Society of Chemistry 2013 |