 Open Access Article
A ferromagnetically coupled diphenoxo-bridged Gd3+–Mn2+ dinuclear complex with a large magneto-caloric effect†‡§
Enrique
Colacio
*a,
José
Ruiz
a,
Giulia
Lorusso
b,
Euan K.
Brechin
*c and
Marco
Evangelisti
*b
aDepartamento de Química Inorgánica, Facultad de Ciencias, Universidad de Granada, Av. Fuentenueva S/N, 18071 Granada, Spain. E-mail: ecolacio@ugr.es
bInstituto de Ciencia de Materiales de Aragón, CSIC-Universidad de Zaragoza, Departamento de Física de la Materia Condensada, 50009 Zaragoza, Spain. E-mail: evange@unizar.es; Web: http://molchip.unizar.es/
cEaStCHEM School of Chemistry, The University of Edinburgh, West Mains Road, Edinburgh, EH93JJ, UK. E-mail: ebrechin@staffmail.ed.ac.uk
First published on 22nd March 2013
Abstract
A novel diphenoxo-bridged Gd3+–Mn2+ dimer is proposed as a good candidate for cryogenic magnetic refrigeration. The large MCE is enhanced by the ferromagnetic interaction between the two metal ions.
Heteropolynuclear 3d-Gd3+ complexes are attracting much attention because, amongst other things, they have potential application as low-temperature magnetic coolers.1 These systems show an enhanced magneto-caloric effect (MCE), which is based on the change of magnetic entropy upon application of a magnetic field, that can be exploited for cooling applications via adiabatic demagnetisation.1 The MCE is greatly enhanced in molecules containing isotropic magnetic ions with large total spin S.1 Taking this into account, 3d/Gd3+ complexes are very good candidates for molecular refrigerants as the Gd3+ ion has an isotropic f7 configuration and the 3d-Gd3+ magnetic interactions are generally ferromagnetic in nature, leading to ground states with increased and large spin multiplicity.2 Moreover, the 3d-Gd3+ magnetic exchange interactions are very weak, due to the very efficient shielding of the 4f orbitals of the Gd3+ by the fully occupied 5s and 5p orbitals,2 and this generates multiple low-lying excited and field-accessible states, each of which can contribute to the magnetic entropy of the system. Another factor favouring a large MCE is the presence of a large metal/ligand mass ratio, in order to limit the amount of passive, non-magnetic elements and in small cluster molecules this is more easily accomplished than in larger ones. Therefore, small, lightweight 3d-Gd3+ complexes containing isotropic transition metal ions such as Mn2+, Fe3+, Cr3+, Cu2+, that exhibit weak ferromagnetic interactions between the metal ions, are appropriate candidates for constructing magnetic coolers.
Although a number of molecular 3d-Gd3+ complexes have been reported so far, those containing Mn2+ are limited to phosphonate-bridged Mn4Gd6 and Mn9Gd9 cages,3 one diphenoxo-bridged Mn2Gd2 tetranuclear complex,4 three triphenoxo-bridged Mn2Gd trinuclear complexes,5 and one alkoxo-bridged MnGd dinuclear complex.6 We note that the two former compounds exhibit significant MCE and most exhibit ferromagnetic interactions.
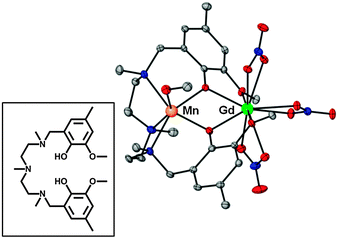
In this communication we report the first example of a diphenoxo-bridged Gd3+–Mn2+ complex from the compartmental H2L ligand shown in the inset of Fig. 1, which has an inner pentadentate N3O2 coordination pocket and an external O2O2 site that favours the formation of Mn2+–Ln3+. The new compound was predicted to exhibit a ferromagnetic interaction between the metal ions, leading to an enhanced MCE.
 | ||
| Fig. 1 Perspective view of the molecular structure of 1. H-atoms are omitted for clarity. Colour code: N = blue, O = red, Mn = orange, Gd = green, C = grey. The inset shows the H2L pro-ligand. | ||
The molecular structure of [Mn(CH3OH)(μ-L)Gd(NO3)3] (1, Fig. 1) consists of a dinuclear molecule in which the Gd3+ and Mn2+ ions are bridged by two phenoxo groups of the L2− ligand. Within the dinuclear unit, the Mn2+ ion exhibits a [slightly] trigonally distorted MnN3O3 coordination polyhedron, where the three N-atoms from the amine groups, and consequently the three O-atoms belonging to the methanol molecule and phenoxo bridging groups, occupy fac positions. The Mn–O and Mn–N distances are found in the ranges 2.148(2) Å to 2.158(2) Å and 2.298(3) Å to 2.376(3) Å, respectively. The Gd3+ ion exhibits a GdO10 coordination sphere, consisting of the two phenoxo bridging oxygen atoms, the two methoxy oxygen atoms and six oxygen atoms belonging to three bidentate nitrate anions. The GdO10 coordination sphere is rather asymmetric, exhibiting short Gd–Ophenoxo bond distances of 2.342(2) Å and 2.322(2) Å, longer Gd–Onitrate bond lengths in the range 2.492(2)–2.522(2) Å and weakly coordinated methoxy groups with Gd–Omethoxy distances of 2.608(2) Å and 2.564(2) Å. The Mn(μ-O2)Gd bridging fragment is almost planar with a hinge angle of 4.1° and rather symmetric with similar pairs of Mn–O bond distances (2.148 Å and 2.158Å), Gd–O bond distances and Mn–O–Gd bridging angles (110.27° and 110.68°). The Mn⋯Gd separation is 3.686 Å. In the crystal, molecules are held in pairs by a couple of symmetrically related hydrogen bonds involving the non-coordinated O-atom of one of the bidentate nitrate anions and the methanol molecule, with O⋯O distances of 2.831 Å (Fig. S1, ESI§). The shortest intermolecular M⋯M distance is 7.707(1) Å (Mn⋯Gdii = 2 − x, 1 − y, 2 − z).
The room temperature χMT value for 1 (12.90 cm3 K mol−1) is slightly higher than the expected value for a pair of non-interacting Mn2+ (S = 5/2) and Gd3+ (S = 7/2) ions (12.25 cm3 K mol−1) with g = 2. On lowering the temperature χMT slowly increases from room temperature to 50 K (13.70 cm3 K mol−1) before rising more sharply to reach a quasi-plateau of 19.90 cm3 K mol−1 below 3.5 K (see Fig. S2, ESI§). This behaviour is due to a ferromagnetic interaction between the Mn2+ and Gd3+ ions leading to a ST = 6 spin ground state. The fact that χMT does not reach the expected value for a S = 6 ground state (21.0 cm3 K mol−1 for g = 2) at 2 K is probably due to the combined result of intermolecular antiferromagnetic interactions, mediated by the hydrogen bonding interactions, and weak zero-field splitting effects from both metal ions. The magnetic properties have been modelled by using the following spin-Hamiltonian:
| H = −JsGdsMn − zJ′〈Sz〉Sz + gμBsGdB + gμBsMnB | (1) |
The first term accounts for the isotropic magnetic exchange coupling between the Mn2+ and Gd3+ ions, the second accounts for the intermolecular interactions by means of the molecular field approximation, and the last two are the Zeeman terms. The fit of the experimental susceptibility data to the theoretical equation derived from the above Hamiltonian by using the van Vleck equation afforded the following set of parameters: J = +0.99(2) cm−1, gGd = 2.02(4), gMn = 2.01(7) and zJ′ = −0.008(1) cm−1. The zJ′ parameter also includes the effects of the very weak local anisotropy of Gd3+ and Mn2+ ions.
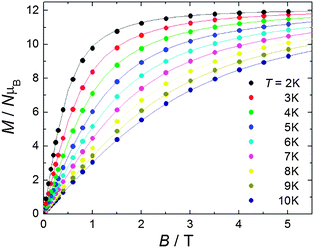
Previous DFT calculations7,8 and experimental2,8 results have clearly shown that the JMGd coupling in diphenoxo-bridged Gd3+–M2+ complexes (M2+ = Mn, Ni, Cu) increases when the planarity of the M–O2–Gd bridging fragment and the M–O–Gd bridging angle increase. Both structural factors are correlated, so that the latter increases as the bridging fragment becomes more planar. In line with this, compound 1, with an almost planar Mn–(O)2–Gd bridging fragment, presents the second largest JMnGd value found for ferromagnetically coupled diphenoxo- and triphenoxo-bridged Gd3+–Mn2+ complexes. Fig. 2 shows the magnetic field dependence of the isothermal magnetization (M) for T ranging from 2 K to 10 K. The experimental data can be modelled using eqn (1) by neglecting in first instance anisotropies and intermolecular interactions. By using the same values obtained from fitting the susceptibility data, we calculate the magnetization curves (depicted as solid lines in Fig. 2) which nicely account for the experimental data.
 | ||
| Fig. 2 (Circles) Experimental isothermal magnetization curves for fields up to B = 5 T and taken at several T, as labelled. The solid lines are the calculated magnetization curves, see the main text for details. | ||
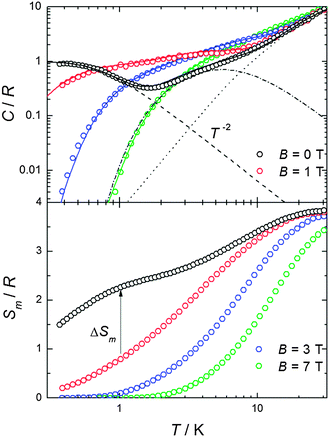
The molar heat capacity, C/R, measured in the presence of several magnetic fields B is plotted in Fig. 3 against temperature. A non-magnetic heat capacity, which we associate to vibrational phonon modes of the lattice, is seen to develop at high temperatures. The fit to the Debye function (dotted line) gives a Debye temperature θD = 50.6 K, in agreement with values reported for this class of material.9 At low temperatures, the experimental magnetic heat capacity for B ≥ 1 T is well described by the calculated Schottky curves as obtained from eqn (1) using the set of eigenvalues found from the fitting of the magnetic data. Intriguingly, the zero-field experimental curve shows two broad Schottky-like features which are well-separated in temperature – being centred at T ≈ 0.3 K and 5.5 K, respectively. We tentatively explain the anomaly at higher temperatures as the result of the zero-field splitting between the ST = 6 ground state and the first excited level S = 5 (dashed-dotted line; see Fig. S3, ESI§ for the energy-level diagram). For temperatures lower than ≈ 1 K, only the ST = 6 ground state is populated. In the mean-field approach, the onset of intermolecular magnetic correlations can be interpreted in terms of an interaction field Bint, producing a Zeeman splitting of the (otherwise degenerate) ST = 6 ground state leading to an anomaly, as indeed reported in Fig. 4 for such low temperatures. An excellent description of the experimental data is obtained for the interaction field Bint = 0.16 T (dashed line in Fig. 3). The solid lines in Fig. 3 are the sum of calculated magnetic and lattice contributions.
 | ||
| Fig. 3 Top: temperature dependence of the heat capacity C normalized to the gas constant R and measured in the presence of several magnetic fields, as labelled. Fit of heat capacity (solid lines) is calculated as explained in the text. Lattice (dotted line) and magnetic (dot-dashed lines, dashed lines) contributions are shown. Bottom: experimental magnetic entropies as obtained from the corresponding C data. | ||
 | ||
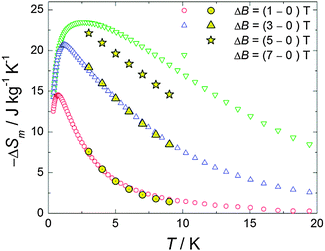
| Fig. 4 Temperature-dependencies of the magnetic entropy change ΔSm, for the indicated applied-field changes ΔB, as obtained from heat capacity (empty markers) and magnetization (full markers) measurements. | ||
An estimate of the magnetic exchange acting between the ST = 6 molecular units can be obtained by comparing the experimental T−2 term, CT2/R = 0.6 K2 to the theoretical expression for the high-temperature tail of the magnetic heat capacity, i.e., CT2/R = 2nz[S(S + 1)|J′|/3kB]2, where z is the number of nearest magnetic neighbours between different ST = 6 molecular units and n = 1, 2, and 3 for Ising, XY, and Heisenberg models, respectively.10 This comparison provides z1/2|J′|/kB = 1.5 × 10⁻² cm−1, in satisfactory agreement with the previous estimate from magnetic data. We note that this value should be considered as an upper estimate for the magnetic exchange since our simple model does not take into account the magnetic dipolar interactions or the magnetic anisotropies. From the heat capacity data we derive the magnetic entropy by making use of the equation:
The results, reported in Fig. 4, show a perfect agreement between the two independent derivations. The MCE for ΔB = 7 T is maximum at T = 2.7 K reaching a value of 23.5 J kg−1 K−1.
To summarize, by diagonalizing spin Hamiltonian (1) we have fitted the susceptibility and magnetization data for complex 1 obtaining an intramolecular ferromagnetic exchange coupling between the metal centres. The value so-obtained for the exchange is amongst the largest so far reported for similar dinuclear and trinuclear Mn2+–Gd3+ compounds. This is attributed to the near planar Mn–(O)2–Gd bridging fragment.7,8 From heat capacity measurements, we found that the magnetic entropy change reaches significant values for 1–3 K, namely ΔSm = 23.5 J kg−1 K−1 for ΔB = 7 T. Our results therefore suggest that the Gd3+–Mn2+ molecular dimer 1 is a very good candidate for a magnetic coolant for liquid-helium temperatures.
We are grateful to MINECO (contracts MAT2012-38318-C03 and CTQ2011-24478), EC for a Marie Curie-IEF (PIEF-GA-2011-299356 to GL). EKB thanks the EPSRC and Leverhulme Trust.
Notes and references
- M. Evangelisti and E. K. Brechin, Dalton Trans., 2010, 39, 4672 RSC.
- M. Andruh, J. P. Costes, C. Diaz and S. Gao, Inorg. Chem., 2009, 48, 3342 CrossRef CAS.
- Y.-Z. Zheng, E. M. Pineda, M. Helliwell and R. E. P. Winpenny, Chem.–Eur. J., 2012, 18, 4161 CrossRef CAS.
- Y. Bi, Y. Li, W. Liao, H. Zhang and D. Li, Inorg. Chem., 2008, 47, 9733 CrossRef CAS.
- (a) T. Yamaguchi, J. P. Costes, Y. Kishima, M. Kojima, Y. Sunatsuki, N. Brefuel, J. P. Tuchagues, L. Vendier and W. Wernsdorfer, Inorg. Chem., 2010, 49, 9125 CrossRef CAS; (b) V. Chandrasekhar, B. M. Pandian, R. Boomishankar, A. Steiner and R. Clérac, Dalton Trans., 2008, 5143 RSC; (c) J. P. Costes, J. García-Tojal, J. P. Tuchagues and L. Vendier, Eur. J. Inorg. Chem., 2009, 3801 CrossRef CAS.
- A. N. Georgopoulou, R. Adam, C. P. Raptopoulou, V. Psycharis, R. Ballesteros, B. Abarca and A. K. Boudalis, Dalton Trans., 2010, 39, 5020 RSC.
- E. Cremades, S. Gomez-Coca, D. Aravena, S. Alvarez and E. Ruiz, J. Am. Chem. Soc., 2012, 134, 10532 CrossRef CAS.
- E. Colacio, J. Ruiz, A. J. Mota, M. A. Palacios, E. Cremades, E. Ruiz, F. J. White and E. K. Brechin, Inorg. Chem., 2012, 51, 857 CrossRef.
- See for example M. Evangelisti, F. Luis, L. J. de Jongh and M. Affronte, J. Mater. Chem., 2006, 16, 2534 RSC and references therein.
- A. Abragam and B. Bleaney, Electron Paramagnetic Resonance of Transition Ions, Oxford University Press, Oxford, England, 1970 Search PubMed.
Footnotes |
| † Celebrating 300 years of Chemistry at The University of Edinburgh and 100 years at the University of Granada. |
| ‡ This paper is dedicated to Dr. Jean Pierre Costes on the occasion of his retirement. |
| § Electronic supplementary information (ESI) available: Experimental details, crystallographic data in CIF format for 1, selected bond distance and angles for 1, energy levels patterns. CCDC 926238. For ESI and crystallographic data in CIF or other electronic format see DOI: 10.1039/c3cc41483c |
| This journal is © The Royal Society of Chemistry 2013 |


