Effects of amphiphilic block copolymers on the equilibrium lactone fractions of camptothecin analogues at different pHs†
Tianyuan Cia,
Liang Chena,
Ting Lia,
Guangtao Changa,
Lin Yuab and
Jiandong Ding*ab
aState Key Laboratory of Molecular Engineering of Polymers, Department of Macromolecular Science, Advanced Materials Laboratory, Fudan University, Shanghai 200433, China
bKey Laboratory of Smart Drug Delivery of Ministry of Education, School of Pharmacy, Fudan University, Shanghai 201203, China. E-mail: jdding1@fudan.edu.cn; Fax: +86-21-65640293; Tel: +86-21-65643506
First published on 8th August 2013
Abstract
Camptothecin (CPT) and its analogues constitute one of the most important families of anticancer drugs. However, the CPT-family members have to confront the severe problem of hydrolysis from lactone form, the only form capable of antitumor efficacy, to the carboxylate form, leading to a significant decrease in therapy efficiency as well as severe side effects. Herein, two CPT analogues with different water solubilities, 10-hydrocamptothecin (HCPT) and topotecan (TPT), and four poly(ethylene glycol)–poly(propylene glycol)–poly(ethylene glycol) (PEG–PPG–PEG, Pluronic) copolymers of varied hydrophilic–lipophilic balance (HLB) values, were examined with emphasis on the change of the equilibrium lactone fraction (flactone) of the drugs after addition of the copolymers. In all cases, flactone was enhanced. For weak water-soluble HCPT, the enhancement extent was significantly increased with decrease of the copolymer HLB, which is influenced by the block chain length for a given series of amphiphilic block copolymers. The effect was less significant for TPT, a more hydrophilic drug. The fluorescence experiments confirmed the assembly of the drugs into polymeric micelles. A series of pH titrations were also carried out, which quantified the shift of pH1/2 (pH when flactone = 0.5) after addition of the copolymers. The optimal or most sensitive pH, pHopt, which gave the maximum enhancement of flactone by the polymers, was found to depend upon the type of drug, the HLB value of copolymer, and also the polymer concentration. Hence, this work has indicated the universality of the enhancement effect of polymeric micelles on the equilibrium lactone fractions of CPT analogues, and meanwhile revealed the dependence of the enhancement extent upon the HLB values of the copolymer and hydrophilicity of the drug. The concept of optimal pH has also been put forward for the first time.
1. Introduction
Camptothecin (CPT) and its analogues are very famous anticancer drugs.1,2 Among them, two water-soluble analogues, topotecan (TPT) and irinotecan, have been approved by the Food and Drug Administration (FDA) in the US to treat metastatic ovarian carcinoma or colon cancer.2 However, members of the CPT family have to confront the severe problem of hydrolysis from the lactone form to the carboxylate form in neutral or basic conditions, as shown in Fig. 1. Such a hydrolysis leads to a huge decrease in therapy efficiency, for only the lactone form is antitumor, and the carboxylate form exhibits not only no efficacy but also severe side effects.3,4 The hydrolysis is reversible and pH-dependent. Unfortunately, the equilibrium lactone fractions of CPT analogues such as TPT and 10-hydrocamptothecin (HCPT) are only about 15% under the physiological conditions of the human body (pH 7.4, 37 °C).5 | ||
| Fig. 1 Chemical scheme of hydrolysis of CPT analogues. | ||
Along with the development of drug delivery systems,6–17 plenty of efforts have been made to understand and try to solve this problem.18–24 Many of the previous strategies indicate or imply two key points: (1) low preparation pH to keep a high initial lactone fraction; (2) material carriers to delay ring opening at physiological pH.
Our recent study illustrated that these two key points are not really necessary, because the high lactone fraction in the presence of some working materials is due to shifting of the equilibrium between lactone and carboxylate forms at physiological pH, instead of a kinetic delay. The first working material we studied was a hydrogel, which is a thermogel physically hydrogelated due to a sol–gel transition upon increase of temperature.25 Our group has extensively investigated a thermogel composed of biodegradable block copolymers of poly(ethylene glycol) (PEG) and biodegradable polyesters such as poly(D,L-lactic acid-co-glycolic acid) (PLGA) of appropriate compositions.26–28 One unexpected result is that the encapsulation of the CPT analogue TPT into a thermogel of PLGA–PEG–PLGA significantly enhanced the equilibrium lactone fraction of TPT under physiological conditions.25 Since the physical hydrogel has a percolated micelle network structure,29–32 we further checked which form was more essential for such an enhancement effect, micelle or hydrogel. The former was confirmed to be more important, as revealed in our very recent publication, which examined HCPT in the presence of poly(ethylene glycol)20–poly(propylene glycol)70–poly(ethylene glycol)20 (PEG20–PPG70–PEG20, Pluronic P123).33
While most amphiphilic block copolymers with most compositions can form micelles well in water, only very limited copolymers of narrow composition can form physical hydrogels. So, the micelle effect on the fraction of the active form of CPT drugs implies much wider applications, if such a micelle effect is universal and adjustable. The effect of hydrophilic–lipophilic balance (HLB) values on the equilibrium fraction of the lactone form of CPT analogues thus becomes a fundamental topic underlying this phenomenon related to drug–material interactions. To examine this effect is the original aim of the present work.
In the process of this study, we thought that although the initial low pH might not be necessary, the extent of enhancement of the equilibrium lactone fraction, flactone, might differ with medium pH, and even an optimal pH with respect to the maximum enhancement, pHopt, might exist. If the concept of pHopt is to be justified, its universality should be further checked in the cases of different drugs and copolymers with varied HLB values. The underlying fundamental research is very meaningful for the design of optimal conditions for carrier systems of antitumor drugs. So, another theme of this paper is to examine the pH dependence of the enhancement extent, and thus a series of pH titrations were carried out.
In this paper, we will employ two drugs, water-soluble TPT and weak water-soluble HCPT, and four poly(ethylene glycol)–poly(propylene glycol)–poly(ethylene glycol) copolymers (Pluronic P123, P85, F127 and F68) as our model systems to study the effect of the HLB values of the amphiphilic copolymers on the equilibrium lactone fractions of CPT analogues in water at different pHs. Herein, PEG–PPG–PEG instead of PLGA–PEG–PLGA will be used in order to control the medium pH, because polyesters of the PLGA block degrade in water, resulting in acidic products. The optimal pH with respect to maximum enhancement of lactone fractions of CPT-family antitumor drugs upon addition of polymers will be defined and examined for the first time. We will also try to interpret the phenomena and summarize some relevant regularities of the polymer effect on the active form of CPT-family drugs.
2. Materials and methods
2.1. Materials
HCPT and TPT were bought from Shanghai Knowshine Pharmachemicals Inc., and ChengDu LanBei Chemical Technology Ltd., respectively. Pluronic P123 (number average molecular weight, Mn ∼ 5800), Pluronic F127 (Mn ∼ 12![[thin space (1/6-em)]](https://www.rsc.org/images/entities/char_2009.gif) 600) and Pluronic F68 (Mn ∼ 8400) were bought from Sigma-Aldrich. Pluronic P85 (Mn ∼ 4600) was received from BASF Corporation. All chemicals were used without further purification.
600) and Pluronic F68 (Mn ∼ 8400) were bought from Sigma-Aldrich. Pluronic P85 (Mn ∼ 4600) was received from BASF Corporation. All chemicals were used without further purification.
2.2. Critical micelle concentration (CMC) determination in phosphate buffered saline (PBS) solution
CMC detection of the Pluronic copolymers (P123, P85, F127 and F68) was conducted with the hydrophobicity-sensitive dye 1,6-diphenyl-1,3,5-hexatriene (DPH).34,35 PBS was used to dissolve the copolymers. Briefly, 100 μL DPH–methanol stock solution (0.4 mM) was added to 10 mL of polymeric solutions of different concentrations, to give a final DPH concentration of 4 μM. DPH is incorporated into the micellar core, leading to significant absorbance increases at three characteristic peaks at 337, 356 and 377 nm upon micelle formation. After equilibrating at 37 °C for 12 h, samples were detected using a UV-vis spectrometer.2.3. Determination of sizes of Pluronic micelles
Micelle size was detected using a light scattering spectrophotometer, NanoZS90 (Malvern). 2.5 wt% polymeric PBS solutions (P123, P85, F127 and F68) were pre-prepared and equilibrated at 37 °C for about 6 h. Then samples were taken out and filtered through a 0.22 μm filter (Millipore) to get rid of dust. A further equilibration for 10 min was made at 37 °C before detection.2.4. High performance liquid chromatography (HPLC) analysis of HCPT and TPT
The lactone and carboxylate forms of the CPT analogues were separated and quantified using HPLC instrumentation equipped with Waters Separation Module e2695 and Waters UV-visible detector 2486. The separation of the two forms was conducted in a reverse phase 5 μm C18 column (SunFire™, 150 mm × 4.6 mm) with a mobile phase of 70% PBS (pH 6.5, 25 mM), 23% methanol and 7% tetrahydrofuran for HCPT, and 89% PBS (pH 6.5, 25 mM), 6% methanol and 5% tetrahydrofuran for TPT. The flow rate was 1 mL min−1 and the column temperature was 25 °C.2.5. Equilibrium lactone fractions of HCPT and TPT in Pluronic copolymer solutions
PBS solutions of polymeric micelles (P123, P85, F127, or F68) with HCPT or TPT were pre-prepared. After adjusting the pH to 7.4 and equilibrating at 37 °C for 12 h, samples were taken out and diluted by mobile phase for HPLC analysis.2.6. pH dependence of lactone fractions of HCPT and TPT
The aqueous systems with both polymers and HCPT or TPT were adjusted to pH values between 4.0 and 9.0. After equilibrating at 37 °C for 12 h, the samples were detected using HPLC. The data were fitted to the Henderson–Hasselbalch (HH) equation, which was previously used in our pH titrations of proteins.36–39 The HH equation is, in this study, written as
 | (1) |
Here pH1/2 is defined by us as the pH value at which the equilibrium lactone fraction equals 50%.
Subtraction of the two HH curves for the equilibrium lactone fractions of the CPT analogues in polymeric PBS solution and in just PBS solution gave rise to the difference in the equilibrium lactone fractions at a certain pH. Finding the single peak by Gaussian analysis gave rise to the values of the optimal pH (pHopt) and the maximum increase of the lactone fraction (Δfmax).
2.7. Fluorescence spectra of HCPT in a series of Pluronic solutions
Pluronic solutions (P123, P85, F127, F68) containing 10 μg mL−1 HCPT were prepared and adjusted to pH 4.0. After equilibrating for 6 h, samples were detected using a fluorescence spectrophotometer FLS920 (Edinburgh Instruments). The excitation wavelength was 380 nm.3. Results
3.1. Micellization of the four Pluronic copolymers in PBS
PEG–PPG–PEG amphiphilic copolymers form micelles at concentrations over their CMCs. The CMC values were determined by absorption experiments in the presence of a hydrophobicity-sensitive dye, with some experimental data shown in Fig. 2A. The micelles with a copolymer concentration of 2.5 wt% were also detected via dynamic light scattering, as shown in Fig. 2B. The sizes of the micelles of P123, P85 and F127 were around 10 nm. No reliable scattering was detected in the case of F68, because its CMC was over 2.5 wt% in PBS solution. The resultant CMCs are listed in Fig. 3A, and exhibited a positive correlation with the HLB values of the amphiphilic copolymers.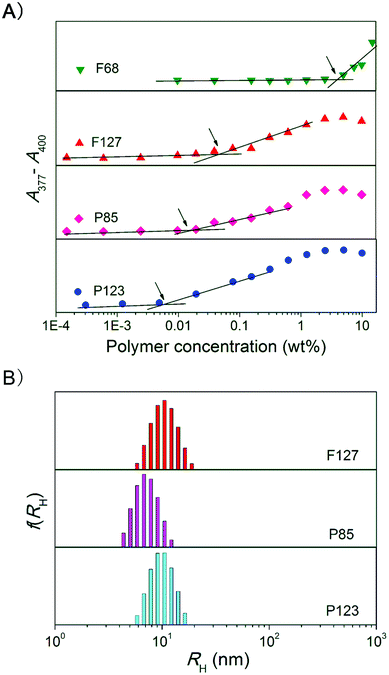 | ||
| Fig. 2 (A) Absorbance difference of dye DPH (4 μM) as a function of the concentration of the indicated Pluronic copolymers in PBS at 37 °C. The polymeric concentrations at the cross-points denoted by the arrows indicate the CMC values. (B) Intensity distribution of the hydrodynamic radii (RH) of micelles of the indicated Pluronic copolymers (2.5 wt%) in PBS at 37 °C. | ||
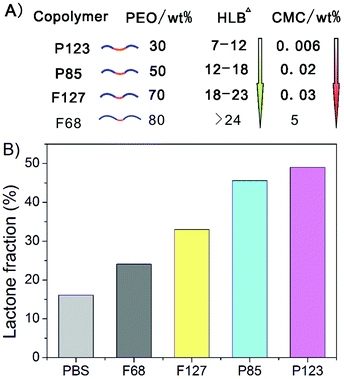 | ||
| Fig. 3 (A) Schematic presentation of the four Pluronic copolymers examined in this study. The CMC values in PBS at 37 °C were measured in this study; the HLB data are from the literature.40 (B) Equilibrium lactone fractions of HCPT in the presence of the indicated Pluronic block copolymers with a given polymer concentration of 10 wt%. PBS was used as a control. Specimens were equilibrated at 37 °C and pH 7.4, and all specimens were detected once, on the same day, under the same detection conditions. | ||
3.2. Equilibrium lactone fractions of HCPT in different Pluronic solutions
The equilibrium lactone fractions of HCPT were then detected in the presence of these four Pluronic copolymers (P123, P85, F127 and F68), at a copolymer concentration of 10 wt%, which is over all of the CMCs. All of the four cases led to an enhancement of the lactone form. The relative hydrophobicity of these four block copolymers is negatively related to the CMC, and the equilibrium lactone fractions of HCPT increased with the hydrophobicity of the block copolymers, as illustrated in Fig. 3B.3.3. Fluorescence spectra of HCPT in Pluronic solutions
In order to interpret the phenomenon shown in Fig. 3, the fluorescence spectra of HCPT in polymeric solutions of different concentrations were detected, as shown in Fig. 4. This characterization is enabled by the inherent microenvironment-polarity sensitivity of HCPT.41 The fluorescence-emitting ability of HCPT was confirmed in Fig. 4. A significant increase in the fluorescence intensity between 400–450 nm was observed once the HCPT was incorporated into the relatively hydrophobic micelle cores. For P123, the increase in the fluorescence intensity between 400–450 nm was the strongest among the four copolymers at the same concentration; no significant change in the fluorescence spectrum was observed even in 20 wt% F68. Therefore, the HCPT molecules had a greater tendency to enter into P123 micelles, and nearly could not be entrapped in F68 micelles.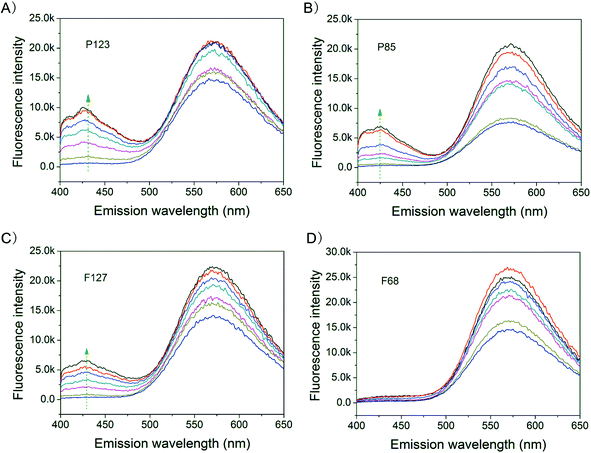 | ||
| Fig. 4 Fluorescence spectra of HCPT in aqueous systems of the indicated Pluronic polymers at pH 4.0. The drug concentration was 10 μg mL−1. The excitation wavelength was 380 nm and the detection temperature was 37 °C. The fluorescence intensity of HCPT in the 400–450 nm region was enhanced with an increase in the polymer concentration. (A) P123 of concentrations 0.039, 0.156, 0.625, 1.25, 2.5, 5 and 10 wt%. (B) P85 of concentrations 0.039, 0.156, 0.625, 1.25, 2.5, 5 and 10 wt%. (C) F127 of concentrations 0.039, 0.156, 0.625, 1.25, 2.5, 5 and 10 wt%. (D) F68 of concentrations 0.156, 0.625, 2.5, 5, 10, 15 and 20 wt%. The arrows emphasize the increase in fluorescence, indicating the co-assembly of HCPT into the hydrophobic microenvironments of the copolymer micelles. | ||
3.4. Polymer concentration dependence of the lactone fractions of HCPT
The fluorescence intensity of HCPT at 425 nm versus F127 concentration is shown in Fig. 5A. There exists a “turning point” in the F127 concentration (about 0.2 wt%), after which the fluorescence intensity of HCPT started to increase. Considering the inherent polarity-sensitivity of HCPT, this point can be regarded as the starting point of HCPT entrapment into F127 micelles, and thus is defined by us as Cco-assembly.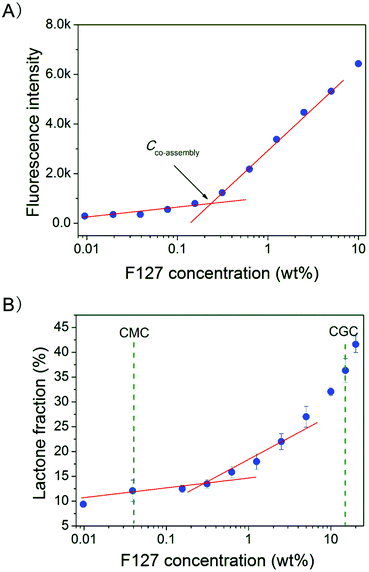 | ||
| Fig. 5 (A) Fluorescence intensity of HCPT at 425 nm in F127–PBS solutions of varied concentrations. The drug concentration was 10 μg mL−1. The excitation wavelength was 380 nm and the detection temperature was 37 °C. (B) F127 concentration dependence of the equilibrium lactone fraction of HCPT at 37 °C and pH 7.4. Dashed lines indicated the CMC and CGC. | ||
The concentration dependence of the equilibrium lactone fraction of HCPT in F127 solutions is shown in Fig. 5B. We found that the equilibrium lactone fraction of HCPT was enhanced in F127 solutions with concentrations greater than Cco-assembly. The turning concentration (about 0.2 wt%) is larger than the CMC (about 0.03 wt% according to Fig. 2) and smaller than the critical gelation concentration (CGC), which is about 15 wt% in PBS at 37 °C according to ESI Fig. S1.†
3.5. Equilibrium lactone fractions of another CPT analogue, TPT, in Pluronic solutions
The equilibrium lactone fractions of TPT in these four Pluronic copolymers were also detected. Unlike HCPT, the lactone fractions of TPT showed less significant relevance with the HLB value of the polymer used. Nevertheless, the lactone fraction remained around 30% in 20 wt% Pluronic PBS solutions, which is higher than that of about 15% in just PBS (Fig. 6).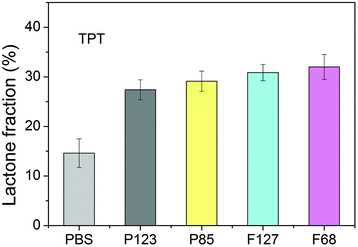 | ||
| Fig. 6 Equilibrium lactone fractions of TPT in different Pluronic solutions with a copolymer concentration of 20 wt%. The samples were equilibrated in PBS at 37 °C and pH 7.4 for 12 h before detection. | ||
3.6. Polymer concentration dependence of the lactone fractions of TPT
The polymer concentration dependence of the lactone fraction of TPT in P123 and F127 solutions was also examined, with results shown in Fig. 7. No significant difference was found between the two groups, which demonstrated the less significant relevance of different Pluronic micelles on the lactone fraction of TPT, a hydrophilic CPT analogue.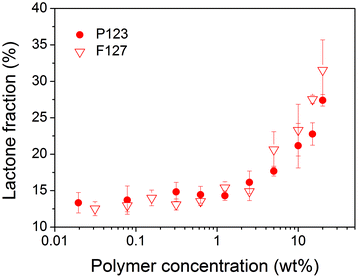 | ||
| Fig. 7 Equilibrium lactone fractions of TPT in P123 and F127 solutions at 37 °C and pH 7.4. | ||
3.7. pH dependence of the equilibrium lactone fractions of TPT or HCPT in both PBS and polymeric solutions
The equilibrium lactone fractions were measured at different pHs, and pH titrations of the equilibrium lactone fractions for P123–HCPT, P85–HCPT, F127–HCPT, F68–HCPT, P123–TPT and F127–TPT systems were carried out. Fitting with eqn (1) gave the value of pH1/2, defined as the pH value at which the lactone fraction equals to 50%. Typical results are shown in Fig. 8 with ΔpH1/2, pHopt and Δfmax denoted in the figure.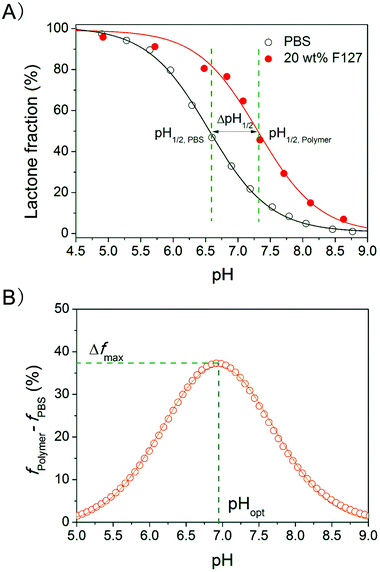 | ||
| Fig. 8 (A) pH titration curve of the equilibrium lactone fractions of HCPT in 20 wt% F127 solutions at 37 °C. The lines are the outputs of fitting the data with eqn (1), resulting in pH1/2 = 6.6 (HH index, n = 0.93) for PBS and 7.35 (n = 1.03) for 20 wt% F127 PBS solution. (B) Difference in the equilibrium lactone fractions between the polymer solution and PBS. The Gaussian analysis gave pHopt and Δfmax. | ||
We think that the existence of pHopt might be very important, and thus checked the universality of this concept in the cases of different copolymers and drugs, and varied copolymer concentrations. The results are shown in Fig. 9. Despite the dependence on the copolymer compositions and concentrations, and also on the drug types, the peaks existed in all the cases.
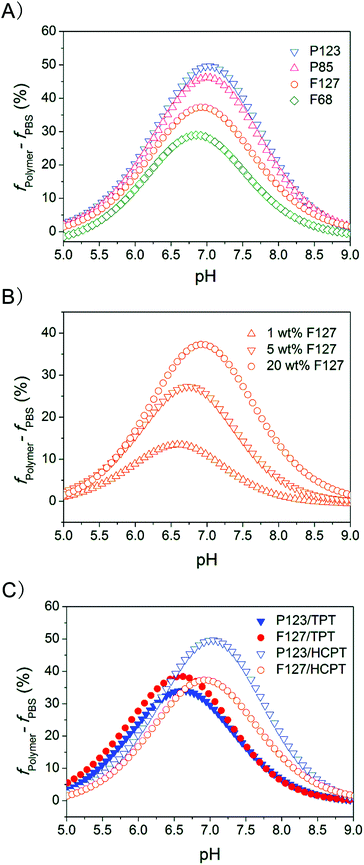 | ||
| Fig. 9 Increase in the equilibrium lactone fraction of CPT analogues after addition of Pluronic copolymers into PBS at different pHs. (A) HCPT (50 μg mL−1), and the indicated copolymers (20 wt%); (B) HCPT (50 μg mL−1), and F127 of the indicated concentrations. (C) TPT (60 μg mL−1) or HCPT (50 μg mL−1) in the indicated Pluronic PBS solutions with a given polymer concentration (20 wt%). | ||
4. Discussion
4.1. Universality of the phenomenon of enhancing the equilibrium lactone fractions of CPT analogues by adding copolymer micelles, and the dependence of the enhancement extent upon the HLB values of the copolymers and the hydrophilicity of the drugs
Pluronic copolymers form micelles over their CMCs and critical micelle temperatures. At physiological conditions of pH 7.4 and 37 °C with PBS as the medium, the CMCs of the polymers P123, P85, F127 and F68 were 0.005 wt%, 0.02 wt%, 0.03 wt% and 5 wt%, respectively, with micelle sizes of around 10 nm, as shown in Fig. 2.The equilibrium lactone fraction of HCPT was significantly enhanced in these polymeric micelle solutions. The effect was found to be negatively related to the HLB value of the copolymer. In a 10 wt% PBS solution of P123 with HLB 7–12, flactone was 49%; in contrast, it was only 24% in a 10 wt% F68 solution with HLB > 24, as shown in Fig. 3. This may be due to the different extents of the hydrophobic interaction between the CPT analogues and the Pluronic micelles. In order to certify this, we detected, taking advantage of the fluorescence-emitting capability of the drug HCPT and the polar sensitivity of its 10-OH, the fluorescence spectra of HCPT in polymer concentrations from 10−2 to 10 wt%. If HCPT molecules are entrapped into the micelles, the microenvironment would change to be more hydrophobic, and this would lead to an obvious fluorescence intensity increase at 400–450 nm of the fluorescence emission spectra, at the same HCPT concentration. As shown in Fig. 4, the increase was strongest in P123 solutions, illustrating that the largest amount of HCPT was incorporated into P123 micelles. This is consistent with the most significant enhancement of flactone by P123, among the four Pluronics examined in this paper. Therefore the co-assembly between HCPT and the polymeric micelles was the main reason for the increase in the equilibrium lactone fraction. The schematic presentation of this effect is shown in Fig. 10. So, it is not hard to understand that the HLB values of the copolymers influence the extent of the enhancement of the flactone of the CPT-family drugs.
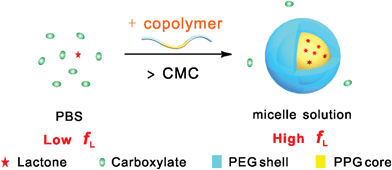 | ||
| Fig. 10 Schematic presentation of the effect of copolymer micelles on the equilibrium lactone fractions of CPT analogues. The hydrophobic interaction between the polymeric micelles and the drug molecules leads to higher lactone fractions in the micelle solutions than in PBS. | ||
Similar to HCPT, TPT exhibited an increased lactone fraction in Pluronic solutions. For example, flactone in 20 wt% polymer solutions was around 30%, compared to 15% in PBS at the same temperature and medium pH, as shown in Fig. 6. There is less significant relevance of the equilibrium lactone fractions of TPT to the HLB values of the copolymers used, as revealed in Fig. 6 and 7. Compared to HCPT, TPT is much more hydrophilic. So, the hydrophobic interaction between the drug molecules and the polymeric micelles was less sensitive to the copolymer HLB values. The relatively weak interaction also resulted in a lower flactone of TPT compared to that of HCPT with the same copolymer and at the same polymer concentration, as seen from comparison between Fig. 3, 6 and 7.
4.2. Characterization of the interaction extent between the drugs and micelles by shifting of pH1/2
The hydrolysis process for a CPT analogue includes two steps: opening of the lactone ring and ionization of the carboxyl group:42
 | (2) |
Kopen and Ka describe the equilibrium constants for the two steps, respectively. And the total equilibrium constant is
 | (3) |
Usually, [C] is small and can be neglected.42 At pH1/2, [L] = [C−], and eqn (3) can be re-written as
| pK = pH1/2 = pKopen + pKa | (4) |
From our previous analysis,33 the hydrophobic interaction between the drugs and micelles would increase the pKa of the carboxyl group of the open-ring form of “C” in eqn (2), further increasing the apparent parameter pH1/2 obtained by the titration curve. Therefore, we could evaluate the hydrophobic interaction in one polymer–drug system from the change in pH1/2 as exampled in Fig. 8A.
The resultant values of pH1/2 are summarized in Table 1. We think that while pH1/2,PBS is related to the inherent property of the drug, ΔpH1/2 reflects the extent of the hydrophobic interaction between the drugs and the polymeric micelles. The higher the value of ΔpH1/2 becomes, the stronger the hydrophobic interaction is. Therefore, in the system of P123–HCPT, this interaction was strongest when ΔpH1/2 = 1.00 in 20 wt% P123 solution. The hydrophobic interaction decreases with the increase of polymer HLB, leading to a decrease of ΔpH1/2, as shown in Table 1. The corresponding equilibrium lactone fraction at a given pH decreased, as shown in Fig. 3. It is also reasonable that the hydrophilic drug TPT exhibited less significant relevance of ΔpH1/2 to the polymer HLB. Driven by the hydrophobic interaction between the polymeric micelles and the drug molecules, the pKa of the carboxyl group of the open-ring form would be increased in a relatively more “organic” atmosphere, which pushes the hydrolysis reaction in eqn (2) to the left and finally leads to a higher [L] at neutral conditions.
| System | Polymer concentration (wt%) | pH1/2,PBS | pH1/2,polymer | ΔpH1/2a | pHopt | Δfmax |
|---|---|---|---|---|---|---|
| a ΔpH1/2 = pH1/2,polymer − pH1/2,PBS. | ||||||
| P123–HCPT | 20 | 6.56 | 7.56 | 1.00 | 7.00 | 49.6% |
| P85–HCPT | 20 | 6.56 | 7.50 | 0.94 | 6.99 | 46.0% |
| F127–HCPT | 20 | 6.56 | 7.35 | 0.79 | 6.94 | 37.0% |
| F68–HCPT | 20 | 6.56 | 7.21 | 0.65 | 6.88 | 30.9% |
| F127–HCPT | 5 | 6.56 | 7.06 | 0.50 | 6.72 | 26.8% |
| F127–HCPT | 1 | 6.56 | 6.81 | 0.25 | 6.58 | 13.8% |
| P123–TPT | 20 | 6.27 | 7.01 | 0.74 | 6.62 | 34.4% |
| F127–TPT | 20 | 6.27 | 7.04 | 0.77 | 6.56 | 38.2% |
4.3. Optimal pH for the largest enhancement of equilibrium lactone fractions of CPT analogues after addition of polymers
The equilibrium lactone fractions of CPT analogues could be enhanced after adding polymers in a wide pH range, and there exists an optimal pH for the largest enhancement, defined as pHopt in this paper for the first time. Such a phenomenon is universal, as seen from the cases of different drugs and copolymers in Fig. 9.Our analysis of the data in Table 1 showed that the value of pHopt seems to be related to pH1/2 via
 | (5) |
A further mathematical derivation proves this relation quite well, and the derivation process is given in the ESI.† So, pHopt shows a positive relation to both pH1/2,PBS and pH1/2,polymer.
We further revealed the dependence of pHopt on the drug, the polymer and their concentrations, as reflected in Fig. 9 and Table 1. As the polymer effect is concerned with a given drug and thus a given pH1/2,PBS, pHopt is, according to eqn (5), determined by pH1/2,polymer. So, a stronger polymer–drug interaction must lead to a higher pH1/2,polymer, and thus a higher pHopt. That is why the value of pHopt increased from 6.88 in the F68–HCPT system to 7.00 in the P123–HCPT system in Fig. 9A.
It is quite interesting and reasonable that polymer concentration also influences pHopt significantly, as indicated in Fig. 9B. A higher polymer concentration leads to a globally stronger polymer–drug interaction, then a higher pH1/2,polymer and pHopt. That is why pHopt increased from 6.58 to 6.88 with F127 concentrations from 1 to 20 wt% in Fig. 9B.
If the drug is altered, both pH1/2,PBS and pH1/2,polymer might change, leading to a different pHopt. For TPT, its pH1/2,PBS (6.27) was much lower than that of HCPT (6.56), therefore the values of pHopt for TPT were lower than those of HCPT in both P123 and F127 solutions, due to the relatively weak drug–polymer interaction for TPT. So, Fig. 9C can be understood as well.
We suggest pHopt is a crucial quantity for the design of drug carriers. The values in our experiments were mostly located in the pH range of 6.5–7. The significant increase in neutral and weak acidic conditions is important in the practical treatment of tumors, in which the local pH is just in this range.11,43–46 So, our pHopt values match the extracellular pH of tumor sites quite well, which is helpful for the enhancement of flactone in a pH-targeted way, simply by addition of neutral polymers. So, the present fundamental research has shed new insight into selecting appropriate drugs and polymer compositions and concentrations.
5. Conclusions
Two CPT derivatives and four Pluronic copolymers were examined, which demonstrated the universality of the enhancement of the lactone fraction of the drugs after addition of amphiphilic block copolymers and also illustrated the dependence of the enhancement extents on the HLB values of the copolymers and the solubilities of the drugs. For HCPT, this effect was negatively correlated with the HLB of polymer to a large extent. The phenomenon was less significant for TPT, a more hydrophilic drug. The hydrophobic interaction between the drugs and the amphiphilic copolymers accounted for the above phenomenon, and the interaction in the micelles favored the ring closing of the CPT drugs significantly.The parameter pHopt with respect to the largest enhancement of the equilibrium lactone fractions was further put forward, and its dependence on drug type and polymer composition and concentration was revealed. In the end of this paper, it seems not trivial to indicate that most pHopt lie in weak acidic condition, which is very common for anti-tumor treatments. Hence, the effect of flactone enhancement by the addition of amphiphilic copolymer might have its own impact on the field of pharmaceutics, as well as on the fields of polymers and biomaterials.
Acknowledgements
The authors are grateful for the financial supports from NSF of China (grants no. 91127028 and no. 21034002), Chinese Ministry of Science and Technology (973 programs no. 2009CB930000 and no. 2011CB606203), and Science and Technology Developing Foundation of Shanghai (grant no. 13XD1401000).References
- M. E. Wall, M. C. Wani, C. E. Cook, K. H. Palmer, A. T. McPhail and G. A. Sim, J. Am. Chem. Soc., 1966, 88, 3888–3890 CrossRef CAS.
- Y. Pommier, Nat. Rev. Cancer, 2006, 6, 789–802 CrossRef CAS.
- M. Potmesil, Cancer Res., 1994, 54, 1431–1439 CAS.
- G. L. Beretta and F. Zunino, Biochem. Pharmacol., 2007, 74, 1437–1444 CrossRef CAS.
- T. G. Burke and Z. H. Mi, J. Med. Chem., 1994, 37, 40–46 CrossRef CAS.
- Y. Bae and K. Kataoka, Adv. Drug Delivery Rev., 2009, 61, 768–784 CrossRef CAS.
- M. Talelli and W. E. Hennink, Nanomedicine, 2011, 6, 1245–1255 CrossRef CAS.
- C. T. Huynh, M. K. Nguyen, J. H. Kim, S. W. Kang, B. S. Kim and D. S. Lee, Soft Matter, 2011, 7, 4974–4982 RSC.
- X. Q. Yang, B. Zhu, T. A. Dong, P. J. Pan, X. T. Shuai and Y. S. Inoue, Macromol. Biosci., 2008, 8, 1116–1125 CrossRef CAS.
- C. Deng, Y. J. Jiang, R. Cheng, F. H. Meng and Z. Y. Zhong, Nano Today, 2012, 7, 467–480 CrossRef CAS.
- G. H. Gao, M. J. Park, Y. Li, G. H. Im, J.-H. Kim, H. N. Kim, J. W. Lee, P. Jeon, O. Y. Bang, J. H. Lee and D. S. Lee, Biomaterials, 2012, 33, 9157–9164 CrossRef CAS.
- M. M. Ding, J. H. Li, H. Tan and Q. Fu, Soft Matter, 2012, 8, 5414–5428 RSC.
- J. L. He, M. Z. Zhang and P. H. Ni, Soft Matter, 2012, 8, 6033–6038 RSC.
- M. Zelzer, S. J. Todd, A. R. Hirst, T. O. McDonald and R. V. Ulijn, Biomater. Sci., 2013, 1, 11–39 RSC.
- M. Kamimura, T. Furukawa, S.-i. Akiyama and Y. Nagasaki, Biomater. Sci., 2013, 1, 361–367 RSC.
- S. R. Abulateefeh, S. G. Spain, K. J. Thurecht, J. W. Aylott, W. C. Chan, M. C. Garnett and C. Alexander, Biomater. Sci., 2013, 1, 434–442 RSC.
- J. Wang, C. Yin, G. Tang, X. Lin and Q. Wu, Biomater. Sci., 2013, 1, 774–782 RSC.
- A. Shenderova, T. G. Burke and S. P. Schwendeman, Pharm. Res., 1999, 16, 241–248 CrossRef CAS.
- P. Tardi, E. Choice, D. Masin, T. Redelmeier, M. Bally and T. D. Madden, Cancer Res., 2000, 60, 3389–3393 CAS.
- R. Barreiro-Iglesias, L. Bromberg, M. Temchenko, T. A. Hatton, A. Concheiro and C. Alvarez-Lorenzo, J. Controlled Release, 2004, 97, 537–549 CrossRef CAS.
- Y. C. Chang and I. M. Chu, Eur. Polym. J., 2008, 44, 3922–3930 CrossRef CAS.
- J. Liu, Z. Z. Jiang, S. M. Zhang and W. M. Saltzman, Biomaterials, 2009, 30, 5707–5719 CrossRef CAS.
- Z. Song, H. Liu, J. Shen and X. Chen, Biomater. Sci., 2013, 1, 190–193 RSC.
- T. Y. Ci, T. Li, G. T. Chang, L. Yu and J. D. Ding, J. Controlled Release, 2013, 169, 329–335 CrossRef CAS.
- G. T. Chang, T. Y. Ci, L. Yu and J. D. Ding, J. Controlled Release, 2011, 156, 21–27 CrossRef CAS.
- L. Yu, H. Zhang and J. D. Ding, Angew. Chem., Int. Ed., 2006, 45, 2232–2235 CrossRef CAS.
- L. Yu, G. T. Chang, H. Zhang and J. D. Ding, Int. J. Pharm., 2008, 348, 95–106 CrossRef CAS.
- L. Yu, Z. Zhang, H. Zhang and J. D. Ding, Biomacromolecules, 2009, 10, 1547–1553 CrossRef CAS.
- S. H. Park, B. G. Choi, H. J. Moon, S. H. Cho and B. Jeong, Soft Matter, 2011, 7, 6515–6521 RSC.
- L. Yu and J. D. Ding, Chem. Soc. Rev., 2008, 37, 1473–1481 RSC.
- H. Zhang, L. Yu and J. D. Ding, Macromolecules, 2008, 41, 6493–6499 CrossRef CAS.
- L. Yu, T. Y. Ci, S. C. Zhou, W. J. Zeng and J. D. Ding, Biomater. Sci., 2013, 1, 411–420 RSC.
- T. Y. Ci, T. Li, L. Chen, G. T. Chang, L. Yu and J. D. Ding, Polym. Chem., 2013, 4, 3245–3255 RSC.
- C. D. Liu, Z. X. Zhang, K. L. Liu, X. P. Ni and J. Li, Soft Matter, 2013, 9, 787–794 RSC.
- L. Yu, Z. Zhang and J. D. Ding, Biomacromolecules, 2011, 12, 1290–1297 CrossRef CAS.
- M. Ming, M. Lu, S. P. Balashov, T. G. Ebrey, Q. G. Li and J. D. Ding, Biophys. J., 2006, 90, 3322–3332 CrossRef CAS.
- J. Wu, D. W. Ma, Y. Z. Wang, M. Ming, S. P. Balashov and J. D. Ding, J. Phys. Chem. B, 2009, 113, 4482–4491 CrossRef CAS.
- Y. Z. Wang, Y. C. Zhao, M. Ming, J. Wu, W. D. Huang and J. D. Ding, Photochem. Photobiol., 2012, 88, 922–927 CrossRef CAS.
- Y. Z. Wang, D. W. Ma, Y. C. Zhao, M. Ming, J. Wu and J. D. Ding, Acta Polym. Sin., 2012, 698–713 CrossRef CAS.
- P. Alexandridis and T. A. Hatton, Colloids Surf., A, 1995, 96, 1–46 CrossRef CAS.
- Z. H. Mi and T. G. Burke, Biochemistry, 1994, 33, 10325–10336 CrossRef CAS.
- J. Fassberg and V. J. Stella, J. Pharm. Sci., 1992, 81, 676–684 CrossRef CAS.
- E. S. Lee, Z. G. Gao and Y. H. Bae, J. Controlled Release, 2008, 132, 164–170 CrossRef CAS.
- K. H. Min, J.-H. Kim, S. M. Bae, H. Shin, M. S. Kim, S. Park, H. Lee, R.-W. Park, I.-S. Kim, K. Kim, I. C. Kwon, S. Y. Jeong and D. S. Lee, J. Controlled Release, 2010, 144, 259–266 CrossRef CAS.
- S. J. Yu, C. L. He, J. X. Ding, Y. L. Cheng, W. T. Song, X. L. Zhuang and X. S. Chen, Soft Matter, 2013, 9, 2637–2645 RSC.
- G. T. Chang, C. Li, W. Y. Lu and J. D. Ding, Macromol. Biosci., 2010, 10, 1248–1256 CrossRef CAS.
Footnote |
| † Electronic supplementary information (ESI) available. See DOI: 10.1039/c3bm60152h |
| This journal is © The Royal Society of Chemistry 2013 |
