A once-a-day dosage form for the delivery of insulin through the nasal route: in vitro assessment and in vivo evaluation†
H.
Nazar‡
*a,
P.
Caliceti
b,
B.
Carpenter
a,
A. I.
El-Mallah
c,
D. G.
Fatouros
d,
M.
Roldo
a,
S. M.
van der Merwe
a and
J.
Tsibouklis
a
aSchool of Pharmacy and Biomedical Sciences, University of Portsmouth, Portsmouth, Hampshire PO1 2DT, UK. E-mail: hamde.nazar@sunderland.ac.uk; Tel: +44 (0) 1915152097
bDepartment of Pharmaceutical Sciences, Faculty of Pharmacy, University of Padua, Italy
cDepartment of Pharmacology, Faculty of Pharmacy, Beirut Arab University, Lebanon
dDepartment of Pharmaceutical Technology, School of Pharmacy, Aristotle University of Thessaloniki, GR-54124 Thessaloniki, Greece
First published on 8th November 2012
Abstract
An in situ thermogelling, mucoadhesive formulation based on N-trimethyl chitosan chloride has been evaluated for its potential to affect the transmucosal delivery of insulin via the nasal route. In vitro studies at a physiologically relevant temperature (ca. 35 °C) have shown that the formulation releases most of its insulin load (ca. 70%) in a non-Fickian manner during the timescale over which the sol-to-gel transition (ca. 8 min) takes place, and also that, once gelation is complete, the release of the remainder of the therapeutic content follows first order kinetics over at least sixty minutes. Investigations on the effects of the application of the same formulation to a modelled nasal mucosa (Calu-3 cell monolayer) have indicated the capability of the formulation to induce the transient opening of tight junctions. Cytotoxic investigations have shown that the formulation exhibits negligible detrimental effects to the integrity of these monolayers. The in vivo potential of the nasal formulation to act as a once-a-day dosage form for the intranasal delivery of insulin has been demonstrated in a diabetic-rat model.
Introduction
The impetus for the considerable research activities towards the development of an intranasal system for the delivery of insulin1–10 is provided by the site-specific features of the mucosal epithelium: relatively low barrier to penetration by macromolecular actives, low enzymatic activity, avoidance of the first-pass effect, and relative ease of administration.11–13 The main barrier to the efficient nasal delivery of actives is presented by the mucociliary clearance (MCC):13,14 nasal cilia beat in a coordinated fashion to transport the mucus to the nasopharynx where it is eliminated by swallowing. Additionally, the absorption of macromolecular drugs, such as insulin, is inhibited by the tight junctions that are located between epithelial cells.4The main formulation strategy towards the improvement of the residence time of nasal delivery systems involves the use of mucoadhesive agents that disrupt the normal ciliary rhythm, and consequently MCC.15 Zaki et al. have shown16 that the nasal administration of a poly(acrylic acid) mucoadhesive agent (Carbopol 934P) results in the in situ formation of a gel that is capable of prolonging the transport time of co-formulated metoclopramide from 10 min (control solution) to 52 min (mucoadhesive gel) while maintaining mucosal integrity over two weeks of sequential administration. The weak correlation between the consistency index (a measure of gel viscosity) and MCC (a measure of in vivo mucoadhesiveness) led to the suggestion that the observed enhancement in residence time was more likely attributable to the bioadhesive properties of the polymer rather than to the changes in viscosity induced by the gel.16In vivo work (rat model) by Morimoto et al.8 has demonstrated the glucose-lowering effect of aqueous gel formulations of insulin and poly(acrylic acid). The enhancement in the nasal absorption of therapeutic agents effected by poly(acrylic acid) has been suggested to be due to the combined effects of its mucoadhesiveness, its effects on viscosity and, more importantly, on this material, forcing the temporary opening of tight junctions as it swells by extracting water from the local environment.12 In the quest for the development of intranasal hydrogels for the delivery of insulin, chitosan, another material that is capable of effecting the transient opening of tight junctions,17,18 has also received considerable attention.1,4,10,11,19–26 Chitosan is known to induce the translocation of occludin and of ZO-1 from plasma membranes to the cytoplasm, thereby facilitating the partial alteration of the cytoskeleton and in turn the opening of tight junctions. Both the effectiveness of chitosan at opening tight junctions and its capacity for strong mucoadhesive interactions are enhanced by increases in the molecular weight and/or degree of deacetylation.11 Chitosan has been combined with poly(vinyl alcohol) to form a thermosensitive in situ gelling system for the nasal delivery of insulin, which has been shown to exhibit a prolonged hypoglycaemic effect (maximum reduction of blood glucose of ca. 40% at 4 hours from administration), as compared with the subcutaneous insulin control (maximum reduction of blood glucose of ca. 40% at 1 hour from administration).4 The potential advantage of this chitosan/poly(vinyl alcohol) system over subcutaneous delivery becomes apparent when the claim that a gradual decrease in blood glucose inhibits the over-hypoglycaemic potential of a dosage form is considered.4 Chung et al.10 have reported a cross-linked chitosan gel (glutaraldehyde-crosslinked chitosan, interpenetrating with Poloxamer and glycine) that induces its maximum hypoglycaemic effect at 5 hours from administration. Work by Yu et al.7 has shown the concentration-dependent penetration enhancing effects of chitosan in intranasal formulations of insulin.7 The enhanced permeability imparted to nasal mucosa by thiolated or quaternised derivatives of chitosan, especially N-trimethyl chitosan chloride (TMC), have been shown to be influenced by the degree of functionalisation.11,27 TMC fulfils two further pre-requisites to efficient nasal delivery, namely good mucoadhesive behaviour, and rheological synergy with mucus.27 Accordingly, du Plessis et al.1 have reported that the nasal co-administration of insulin and chitosan in solution effects a twofold increase in the intranasal absorption of insulin, while an equivalent solution of insulin and highly quaternised (60%) TMC enhances absorption threefold, both as compared with a control solution of pure insulin. Chang et al. have described the thermosensitivity of a TMC/β-glycerophosphate injectable hydrogel that exhibits gelation within one min. when the temperature was raised from 4 to 37 °C,28 a property that may prove useful for intranasal drug delivery.
Towards the in vitro testing of nasal formulations, cultured nasal epithelium is regarded as a useful model for the study of nasal drug absorption, in that it allows a preliminary assessment of the permeability, toxicity, metabolism and transport of potential therapeutic agents.29 A useful surrogate for human nasal epithelia is provided by Calu-3 cells.30,31 These are a well-characterised human respiratory tract epithelial cells that can be cultured as confluent monolayers at the air–medium interface.32,33
In view of the promise of TMC as a carrier matrix for the intranasal delivery of insulin, we have formulated an in situ thermogelling hydrogel, based on this host matrix in combination with glycerophosphate (GP) and poly(ethylene) glycol (PEG). The formulation, which has been designed for application as an intranasal solution, forms a mucoadhesive gel within the timeframe of mucociliary clearance to effect prolonged residence at mucosal surfaces.27 The GP imparts protective hydration of the TMC chains at low temperatures and prevented inter- and intra-molecular crosslinking; the rise to nasal temperature, 35 °C, thence favours hydrophobic interactions, facilitating the formation of a hydrogel network. The additional PEG chains provide further sites for gel network formation via hydrogen bonding.27 We now extend this work by assessing the capability of this hydrogel to act as a controlled-release matrix for insulin. Also, by recording the formulation-induced changes in transepithelial electrical resistance (TEER), we use Calu-3 monolayers as an in vitro probe of the potential permeation-enhancing capacity of the applied formulation. In parallel, we assess the cytotoxicity of each formulation by monitoring the essential viability of the Calu-3 monolayer substrates. In addition, we report the results from studies that have been designed to assess the in vivo (rat model) effects of the formulation on MCC and those of parallel studies designed to monitor the hypoglycaemic effect induced as a result of the intranasal release of insulin from the same formulation.
Materials
Poly(ethylene) glycol 4000 (PEG) and chitosan (medium viscosity, 400 kDa, DD 84–89%) were obtained from Fluka, UK. TMC was obtained from the quaternisation of chitosan. Glycerophosphate (GP; equimolar mixture of α and β isomers), bicinchoninic acid (BCA) protein kit, Dulbecco's Modified Eagle Medium (DMEM; Nutrient Mixture F12; Ham's DMEM/F12), penicillin (10![[thin space (1/6-em)]](https://www.rsc.org/images/entities/char_2009.gif) 000 U mL−1)/streptomycin (10 mg mL−1), fetal bovine serum, non-essential amino acids, L-glutamine, 3-[4,5-dimethylthiazol-2-yl]-2,5-diphenyl tetrazolium bromide (MTT), Hank's Balanced Salt Solution, insulin from bovine pancreas, streptozocin, sodium pentobarbital and the glucose Trinder kit were purchased from Sigma-Aldrich Inc., UK. Orange FluoSpheres© aqueous suspension (1.0 μm, 2% w/v) was purchased from Invitrogen, Paisley, UK; upon dilution, the FluoSpheres© gave a linear fluorescence response up to a concentration of 0.02 mg mL−1. Human cell line Calu-3 was sourced from ATCC-LGC, UK. All other chemicals were obtained from Fisher Scientific, UK, and used as received.
000 U mL−1)/streptomycin (10 mg mL−1), fetal bovine serum, non-essential amino acids, L-glutamine, 3-[4,5-dimethylthiazol-2-yl]-2,5-diphenyl tetrazolium bromide (MTT), Hank's Balanced Salt Solution, insulin from bovine pancreas, streptozocin, sodium pentobarbital and the glucose Trinder kit were purchased from Sigma-Aldrich Inc., UK. Orange FluoSpheres© aqueous suspension (1.0 μm, 2% w/v) was purchased from Invitrogen, Paisley, UK; upon dilution, the FluoSpheres© gave a linear fluorescence response up to a concentration of 0.02 mg mL−1. Human cell line Calu-3 was sourced from ATCC-LGC, UK. All other chemicals were obtained from Fisher Scientific, UK, and used as received.
Methods
Preparation of formulations
N-Trimethyl chitosan chloride (degree of quaternisation: 33%) was synthesised from medium molecular weight chitosan, as previously described.27 The insulin-loaded sol-state hydrogels were formed by dissolving α,β-glycerophosphate (GP) to a concentration of 12.5% w/v, in a solution of insulin (3 mg mL−1, 1 mL) in aqueous HCl (0.1 M, 1 mL) and then adding (dropwise, with stirring) the resulting solution to a pre-prepared solution (4 mL) of TMC (4.5% w/v) and PEG (6.75% w/v). The pH of the resultant formulation was in the range 4.8–5.3. The gelation time (8 min) and temperature (32.6 °C), and the thermosensitivity and viscoelastic properties of the hydrogel were consistent with those reported for the corresponding systems prepared in the absence of HCl.27 For in vivo studies, insulin-loaded TMC solutions (4.5% w/v, pH 4.0–4.5), insulin solution (0.1 M HCl:water in the ratio 1:4, pH 4.8–5.3) and TMC solutions (4.5% w/v, pH 4.0–4.5) were all formulated to a final insulin concentration of 250 IU mL−1; control hydrogels and TMC solutions were formulated with no insulin content.
In vitro insulin release
Each dialysis sac (volume capacity = 3 mL, cut-off 12000–14000 Da, hydrated in pH 7.4 PBS for 24 h) was suspended in a stirred (70 rpm) SNES release medium (SNES: 7.45 mg mL−1 NaCl, 1.29 mg mL−1 KCl and 0.32 mg mL−1 CaCl2·2H2O, adjusted to pH 5.5 with 1 M HCl, 35 °C). Aliquots (100 μL) extracted at specified time intervals (over 1 h) for the determination of the insulin content (BCA protein assay kit) were replaced with an equal volume of fresh, warm (35 °C) SNES release medium. Experiments were performed in quadruplicate. The mechanisms governing insulin release were assessed by means of the Korsmeyer–Peppas equation:34| Mt/M∞ = KKP·tn | (1) |
Calu-3 cell culture
The differentiated human, mucus-producing, submucosal gland lung carcinoma cell line, Calu-3, was cultivated in flasks (80 cm3) containing DMEM/F12 Ham's 50:50 supplemented with non-essential amino acids (1% w/v), fetal bovine serum (10% w/v) and a mixture of penicillin and streptomycin (penicillin (10000 U mL−1)/streptomycin (10 mg mL−1); 50 μg mL−1, 0.005% w/v). Cells were maintained in a controlled atmosphere (95% air, 5% CO2) at 37 °C. The culture medium was changed every two days until 80–90% confluency was reached (ca. 7–10 days). Cells were seeded at 2 × 10⁶ cells per flask.
Measurement of transepithelial electrical resistance
Transepithelial electrical resistance (TEER) of monolayers of cells, seeded at a density of 4 × 10⁵ Calu-3 cells cm−2, was measured using Transwell© plates fitted with a microporous (0.4 μm) membrane. Epithelial monolayer confluence, assessed by inspection under the optical microscope, was complete at ca. 14 days from seeding; the growth medium, 1 mL each at the apical and basal chambers of Transwell© inserts, was replenished daily. TEER was monitored using a pair of chopstick electrodes (Millipore, Spain) connected to a Millicel©-ERS instrument. The baseline resistance was determined from measurements taken 60 min prior to the replacement of the growth medium with a mixture of the test formulation (hydrogel, or TMC control at 3.6% w/v) and the fresh medium. TEER measurements were taken at 15 min intervals over 2 h, after which time the sample in the apical chamber was replaced with fresh medium, and then for a further 2 h to assess recovery following the removal of the test formulation.Transport of the active
Transwell© inserts containing cell monolayers at confluence were equilibrated with medium (1 mL in each chamber) for 15 min. The medium was then discarded and the inserts were transferred into 12-well plates containing HBSS (pH 7.4, 1.5 mL) that had been supplemented with glucose (15 mM per well, basal chamber). The monolayers were incubated (37 °C, 10 min) in the drug-free transport medium. The test hydrogel (500 μL, pH 4.8–5.3) or TMC solution (500 μL, 3.6% w/v, pH 4–4.5), each containing insulin (3 mg mL−1), were added to the apical chamber and cells were incubated at 37 °C. Aliquots (100 μL) sampled from the basal chamber, at specified time intervals over 2 h, were replenished with fresh medium. Insulin transport was evaluated by means of the BCA assay. Apparent permeability coefficients (Papp,) for insulin in TMC solution, in the hydrogel and for aqueous insulin, were calculated, eqn (2):34 | (2) |
 | (3) |
Cytotoxicity study
The cytotoxicity of hydrogel formulations (undiluted, i.e. TMC 3.6% w/v, PEG 5.8% w/v and GP 2.5% w/v) and of TMC, PEG and GP solutions (at final concentrations as in the gel formulation 3.6, 5.8 and 2.5% w/v, respectively) was evaluated by means of an MTT assay on Calu-3 cells that had been seeded at a density of 104 cells per well into a 96-well plate and incubated in the culture medium for 2 days. Following removal of the culture medium, cells were exposed to the test solution (500 μL) and incubated for 2 hours at 37 °C; sodium dodecyl sulphate (SDS, 10 mg mL−1) provided the positive control whereas the culture medium acted as a reference for 100% cell viability. Subsequent to the removal of the mixture of the medium and the test solution, cells were washed with PBS and a freshly prepared solution of MTT in DMEM/F12 (200 μL, 0.5 mg mL−1) was added prior to incubation at 37 °C for 1 h. After this time, MTT solutions were removed from the wells and DMSO (400 μL) was added to facilitate the dissolution of the formazan crystals that had formed. Following 10 min continuous agitation, the absorbance was read at 570 nm. The statistical significance of the differences between the viability of Calu-3 monolayers that had been exposed to the hydrogel or to its components, as compared with the negative control (medium, 100% cell viability) was tested at the p < 0.05 level by one-way analysis of the variance (ANOVA) and further by the multiple comparison Tukey–Kramer test.In vivo studies
In vivo assessment of hypoglycaemic effect
For the intranasal testing of formulations and controls, diabetic rats were randomly separated into 6 treatment groups (n = 5), Table 1.| Group | Formulation | Insulin dose (IU kg−1) |
|---|---|---|
| 1 | Intranasal hydrogel solution | 0 |
| 2 | Intranasal hydrogel solution with insulin | 10 |
| 3 | Intranasal TMC solution | 0 |
| 4 | Intranasal TMC solution loaded with insulin | 10 |
| 5 | Intranasal insulin solution | 10 |
| 6 | Subcutaneous injection (100% bioavailability)7 | 1 |
Formulations (10 μL, 2.5 IU, equivalent to 10 IU kg−1 assuming an average weight of 250 g per animal) were administered into the right nostril of each rat (not anaesthetised) using a micropipette.7 Four rats received the subcutaneous injection (1 IU kg−1). Blood samples (4 drops) were collected in heparinised tubes prior to administration and then at specified intervals (0, 30, 60, 150, 270, 390, 520, 1320, 1800 and 2740 min) post dosing; rats (caged at 21 ± 2 °C and at 50–70% relative humidity) were allowed free access to food and water. The blood sample was phase separated by centrifugation (4000 rpm, 5 min) and the serum glucose level was determined, after dilution with distilled water (1:10), using the glucose Trinder Kit.36 The minimum blood glucose concentration (Cmin) and time to reach Cmin (Tmin) were noted, and the area under the serum glucose levels vs. time curve (AAC) was calculated (Microsoft Excel) using the trapezium rule approximation. The data collected allowed the estimation of the pharmacodynamic availability of nasally administered insulin, Fdyn:7,19,37
 | (4) |
Intranasal and subcutaneous administrations are respectively denoted by subscripts in and sc. Mean values of Cmin, Tmin, AAC and Fdyn with standard deviations (SD) were calculated for each group. Student's t-test and ANOVA were used to determine the statistical difference (p < 0.05).
Results and discussion
Consistent with the performance requirements for efficient drug delivery through the nose, the thermosensitive semi-rigid gel formulation has been designed such that it gels at ca. 35 °C (the temperature of the nasal cavity38) and within the MCC timescale (ca. 8 min from administration27) to exhibit rheologically synergistic interactions with nasal mucus, which in turn effect prolonged residence.In vitro release kinetics
The effectiveness of the thermosensitive hydrogel as a drug delivery device appropriate for its proposed use has been assessed by considering the release profile of incorporated insulin.39It appears (Fig. 1), that as the hydrogel system moves from the sol to the gel state it fails to entrap all available insulin: the cumulative increase in the concentration of insulin within the dialysis medium over the first 12 min of the experiment is ca. 70% of that added to the formulation, which, considering the time factor associated with the movement of insulin across the dialysis membrane, appears to correspond with the time that is required to effect gelation at 35 °C (ca. 8 min). Consistent with the assumption that there is a ca. 4 min time lag in the movement of insulin through the dialysis membrane, the insulin-release curve is characterised by three distinct regions (Fig. 1, demarcated more clearly by the inset plot of insulin % release vs. t0.5): an initial, slow-release region over the first 4 min of the experiment; a rapid-release region over the next 8 min; and a final stage of slow release, the onset of which is at ca. 12 min, that extends over the duration of the experiment (60 min). It is at this final stage that the release of insulin is assumed to be governed by the gel-state hydrogel. Consistent with super case II transport (drug diffuses out of the swollen system via a mechanism that is determined by the interaction between the polymeric system and the release media40), the data over the time period for the transition from sol to gel (2–12 min, Fig. 1) fit the Korsmeyer–Peppas equation at the n value of 1.91. By contrast, the segment of the plot demarcated by the 12 min and 60 min time points is characterised by the n value of 0.15, suggesting that the release of the insulin content of the gel-state system obeys first order kinetics,41 which is consistent39 with the pore size range of the hydrogel (4 nm to 100 nm27). Since the hydrodynamic radius of insulin is 1.3 nm, the pore size of the hydrogel is not considered to be a significant rate-limiting factor affecting diffusion.39
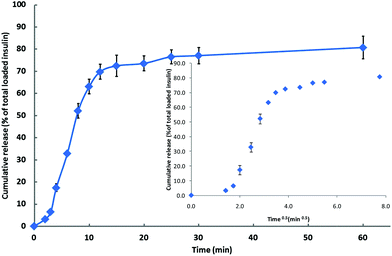 | ||
Fig. 1 Cumulative release of insulin ( ); mean ± SD (n = 4). Inset: % release vs. t0.5. ); mean ± SD (n = 4). Inset: % release vs. t0.5. | ||
Cell culture
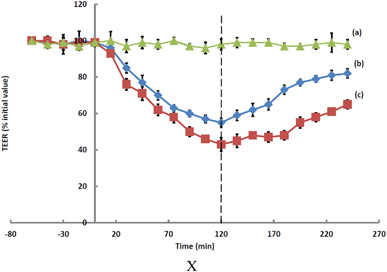 | ||
Fig. 2 Effect of (a) the media control ( ), (b) hydrogel ( ), (b) hydrogel ( ), and (c) TMC solution ( ), and (c) TMC solution ( ) on TEER values of Calu-3 monolayers; mean ± SD (n = 4). ) on TEER values of Calu-3 monolayers; mean ± SD (n = 4). | ||
It has been suggested that the capability of TMC to open tight junctions transiently is attributable to the disruption of the F-actin cytoskeleton protein through interactions involving the positive charges at the C-2 position of the molecular structure.42 The combination of TMC polymers with glycerophosphate is known7 to reduce the capacity of TMC to open tight junctions, which in turn impacts upon the efficiency of absorption enhancement. The rate of increase in TEER following the removal of the test samples was more pronounced for cultures exposed to the hydrogel than it was for cultures exposed to TMC, which may be reflective of corresponding cytotoxic effects.
In accord with expectation,44 data for the transport of insulin through Calu-3 cell monolayers treated with hydrogel or with TMC formulations, or with an aqueous solution of insulin, Fig. 3, show that TMC has a pronounced penetration-enhancing effect: 72% of the available insulin was seen to be transported across the monolayer over 2 h, which represents a greater than eightfold (R = 8.6) increase relative to that achieved with the aqueous solution of insulin (Table 2). This, however, may be reflective of a TMC-induced decrease in cell viability and/or of the disruption in the confluency of the monolayer. Over the same experimental period, the application of the hydrogel formulation effected a marked enhancement (R = 3.6) in the efficiency of insulin transport as compared with corresponding solutions of insulin.
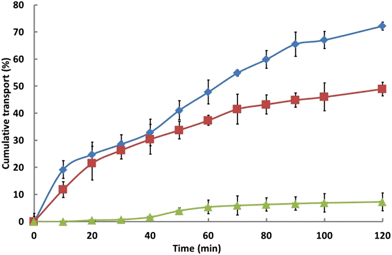 | ||
Fig. 3 Cumulative transport of insulin from a TMC solution ( ), the hydrogel ( ), the hydrogel ( ) and from an aqueous insulin solution ( ) and from an aqueous insulin solution ( ); mean ± SD (n = 4). ); mean ± SD (n = 4). | ||
| Formulation | P app (×10−5 cm s−1) | R |
|---|---|---|
| Insulin TMC solution | 20.1 ± 0.1 | 8.6 |
| Insulin hydrogel formulation | 9.4 ± 1.7 | 3.6 |
| Insulin aqueous solution | 2.4 ± 0.6 | 1.0 |
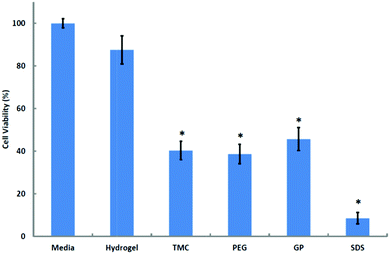 | ||
| Fig. 4 Cytotoxicity assay of hydrogel and components on Calu-3 monolayers. Results are presented as means ± SD (n = 4). *p < 0.001 with respect to media, 100% viability; Tukey–Kramer post hoc comparison test. | ||
The observed 60% reduction in cell viability induced by the 36 mg mL−1 solution of TMC (32.8% DQ) is in marked contrast with reports that suggest that TMC has little or no cytotoxic effect,43–45 and supports the findings of Amidi et al.30 who showed that a 20 mg mL−1 solution of TMC (25% DQ) reduces Calu-3 cell viability by approximately 30%. The observation that formulations of chitosan exhibit lower cytotoxicity than each of its components (88% cell viability, not significantly different from the media control, Fig. 4) is in accord with the findings of Kim et al.,46 who observed the toxic effects of GP solutions on cancer cells and also demonstrated the increased viability of cells treated with a thermosensitive hydrogel that had been formulated from chitosan and GP relative to that of cells treated with GP alone. Towards a further evaluation of cytotoxicity, the hydrogel and each of its components were investigated for their effect on Calu-3 cell viability through staining with propidium iodide (a membrane-impermeant dye) and subsequent imaging with CLSM. The images confirmed that incubation with TMC solution causes considerable damage to the monolayer, as is demonstrated by the visualised uptake of propidium iodide by the nuclei of Calu-3 cells (ESI, Fig. 6s†), but this damage is not as pronounced as that caused by SDS. The degree of cell-wall disruption in monolayers that had been treated with the hydrogel was similar to that of controls that had been treated with Media 199. These observations are consistent with the hypothesis that the reduction in TEER seen in monolayers that had been treated with the hydrogel was not related to cell-membrane damage, as may have been the case for TMC-treated monolayers, and support the assertion that the hydrogel promotes the paracellular transport of insulin via the opening of tight junctions.
In vivo studies
The control experiment (intranasal instillation of aqueous FluoSphere© suspension) has shown that the clearing time is consistent with that expected from a normally functioning MCC: ca. 90% is cleared within 20 min, Fig. 5; the reported clearance rate for nasal mucus in the rat is 15–20 min.13,14 The hydrogel exhibited a significant capacity to effect a reduction in the rate of MCC: FluoSphere© clearance following application from the hydrogel formulation was significantly slower than that for the control, with only ca. 30% of the FluoSphere© content being cleared over 20 min. This rate of MMC clearance became slower after 20 min, presumably as a consequence of the formulation being in its gel state (at the temperature of the nasal cavity the sol-to-gel transition occurs within ca. 8 min27): at 120 min following intranasal administration ca. 50% of the administered FluoSphere© content is still in the nasal cavity, as is consistent with the bioadhesive nature of TMC27,47,48 and the viscous nature of the hydrogel.
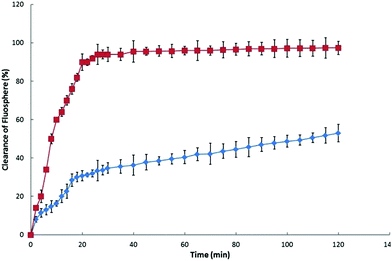 | ||
Fig. 5 The recovery (clearance) of FluoSpheres© following the intranasal administration of ( ) FluoSphere© solution and ( ) FluoSphere© solution and ( ) TMC hydrogel. Mean ± SD, n = 3. ) TMC hydrogel. Mean ± SD, n = 3. | ||
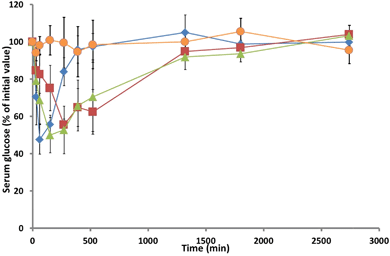 | ||
Fig. 6 Serum glucose levels in rats monitored over 2 days following administration of: ( ) insulin hydrogel; ( ) insulin hydrogel; ( ) insulin TMC solution; ( ) insulin TMC solution; ( ) TMC solution, and ( ) TMC solution, and ( ) insulin subcutaneous injection. Mean ± SD, n = 5. ) insulin subcutaneous injection. Mean ± SD, n = 5. | ||
| Formulation | T min (min) | C min (% initial value) | AACb (% glucose min) | AAC a (% glucose min) | F dyn (%) |
|---|---|---|---|---|---|
| a 2740 min. b 390 min. | |||||
| Insulin sca | 60 | 48 ± 8 | 13252 ± 1261 |
22059 ± 9303 |
100 ± 42 |
| Insulin hydrogela | 270 | 55 ± 3 | 11538 ± 2842 |
37752 ± 5294 |
17 ± 2 |
| Insulin TMC solutiona | 150 | 50 ± 10 | 15467 ± 3203 |
37072 ± 10542 |
17 ± 4 |
| Insulin solutionb | 210 | 98 ± 5 | 141 ± 32 | 0 | |
| Hydrogelb | 330 | 98 ± 7 | 270 ± 57 | 0 | |
| TMC solutionb | 150 | 98 ± 6 | 210 ± 48 | 0 | |
The return to baseline was slow, with levels returning to their basal state at ca. 24 hours. Hence, it may be claimed that the TMC preparation is a promising candidate for further evaluation in the controlled release of nasally administered insulin. The hydrogel delivery system also achieved a Cmin of 50%, which is comparable to that of the sc injection or that of the TMC solution, but this minimum was achieved at ca. 270 min (respectively 210 min and 120 min later than those seen following the sc injection or the nasal administration of the TMC solution). The subsequent increase in serum glucose was observed to occur at a similar rate to that observed with the TMC solution, returning to basal glucose concentration at ca. 24 hours. However, one of the rats that had been administered with intranasal TMC solution died 9 h after administration; while the reasons for the death of the animal are not known, this event highlights the need for the further toxicological evaluation of the formulation.
Calculated with reference to the sc injection group, the pharmacodynamic availabilities (Fdyn) of insulin that had been delivered intranasally via hydrogel or in TMC solution were not statistically different (respectively (17 ± 2)% and (17 ± 4)%), but much higher than that achieved with insulin solution (0%). Since there was no statistically significant variation in age, weight or basal serum glucose levels in the diabetic rats employed for this investigation, it is assumed that the administered insulin formulations were responsible for the induced hypoglycaemic response.10 The Fdyn value, Table 3, determined for the intranasal administration of insulin into rats using the TMC hydrogel is similar to those reported for the administration of insulin via chitosan solution (15%),7 chitosan gel (18%),10 chitosan/PVA gel (9%),4 or derivatised chitosan (HTCC)-PEG hydrogel (7%).19 The observed prolonged lowering of glucose levels manifested by the pharmacodynamic availability of insulin from TMC solution or from the TMC hydrogel formulation is consistent with earlier observations that have demonstrated the capability of TMC to disrupt the integrity of Calu-3 monolayers.27 Barichello et al.49 have shown that the sc administration into healthy rats of insulin in Pluronic F127 gels or in gels containing insulin-PGLA nanoparticles effects a prolonged hypoglycaemic effect, which is analogous to that effected by the TMC hydrogel formulation (Cmin of ca. 40% at 3 h; serum glucose levels at ca. 60% of basal at 6 h from administration). Dyer et al.5 have reported that insulin-loaded chitosan nanoparticles, which exhibit a Cmin of 50–60% at ca. 2 h and possess a Fdyn of ca. 37%, do not offer any advantage over an intranasal insulin solution of chitosan (Cminca. 40% after approx. 90 min, and Fdynca. 48%). While the animal-modelled testing of insulin from nanoparticulate chitosan, TMC hydrogel and TMC intranasal solution highlights the promise of all three formulations in the treatment of diabetes (all effecting insulin bioavailabilities of ca. 17%, with rat-modelled data showing more promise than those modelled in sheep5), their relative merits for the treatment of the human condition can only be assessed in the clinic.
Conclusion
In vivo experiments in the rat model have demonstrated that an in situ thermogelling nasal formulation of TMC is capable of residing in the nasal mucosa over time scales that far exceed those of mucus turnover. The same formulation has been shown to affect the controlled delivery of insulin, as demonstrated by a diabetic-rat-modelled in vivo reduction in blood glucose over ca. 24 hours. The data highlight the potential of the formulation as a once-a-day dosage form for the delivery of insulin through the nasal route.Notes and references
- L. du Plessis, A. Kotze and H. Junginger, Drug Delivery, 2010, 17, 399–407 CrossRef CAS.
- X. G. Zhang, H. J. Zhang, Z. M. Wu, Z. Wang, H. M. Niu and C. X. Li, Eur. J. Pharm. Biopharm., 2008, 68, 526–534 CrossRef CAS.
- J. Wang, Y. Tabata and K. Morimoto, J. Controlled Release, 2006, 113, 31–37 CrossRef CAS.
- A. K. Agrawal, P. N. Gupta, A. Khanna, R. K. Sharma, H. K. Chandrawanshi, N. Gupta, U. K. Patil and S. K. Yadav, Pharmazie, 2010, 65, 188–193 CAS.
- A. M. Dyer, M. Hinchcliffe, P. Watts, J. Castile, I. Jabbal-Gill, R. Nankervis, A. Smith and L. Illum, Pharm. Res., 2002, 19, 998–1008 CrossRef CAS.
- T. J. Aspden, L. Illum and O. Skaugrud, Eur. J. Pharm. Sci., 1996, 4, 23–31 CrossRef CAS.
- S. Y. Yu, Y. Zhao, F. L. Wu, X. Zhang, W. L. Lu, H. Zhang and Q. Zhang, Int. J. Pharm., 2004, 281, 11–23 CrossRef CAS.
- K. Morimoto, K. Morisaka and A. Kamada, J. Pharm. Pharmacol., 1985, 37, 134–136 CrossRef CAS.
- R. D'Souza, S. Mutalik, M. Venkatesh, S. Vidyasagar and N. Udupa, AAPS PharmSciTech, 2005, 6, E184–E189 CrossRef.
- T.-W. Chung, D.-Z. Liu and J.-S. Yang, Carbohydr. Polym., 2010, 82, 316–322 CrossRef CAS.
- B. Luppi, F. Bigucci, T. Cerchiara and V. Zecchi, Expert Opin. Drug Delivery, 2010, 7, 811–828 CrossRef CAS.
- L. Jiang, L. Gao, W. X. L. Tang and J. Ma, Drug Dev. Ind. Pharm., 2010, 36, 323–336 CrossRef CAS.
- A. Pires, A. Fortuna, G. Alves and A. Falcao, J. Pharm. Pharm. Sci., 2009, 12, 288–311 CAS.
- L. Illum, J. Controlled Release, 2003, 87, 187–198 CrossRef CAS.
- X. P. Duan and S. R. Mao, Drug Discovery Today, 2010, 15, 416–427 CrossRef CAS.
- N. M. Zaki, G. A. Awad, N. D. Mortada and S. S. Abd ElHady, Eur. J. Pharm. Sci., 2007, 32, 296–307 CrossRef CAS.
- P. Artusson, T. Lindmark, S. S. Davis and L. Illum, Pharm. Res., 1994, 11, 1358–1361 CrossRef.
- H. L. Luessen, B. J. De-Leeuw, M. Langemeyer, A. G. De Boer, J. C. Verhoef and H. E. Unginger, Pharm. Res., 1996, 13, 1668–1672 CrossRef CAS.
- J. Wu, W. Wei, L.-Y. Wang, Z.-G. Su and G.-H. Ma, Biomaterials, 2007, 28, 2220–2232 CrossRef CAS.
- J. Varshosaz, H. Sadrai and A. Heidari, Drug Delivery, 2006, 13, 31–38 CrossRef CAS.
- S. B. Rao and C. P. Sharma, J. Biomed. Mater. Res., 1997, 34, 21–28 CrossRef CAS.
- R. Chen and H. C. Chen, Adv. Chitin Sci., 1998, 3, 16–23 Search PubMed.
- C. Muzzarelli, Cell. Mol. Life Sci., 1997, 53, 131–140 CrossRef.
- S. Hirano, H. Seino, Y. Akiyama and I. Nonaka, Polym. Eng. Sci., 1988, 59, 897–901 CAS.
- S. Hirano and Y. Noishiki, J. Biomed. Mater. Res., 1985, 19, 413–417 CrossRef CAS.
- C.-M. Lehr, J. A. Bouwstra and E. H. Schacht, Int. J. Pharm., 1992, 78, 43–48 CrossRef CAS.
- H. Nazar, D. G. Fatouros, S. M. van der Merwe, N. Bouropoulos, G. Avgouropoulos, J. Tsibouklis and M. Roldo, Eur. J. Pharm. Biopharm., 2011, 77, 225–232 CrossRef CAS.
- Y. Chang, L. Xiao and Y. Du, Polym. Bull., 2009, 63, 531–545 CrossRef CAS.
- R. U. Agu, H. V. Dang, M. Jorissen, T. Willems, R. Kinget and N. Verbeke, Int. J. Pharm., 2002, 237, 179–191 CrossRef CAS.
- M. Amidi, S. G. Romeijn, G. Borchard, H. E. Junginger, W. E. Hennink and W. Jiskoot, J. Controlled Release, 2006, 111, 107–116 CrossRef CAS.
- C. Witschi and R. J. Mrsny, Pharm. Res., 1999, 16, 382–390 CrossRef CAS.
- B. Q. Shen, W. E. Finkbeiner, J. J. Wine, R. J. Mrsny and J. H. Widdicombe, Am. J. Physiol., 1994, 266, L493–L501 CAS.
- D. Cremaschi, C. Porta and R. Ghirardelli, News Physiol. Sci., 1997, 12, 219–225 CAS.
- R. W. Korsmeyer, R. Gurny, E. Doelker, P. Buri and N. A. Peppas, Int. J. Pharm., 1983, 15, 25–35 CrossRef CAS.
- M. Donovan and Z. Mengping, Int. J. Pharm., 1995, 116, 77–86 CrossRef CAS.
- P. Caliceti, F. M. Veronese and S. Lora, Int. J. Pharm., 2000, 211, 57–65 CrossRef CAS.
- A. H. Krauland, V. M. Leitner, V. Grabovac and A. B. Schnch, J. Pharm. Sci., 2006, 95, 2463–2472 CrossRef CAS.
- D. Elad, M. Wolf and T. Keck, Respir. Physiol. Neurobiol., 2008, 163, 121–127 CrossRef.
- N. Bhattarai, J. Gunn and M. Zhang, Adv. Drug Delivery Rev., 2010, 62, 83–99 CrossRef CAS.
- P. I. Lee and C. J. Kim, J. Controlled Release, 1991, 16, 229–236 CrossRef CAS.
- J. Andersson, J. Rosenholm and M. Linden, in Topics in Multifunctional Biomaterials and Devices, ed. N. Ashammakhi, Finland, 2008, vol. 1 Search PubMed.
- J. K. Sahni, S. Chopra, F. J. Ahmad and R. K. Khar, J. Pharm. Pharmacol., 2008, 60, 1111–1119 CrossRef CAS.
- M. Thanou, A. F. Kotze, T. Scharringhausen, H. L. Luessen, A. G. de Boer, J. C. Verhoef and H. E. Junginger, J. Controlled Release, 2000, 64, 15–25 CrossRef CAS.
- M. Thanou, J. C. Verhoef and H. E. Junginger, Adv. Drug Delivery Rev., 2001, 50, S91–S101 CrossRef CAS.
- M. M. Thanou, J. C. Verhoef, S. G. Romeijn, J. F. Nagelkerke, F. Merkus and H. E. Junginger, Int. J. Pharm., 1999, 185, 73–82 CrossRef CAS.
- S. Kim, S. K. Nishimoto, J. D. Bumgardner, W. O. Haggard, M. W. Gaber and Y. Yang, Biomaterials, 2010, 31, 4157–4166 CrossRef CAS.
- F. Chen, Z. R. Zhang and Y. Huang, Int. J. Pharm., 2007, 336, 166–173 CrossRef CAS.
- D. Snyman, J. H. Hamman and A. F. Kotze, Drug Dev. Ind. Pharm., 2003, 29, 61–69 CrossRef CAS.
- J. M. Barichello, M. Morishita and K. T. T. Nagai, Int. J. Pharm., 1999, 184, 189–198 CrossRef CAS.
Footnotes |
| † Electronic supplementary information (ESI) available: Confocal light microscopy images of propidium iodide staining of the Transwell© inserts to visualise cell death. Glucose-lowering effects of non-insulin loaded intranasal formulations have also been presented. See DOI: 10.1039/c2bm00132b |
| ‡ Present address: Department of Pharmacy, Health and Wellbeing, University of Sunderland, Sunderland, Tyne and Wear, SR1 3SD, UK. |
| This journal is © The Royal Society of Chemistry 2013 |