 Open Access Article
Creative Commons Attribution 3.0 Unported Licence
Microscale separation of immiscible liquids using a porous capillary†
James H. Bannock,
Thomas W. Phillips,
Adrian M. Nightingale and
John C. deMello*
Centre for Plastic Electronics, Department of Chemistry, Imperial College London, Exhibition Road, South Kensington, London SW7 2AZ, UK. E-mail: j.demello@imperial.ac.uk
First published on 19th August 2013
Abstract
We describe a simple method for the direct inline separation of two immiscible liquids based on the selective wetting and permeation of a porous polytetrafluoroethylene capillary by one of the liquids. Using water dispersed in fluorous carrier fluid as a test system, quantitative recovery of the water from the carrier fluid is achieved over a wide range of flow conditions, with no contamination by the fluorous component even when present in large (ten-fold) excess. The exiting water stream may be readily redispersed by injecting additional carrier fluid downstream, allowing for repeated switching between the segmented and continuous flow regimes – a critical requirement for multistep chemical processing. The separator is shown to simplify in-line sample analysis by allowing measurements to be carried out quasi-statically without the need for fast instrumentation synchronised to the segmented water flow.
Segmented flow microchemistry involves the co-injection of two immiscible fluids into a narrow channel, causing one or both components to divide into a succession of discrete dimensionally confined slugs or droplets. Whilst segmented flow may be achieved using both liquid–gas and liquid–liquid mixtures,1 the latter have been more widely applied due to their easier implementation and superior resilience to reactor fouling. One liquid is typically used as the solvent for the chemical species of interest, while the other acts as an inert carrier that maintains the discrete nature of the solvent flow. Key advantages of segmented flow over continuous flow include: improved flow uniformity, superior synthetic/analytic control due to lower sample volumes, and reduced susceptibility to fouling.‡2
The applications of segmented flow are well documented1,3–7 and we make no attempt to review them here. We note however that the general progress of segmented flow microchemistry has been hindered by the scarcity of simple and effective methods for achieving rapid in-line liquid–liquid phase separation.8–10 The fast and efficient separation of a solvent from a carrier is a critical step in many microscale synthetic and analytic processes. Key applications of liquid–liquid separation include: (i) multistep chemical processing, where it may be impractical or impossible to carry out every step within the segmented flow regime; (ii) in-line analysis, where switching to continuous flow can greatly simplify detection by removing the need for sophisticated high speed detectors synchronised to the segmented solvent flow; (iii) purification, where an analyte of interest is extracted by preferential dissolution in one of the two phases; and (iv) product collection, where it may be necessary to divert the carrier fluid away from the solvent stream prior to product collection, e.g. to allow for carrier recirculation.
Existing methods for achieving liquid–liquid separation on the microscale typically fall into two main categories: gravity-based methods,11–13 which exploit differences in density to separate the two phases; and wetting-based methods10,14–22 that exploit differences in affinity to a surface or membrane. In a typical gravity-based configuration the two-phase flow is introduced into a separating chamber with vertically offset outlets; the denser of the two liquids sinks to the bottom of the chamber and exits by the lower outlet, while the less dense liquid exits by the upper outlet. In practice gravity-based devices have rather high dead-volumes (>1 ml) since the efficiency of phase-separation increases with the weight of amassed fluid. In consequence they are best suited to situations where large amounts of solvent are collected over extended periods of time. For microscale applications involving only small quantities of solvent, wetting-based methods are preferable since phase separation is induced by interfacial rather than gravitational forces, removing the need to accumulate large volumes of fluid.
Various wetting-based microscale separators have been reported in the literature. Kashid et al. reported a simple oil–water separator using a one-inlet/two-outlet polytetrafluoroethylene (PTFE) Y-piece with a hydrophilic steel needle inserted into one outlet to induce the phase separation.23 They reported reasonable separation efficiencies of the oil (n-butyl formate) and aqueous phases over a range of flow speeds and ratios but noted that the aqueous phase was frequently contaminated by small oil droplets. Using a similar approach Scheiff et al. reported modest separation efficiencies for 1![[thin space (1/6-em)]](https://www.rsc.org/images/entities/char_2009.gif) :
:![[thin space (1/6-em)]](https://www.rsc.org/images/entities/char_2009.gif) 1 mixtures of water and kerosene or paraffin oil, using a hydrophilic metal needle inserted into the side of a polyolefin channel to extract the aqueous component.14 Results were presented for one solvent flow rate and one carrier flow rate only.
1 mixtures of water and kerosene or paraffin oil, using a hydrophilic metal needle inserted into the side of a polyolefin channel to extract the aqueous component.14 Results were presented for one solvent flow rate and one carrier flow rate only.
Kolehmainen and Turunen reported a plate-based “coalescer”, comprising a top plate of hydrophobic PTFE and a bottom plate of hydrophilic stainless steel, into which a 100 μm deep channel was micromachined.15 Injecting an equimolar droplet stream of water in oil (Shellsol DHP and tris(2-ethylhexyl)phosphate) into the coalescer resulted in quantitative separation of oil and water across a broad range of flow rates from 0.5 to 8 ml min−1, but no results were reported for the case of imbalanced oil and water streams. Gaakeer et al. reported a similar device in which a slug flow of water and heptane was separated by forcing the incoming stream through a narrow spacing between glass and teflon surfaces.16 Good separation efficiencies were reported, although again results were limited to equal flow rates of water and oil.
A closely related approach involves the use of array-based architectures to drain one component from a segmented flow. Castell et al. used an array of high aspect ratio separation ducts laser machined from PTFE to separate chloroform and water injected at equal flow-rates of up to 0.2 ml min,17 while Niu et al. used a passive pillar array in polydimethylsiloxane to remove fluorinated oil (FC40) oil from aqueous droplets under fixed flow conditions.18 Both approaches were reported to perform well under the narrow range of flow conditions investigated.
Nord and Karlberg reported one of the earliest uses of a flat porous membrane for the separation of aqueous–organic mixtures, using a PTFE filter sandwiched between two pieces of grooved perspex.19 Atallah et al. later used the same general approach to extract copper from water by phase separating a segmented flow of an aqueous copper solution and zinc diethyldithiocarbamate in chloroform.10 They observed that, at low chloroform-to-water ratios, higher separation efficiencies could be achieved by actively pumping the organic phase from the separator to increase the pressure differential across the membrane, although some loss of chloroform into the outflowing water stream was typically observed. More recently Kralj et al. and Adamo et al. reported a similar porous membrane-based device for liquid–liquid extraction, comprising a flat PTFE filter sandwiched between two slabs of grooved polycarbonate.20–22 The separator was reported to be capable of inducing complete phase separation of water-in-oil and water-in-fluorous-oil systems when the two components were injected at equal rates. The separation of organic and fluorous oils was also attempted using the same device but was unsuccessful due to an insufficient difference in the surface wetting by the two phases.20
Whilst the above separators have been shown to be effective for certain liquid–liquid mixtures under specific flow conditions, there is a continuing need for a more versatile separation technology that works reliably with multiple solvent–carrier combinations across a broad range of flow rates and that can be readily integrated with both chip- and capillary-based devices. Our approach falls into the general category of wetting-based separation, relying on differences in affinity to a porous PTFE membrane to achieve the desired phase separation. In contrast to previous microfluidic separators, the membrane is a porous capillary formed by a modified extrusion process, in which forced expansion of the PTFE during extrusion leads to the formation of μm-sized pores throughout the capillary walls.24 The porous PTFE capillaries used for this work are supplied by Zeus Industrial Products under the trade-name Aeos and are available in a range of inner diameters down to 355 μm. Common applications include filtration, fibre-optic shielding, insulation, and breathable sheathing and packaging.
The use of porous capillaries for phase separation has some precedence. Porous PTFE capillaries have previously been applied to gas and liquid extraction in Inductively Coupled Plasma Mass Spectroscopy (ICP-MS),25 while porous polypropylene capillaries have been used in Gas-Phase Chromatography (GC) to extract an organic phase from an aqueous–organic mixture.26 However, there are very few reports of their use outside these fields, and to our knowledge porous capillaries have not previously been integrated with either chip- or capillary-based microfluidic componentry. In use, we have found that capillary-based separators offer considerable advantages over other wetting-based architectures, including low dead volumes, rapid flow stabilisation, high solvent recovery rates and compatibility with a broad range of solvent–carrier combinations over a wide range of flow conditions.
For ease of integration with both chip- and capillary-based microreactors we configure our separators as discrete modules that can be coupled to existing flow systems using standard microfluidic fittings. Porous PTFE has a soft rubbery consistency that prevents direct coupling to other microfluidic components. To overcome this limitation the two ends of the porous tubing are pulled partway over short lengths of conventional rigid PTFE tubing of matching outer diameter and the interlocking tubes are fixed in place with a small amount of adhesive (see Fig. 1a and Methods). By ensuring the adhesive is applied locally at the extremities of the porous tubing, contact between the flowing liquids and the glue is avoided, allowing the bond to remain intact regardless of the choice of solvent or carrier fluid.
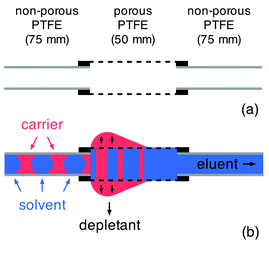 | ||
| Fig. 1 Principle of the capillary-based liquid–liquid separator: (a) the separator is formed by inserting regular PTFE tubing (1 mm ID, 2 mm OD) a short distance (5 mm) into each end of a 60 mm length of porous PTFE tubing (1.8 mm ID, 2.5 mm OD, 15–25 μm pore size), leaving a 50 mm length of the porous tubing exposed in the middle; (b) the segmented flow is injected into the porous PTFE channel, where the carrier fluid preferentially wets the capillary wall and is depleted through the pores; the solvent passes through the capillary unaffected and is eluted from the exit channel. | ||
The principle of the separator is straightforward (see Fig. 1b). The carrier fluid is chosen to have a greater affinity for the porous tubing than the solvent, causing it to wet and subsequently permeate the porous wall. The permeating carrier fluid seeps out of the wall of the tubing and collects on the exterior where it accumulates until it is of sufficient weight to drip from the capillary into a collection vial. This process repeats with new carrier fluid collecting on the exterior of the capillary until the next drip occurs, allowing carrier fluid to be extracted indefinitely from the channel without any drop in separation efficiency. Providing the porous tubing is of a sufficient length to allow complete depletion of the carrier fluid, a continuous stream of pure solvent is left flowing through the porous tubing and will emerge at the outlet. The outflowing solvent may then be transferred to a collection vial or passed into the next stage of a multistep chemical process as required.
The performance of the separator was investigated using a segmented flow of water and a fluorous oil.§ For the work reported here, we specifically selected Galden HT-170 perfluorinated polyether (PFPE, Solvay Solexis) as the carrier fluid, although other fluorous oils may also be used providing the porosity of the membrane is suitably adjusted. (Higher viscosity liquids require the use of higher porosity capillary membranes.) The segmented flow was generated by injecting the two liquids into the inlets of a two-input PTFE droplet generator (see Methods). The outlet of the droplet generator was in turn connected to the inlet of the separator by a short length of (non-porous) PTFE tubing, shown schematically in Fig. 2a.
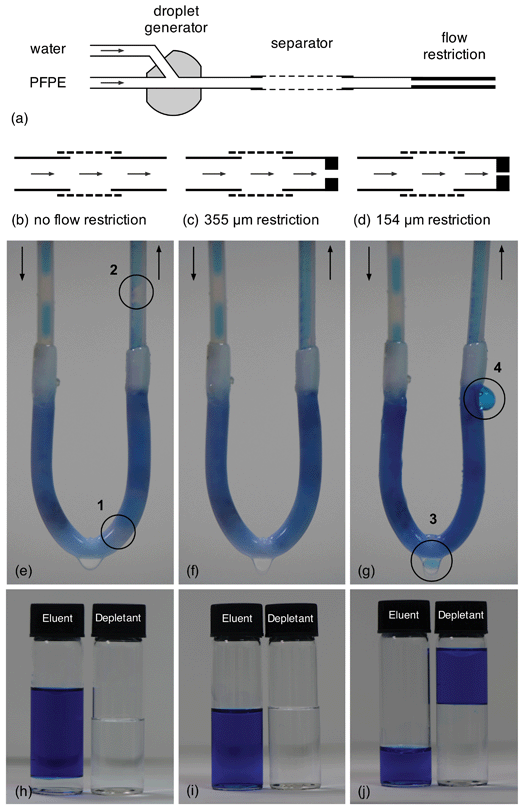 | ||
| Fig. 2 The effect of backpressure on separator performance: (a) schematic of experimental set-up, showing droplet generator, separator and flow restriction at separator outlet; (b) schematic of separator with no flow restriction; (c) schematic of separator with 50 mm, 355 μm ID FEP flow restriction at outlet; (d) schematic of separator with 50 mm, 154 μm ID FEP flow restriction at outlet; (e) photograph showing the passage of water and PFPE through the separator at equal flow-rates of 500 μl min−1 with no flow restriction; the circled areas 1 and 2 show undepleted PFPE passing through the separator and contaminating the eluent; (f) photograph showing the passage of water and PFPE through the separator at equal flow-rates of 500 μl min−1 with 355 μm ID flow restriction in place; complete phase separation is achieved; (g) photograph showing the passage of water and PFPE through the separator at equal flow-rates of 500 μl min−1 with 154 μm ID flow restriction in place; the circled areas 3 and 4 show water being depleted through the separator wall, resulting in <100% recovery at the outlet; (h–j) vials of eluent and depletant collected over ten minute periods for configurations (b–d). Water has been dyed blue for clarity. | ||
To achieve reliable phase separation an appropriate back pressure must be established within the separator: if it is too low, a fraction of the carrier fluid will pass through the entire length of the porous tubing without being depleted through the walls, causing a mixture of carrier and solvent to emerge at the outlet; while if it is too high a fraction of the solvent will be forced through the walls, leading to incomplete recovery. Fig. 2e–g show photographs of the separator in action under different back pressures induced by inserting short lengths of narrow-bore tubing at the separator outlet (see Fig. 2b–d). Also shown in Fig. 2h–j are corresponding photographs of the fluids collected at the separator outlet (the ‘eluent’) and through the separator walls (the ‘depletant’). The water was dyed blue to aid visibility. Fig. 2e shows the performance of the separator when its outlet is in direct contact with the atmosphere (resulting in an exit pressure of 1 atm). As expected the PFPE carrier fluid preferentially wets the porous PTFE tubing, from where it is extracted into the depletant vial. However, owing to the low viscosities of water and Galden HT-170 and the short/wide dimensions of the porous capillary, the back pressure is insufficient to cause complete depletion of the carrier. A significant quantity of carrier fluid therefore passes through the capillary (see regions marked 1 and 2) into the collection vial alongside the water, resulting in imperfect separation as seen in Fig. 2h.
Fig. 2f shows an equivalent photograph for the same separator with a 50 mm section of 355 μm ID fluorinated ethylene propylene (FEP) tubing now inserted into the separator outlet (see Fig. 2c). The increased backpressure induced by the narrow-bore FEP tubing is sufficient to ensure full extraction of the carrier fluid through the channel walls, resulting in pure water at the separator outlet and pure carrier fluid in the depletant vial (see Fig. 2i). It is in this optimised configuration that the separator is typically operated.
Fig. 2g shows a third photograph with a 50 mm length of 154 μm ID FEP tubing coupled to the outlet (see Fig. 2d). The 154 μm tubing induces an excessive back pressure in the system and leads to visible loss of water through the walls of the reactor (see regions denoted 3 and 4) since it is now easier for the water to leak through the separator walls than pass through the narrow constriction at the outlet. As a result more water collects (alongside the carrier fluid) in the depletant vial than in the eluent vial (see Fig. 2j).¶
Importantly, we have found a 50 mm section of porous PTFE combined with a 50 mm, 355 μm FEP flow restriction at the separator outlet provides excellent phase separation across a wide range of flow rates and solvent–carrier combinations. All subsequent measurements in this paper were obtained with the 355 μm flow restriction in place. A detailed analysis of the separation characteristics using different solvents and carrier fluids will be presented in a follow-up paper. Here we focus exclusively on the separation of water from HT-170 PFPE, noting simply that we have obtained comparable results using a variety of aqueous–organic, aqueous–fluorous and organic–fluorous solvent–carrier combinations.
Quantitative measurements of the separator performance (with the 355 μm flow restrictor in place) were carried out over a broad range of total flow-rates from 100 to 1600 μl min−1, using equal injection rates for water and PFPE. After each change of flow rate the flow was allowed to stabilise for five minutes, and the eluent was then collected over a five minute period and weighed. Since no PFPE was visible in the collection vial for any of the measurements, the mass of collected water was converted to a volumetric collection rate by dividing through by the density and the collection time. Plotting the volumetric collection rate versus the volumetric injection rate yielded a straight line graph of unity slope as shown in Fig. 3a, consistent with 100% recovery of the aqueous phase over the full range of flow rates investigated.
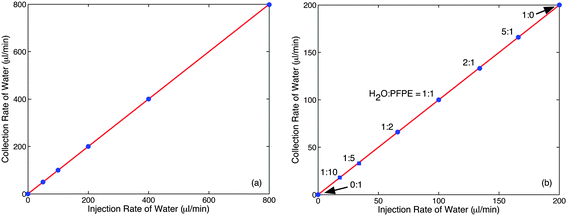 | ||
| Fig. 3 Influence of flow conditions on separator performance with 355 μm flow restriction in place (Fig. 2c): (a) volumetric collection rate of water versus volumetric injection rate of water, using equal flow rates of water and PFPE; (b) volumetric collection rate of water versus volumetric injection rate of water, using a fixed total flow rate of 200 μl min−1 for water plus PFPE. The regression line has a slope of unity in both cases, indicating full (100%) recovery of water. | ||
To quantify the performance of the separator with imbalanced solvent and carrier flow rates, the total flow rate was fixed at 200 μl min−1 and measurements were made using the same set-up as before at the following water-to-PFPE flow rate ratios: 5![[thin space (1/6-em)]](https://www.rsc.org/images/entities/char_2009.gif) :
:![[thin space (1/6-em)]](https://www.rsc.org/images/entities/char_2009.gif) 1, 2
1, 2![[thin space (1/6-em)]](https://www.rsc.org/images/entities/char_2009.gif) :
:![[thin space (1/6-em)]](https://www.rsc.org/images/entities/char_2009.gif) 1, 1
1, 1![[thin space (1/6-em)]](https://www.rsc.org/images/entities/char_2009.gif) :
:![[thin space (1/6-em)]](https://www.rsc.org/images/entities/char_2009.gif) 1, 1
1, 1![[thin space (1/6-em)]](https://www.rsc.org/images/entities/char_2009.gif) :
:![[thin space (1/6-em)]](https://www.rsc.org/images/entities/char_2009.gif) 2, 1
2, 1![[thin space (1/6-em)]](https://www.rsc.org/images/entities/char_2009.gif) :
:![[thin space (1/6-em)]](https://www.rsc.org/images/entities/char_2009.gif) 5 and 1
5 and 1![[thin space (1/6-em)]](https://www.rsc.org/images/entities/char_2009.gif) :
:![[thin space (1/6-em)]](https://www.rsc.org/images/entities/char_2009.gif) 10. Collection times of five minutes were used for the first four flow conditions and twenty minutes for the last two to enable sufficient water to amass in the collection vial for a reliable weight determination. No PFPE was visible in the collection vial for any of the conditions investigated so as before the measured mass was converted to a volumetric collection rate by dividing through by the density and the collection time. Plotting the volumetric collection rate of water versus the volumetric injection rate again yielded a straight line of unity slope, consistent with 100% recovery of the aqueous phase at all water
10. Collection times of five minutes were used for the first four flow conditions and twenty minutes for the last two to enable sufficient water to amass in the collection vial for a reliable weight determination. No PFPE was visible in the collection vial for any of the conditions investigated so as before the measured mass was converted to a volumetric collection rate by dividing through by the density and the collection time. Plotting the volumetric collection rate of water versus the volumetric injection rate again yielded a straight line of unity slope, consistent with 100% recovery of the aqueous phase at all water![[thin space (1/6-em)]](https://www.rsc.org/images/entities/char_2009.gif) :
:![[thin space (1/6-em)]](https://www.rsc.org/images/entities/char_2009.gif) PFPE flow-rate ratios.
PFPE flow-rate ratios.
To demonstrate the application of the separator to online monitoring, a simple dilution experiment was carried out. Two syringes, one containing pure water and the other containing a 214 μM aqueous solution of Brilliant Green dye (Aldrich), were pumped into the two inlets of a low dead-volume static Y-shaped mixer (Upchurch Scientific), keeping the total flow-rate of dye solution and water fixed at 100 μl min−1 but varying the ratio between the two. The outlet of the static mixer was fed into one inlet of the droplet generator while PFPE was fed into the other at a flow rate of 100 μl min−1. The output of the droplet generator was fed into the liquid–liquid separator as before. The flow-rate ratio of dye solution to water was varied in the following ratios 0![[thin space (1/6-em)]](https://www.rsc.org/images/entities/char_2009.gif) :
:![[thin space (1/6-em)]](https://www.rsc.org/images/entities/char_2009.gif) 1, 1
1, 1![[thin space (1/6-em)]](https://www.rsc.org/images/entities/char_2009.gif) :
:![[thin space (1/6-em)]](https://www.rsc.org/images/entities/char_2009.gif) 3, 1
3, 1![[thin space (1/6-em)]](https://www.rsc.org/images/entities/char_2009.gif) :
:![[thin space (1/6-em)]](https://www.rsc.org/images/entities/char_2009.gif) 2, 1
2, 1![[thin space (1/6-em)]](https://www.rsc.org/images/entities/char_2009.gif) :
:![[thin space (1/6-em)]](https://www.rsc.org/images/entities/char_2009.gif) 1, 2
1, 2![[thin space (1/6-em)]](https://www.rsc.org/images/entities/char_2009.gif) :
:![[thin space (1/6-em)]](https://www.rsc.org/images/entities/char_2009.gif) 1, 3
1, 3![[thin space (1/6-em)]](https://www.rsc.org/images/entities/char_2009.gif) :
:![[thin space (1/6-em)]](https://www.rsc.org/images/entities/char_2009.gif) 1 and 1
1 and 1![[thin space (1/6-em)]](https://www.rsc.org/images/entities/char_2009.gif) :
:![[thin space (1/6-em)]](https://www.rsc.org/images/entities/char_2009.gif) 0, corresponding to diluted dye concentrations in the range 0 to 214 μM. For each different dilution the system was allowed to stabilise for five minutes, and an in-line absorption spectrum was then recorded downstream of the separator, prior to the flow restriction, as described in the Methods section and Fig. 7a and b. The resultant spectra are shown in the blue curves of Fig. 4a. For control purposes, pure (214 μM) dye solution was passed through the separator without any PFPE present and the absorption spectrum was recorded in-line. The absorption spectrum of the pure dye (dotted red line) and that of the 214 μM eluent (after PFPE depletion) are shown overlaid in the uppermost spectra of Fig. 4a. To within experimental error there are no differences between the two, providing further confirmation that the separator provides complete separation of the two phases.
0, corresponding to diluted dye concentrations in the range 0 to 214 μM. For each different dilution the system was allowed to stabilise for five minutes, and an in-line absorption spectrum was then recorded downstream of the separator, prior to the flow restriction, as described in the Methods section and Fig. 7a and b. The resultant spectra are shown in the blue curves of Fig. 4a. For control purposes, pure (214 μM) dye solution was passed through the separator without any PFPE present and the absorption spectrum was recorded in-line. The absorption spectrum of the pure dye (dotted red line) and that of the 214 μM eluent (after PFPE depletion) are shown overlaid in the uppermost spectra of Fig. 4a. To within experimental error there are no differences between the two, providing further confirmation that the separator provides complete separation of the two phases.
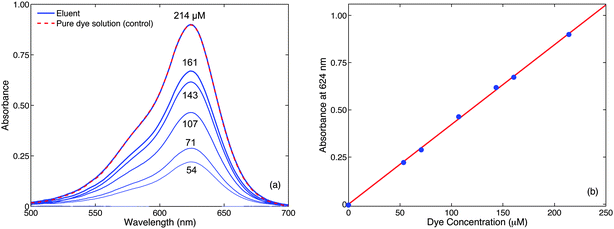 | ||
| Fig. 4 Use of the separator for inline absorption measurements (with 355 μm flow restriction in place, Fig. 2c). (a) Absorption spectra recorded in-line after phase separator at various dye concentrations; also shown as a control is the absorption spectrum of the pure (214 μM) dye solution measured in-line in the absence of PFPE (dotted red line); (b) absorbance at 624 nm versus dye concentration. | ||
The ability to switch from segmented flow to continuous flow prior to detection greatly simplifies the in-line measurement procedure as it allows the absorbance to be measured quasi-statically, and so conveniently avoids the need for fast detectors and instrumentation synchronised to the segmented solvent flow. Importantly, the use of the separator does not in any way compromise the accuracy of the optical measurement – indeed in many cases the improved ease of detection can be expected to improve accuracy. Using the data from Fig. 4a and plotting the measured absorbance at the peak wavelength of 624 nm against the calculated dye concentration yielded a straight line of slope 4225 ± 160 M−1 (Fig. 4b). Dividing this value through by the 0.9 ± 0.01 mm effective path length of the tubing,|| yielded an extinction coefficient of 46![[thin space (1/6-em)]](https://www.rsc.org/images/entities/char_2009.gif) 900 ± 2700 M−1 cm−1 in close agreement with a value of 46
900 ± 2700 M−1 cm−1 in close agreement with a value of 46![[thin space (1/6-em)]](https://www.rsc.org/images/entities/char_2009.gif) 400 ± 2300 M−1 cm−1 measured conventionally at 214 μM using an (off-line) absorption spectrometer and a 1 mm cuvette. Hence, it is evident that quantitative optical measurements can be readily performed without sophisticated instrumentation by the simple stratagem of switching to continuous flow and then measuring quasi-statically. Beyond optical measurements the same approach could be applied to a broad range of in-line analysis techniques that require a continuous inlet stream,27 including nuclear magnetic resonance spectroscopy28–30 and liquid chromatography.31–34
400 ± 2300 M−1 cm−1 measured conventionally at 214 μM using an (off-line) absorption spectrometer and a 1 mm cuvette. Hence, it is evident that quantitative optical measurements can be readily performed without sophisticated instrumentation by the simple stratagem of switching to continuous flow and then measuring quasi-statically. Beyond optical measurements the same approach could be applied to a broad range of in-line analysis techniques that require a continuous inlet stream,27 including nuclear magnetic resonance spectroscopy28–30 and liquid chromatography.31–34
Finally the viability of regenerating a segmented flow after phase separation was investigated – a necessary requirement for using the separator in multistep chemical processes where it may be necessary to switch repeatedly between segmented- and continuous-flow modes of operation. As before syringe pumps were used to inject water and PFPE into the inlets of the droplet generator at equal rates of 100 μl min−1, and the resulting segmented flow stream was passed into the inlet of the separator. The water fraction emerging from the outlet of the separator was passed into one inlet of a second droplet generator, while the other inlet was fed with fresh PFPE from a syringe pump at a rate of 100 μl min−1. This resulted in the generation of a new, high-uniformity segmented flow, equivalent in quality to the original segmented flow generated directly from the syringe pumps. A photograph showing the segmented flow before the separator, the pure aqueous flow after the separator, and the new segmented flow after the secondary injection of carrier fluid is provided in Fig. 5, and a video of the same is provided in ESI Video 1.† It is worth emphasising that the generation of a time-invariant segmented flow is possible only when the solvent and carrier enter the inlets of the droplet generator under steady-state conditions. The successful regeneration of the segmented flow thus provides clear evidence for the stable flow dynamics of the water stream emitted by the separator.
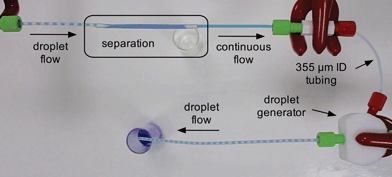 | ||
Fig. 5 Photograph showing phase separation followed by regeneration of segmented flow. A 1![[thin space (1/6-em)]](https://www.rsc.org/images/entities/char_2009.gif) : :![[thin space (1/6-em)]](https://www.rsc.org/images/entities/char_2009.gif) 1 segmented flow of water (dyed blue for clarity) and PFPE is injected into the separator, and a continuous stream of water emerges at the separator outlet. New PFPE from a syringe pump and the eluting water from the separator are injected at equal rates into the two inlets of a second droplet generator to regenerate the droplet flow. See also ESI Video 1.† 1 segmented flow of water (dyed blue for clarity) and PFPE is injected into the separator, and a continuous stream of water emerges at the separator outlet. New PFPE from a syringe pump and the eluting water from the separator are injected at equal rates into the two inlets of a second droplet generator to regenerate the droplet flow. See also ESI Video 1.† | ||
In conclusion we have demonstrated the use of a porous PTFE capillary as a simple passive component for separating two immiscible liquids in the segmented flow regime. Using water and PFPE as a test system the separator was shown to provide quantitative recovery of the water phase from the carrier fluid over a wide range of flow rates, with no detectable contamination by the fluorous component even when it was present in large excess. The separator enables the straightforward in-line monitoring of segmented flow processes by enabling the flow regime to be switched to continuous flow immediately before detection, thereby allowing analysis to occur quasi-statically without the need for fast instrumentation. Importantly, the solvent is emitted from the outlet of the separator with stable flow characteristics that allow for the straightforward regeneration of the segmented flow by injecting additional carrier fluid downstream. In this way it is possible to switch repeatedly between segmented- and continuous modes of operation – a critical requirement for multistep chemical processing.
A key advantage of capillary separators over flat-membrane separators is their exceptional simplicity of implementation. Using the procedure outlined above, high performance separators may be fabricated in minutes at the cost of a few dollars, a significant simplification compared to the precision-engineered micromachined flat-membrane devices of ref. 19–21. Finally we point out that, although we have focused here on the separation of water–fluorous systems, the same method has been successfully applied to the separation of water–organic systems and organic–fluorous solvent–carrier systems. We note that the ability to separate an organic solvent from a fluorous carrier liquid is a significant advantage over flat-membrane separators which have previously been reported to be ill-suited to the separation of organic–fluorous systems.20 A quantitative study of the behaviour of the capillary separator with different liquid–liquid combinations will be provided in a forthcoming publication.
Methods
Droplet generation
Water–PFPE droplet streams were generated using two-inlet droplet generators machined from PTFE rod (RS) on a 4-axis CNC milling machine to a design shown in Fig. 6. The droplet generators have an optimised channel architecture that minimises back-flow even when the carrier and solvent phases are injected at high differential flow rates.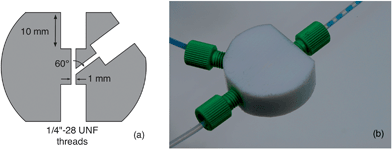 | ||
| Fig. 6 PTFE droplet generator: (a) schematic of channel architecture; (b) photograph of droplet generator in action, using equal flow-rates of water and PFPE. | ||
Inline spectroscopy
Inline absorption spectroscopy was carried out with the aid of a cylindrical micromachined aluminium housing (Fig. 7). A 0.5 mm bore-hole was drilled through the axis of the cylinder, and small recesses centred on the bore-hole were machined into the two flat faces of the cylinder to house a white light-emitting diode (Nichia NSPL510DS) and an SMA 905 terminated fibre-optic (Ocean Optics). A second 2.1 mm bore-hole was drilled through the middle of the cylinder at ninety degrees to (and co-incident with) the first bore-hole. The LED and SMA 905 terminated fibre-optic were inserted into their respective recesses, and the 2 mm OD PTFE tubing from the flow system was tightly threaded through the second bore-hole. Each component was secured with an M3 grub screw. The LED, driven by an operational amplifier based constant-current driver circuit, illuminated a small patch on one side of the PTFE tubing, while the transmitted light on the opposite side of the tubing was collected by the fibre and passed to an Ocean Optics USB2000+ spectrograph (Fig. 7).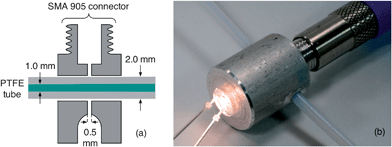 | ||
| Fig. 7 Cylindrical aluminum housing for in-line absorption measurements; (a) schematic of housing, showing a 2.1 mm bore-hole for PTFE tubing (1 mm ID, 2 mm OD), recesses for a light-emitting diode and SMA 905 terminated fibre-optic cable, and a 0.5 mm bore-hole for optical access to the PTFE tubing; (b) photograph of the housing with LED, fibre-optic and PTFE tubing in place. | ||
Fabrication of droplet separator
The separator was fabricated by first priming two lengths of non-porous PTFE tubing (2 mm OD, 1 mm ID, Polyflon) with Loctite 770 primer and then inserting them a distance of 5 mm into each end of a 60 mm length of porous PTFE tubing (1.8 mm ID, 2.5 mm OD, pore size: 15–25 μm) – resulting in a 50 mm length of exposed porous tubing. To hold the three parts of the separator together a small amount of Loctite 406 was applied to the overlapping regions of the porous PTFE.Acknowledgements
The authors are grateful to Mr Brian Clarke and Mr Mark Phillips of Zeus Industrial Products Inc. for the donation of Aeos porous PTFE samples and for helpful discussions. JB and TP are funded by the EPSRC through a Doctoral Training Centre in Plastic Electronics (grant number EP/G037515/1). JB holds an Industrial Fellowship with the Royal Commission for the Exhibition of 1851. AN is funded under the EU Framework 7 Project SiNAPS.References
- H. Song, D. L. Chen and R. F. Ismagilov, Angew. Chem., Int. Ed. Engl., 2006, 45, 7336–7356 CrossRef CAS.
- A. Günther and K. F. Jensen, Lab Chip, 2006, 6, 1487–1503 RSC.
- S.-Y. Teh, R. Lin, L.-H. Hung and A. P. Lee, Lab Chip, 2008, 8, 198–220 RSC.
- A. B. Theberge, F. Courtois, Y. Schaerli, M. Fischlechner, C. Abell, F. Hollfelder and W. T. S. Huck, Angew. Chem., Int. Ed. Engl., 2010, 49, 5846–5868 CrossRef CAS.
- R. Seemann, M. Brinkmann, T. Pfohl and S. Herminghaus, Rep. Prog. Phys., 2012, 75, 016601 CrossRef.
- A. Huebner, S. Sharma, M. Srisa-Art, F. Hollfelder, J. B. Edel and A. J. Demello, Lab Chip, 2008, 8, 1244–1254 RSC.
- K. Choi, A. H. C. Ng, R. Fobel and A. R. Wheeler, Annu. Rev. Anal. Chem., 2012, 5, 413–440 CrossRef CAS.
- R. L. Hartman and K. F. Jensen, Lab Chip, 2009, 9, 2495–2507 RSC.
- M. J. Jebrail, M. S. Bartsch and K. D. Patel, Lab Chip, 2012, 12, 2452–2463 RSC.
- R. H. Atallah, J. Ruzicka and G. D. Christian, Anal. Chem., 1987, 59, 2909–2914 CrossRef CAS.
- D. X. Hu, M. O'Brien and S. V. Ley, Org. Lett., 2012, 14, 4246–4249 CrossRef CAS.
- J. F. B. Hall, X. Han, M. Poliakoff, R. A. Bourne and M. W. George, Chem. Commun., 2012, 48, 3073–3075 RSC.
- A. N. Anthemidis, Talanta, 2008, 77, 541–545 CrossRef CAS.
- F. Scheiff, M. Mendorf, D. Agar, N. Reis and M. Mackley, Lab Chip, 2011, 11, 1022–1029 RSC.
- E. Kolehmainen and I. Turunen, Chemical Engineering and Processing: Process Intensification, 2007, 46, 834–839 CrossRef CAS.
- W. A. Gaakeer, M. H. J. M. de Croon, J. van der Schaaf and J. C. Schouten, Chem. Eng. J., 2012, 207–208, 440–444 CrossRef CAS.
- O. K. Castell, C. J. Allender and D. A. Barrow, Lab Chip, 2009, 9, 388–396 RSC.
- X. Z. Niu, B. Zhang, R. T. Marszalek, O. Ces, J. B. Edel, D. R. Klug and A. J. DeMello, Chem. Commun., 2009, 6159–6161 RSC.
- L. Nord and B. O. Karlberg, Anal. Chim. Acta, 1980, 118, 285–292 CrossRef CAS.
- J. G. Kralj, H. R. Sahoo and K. F. Jensen, Lab Chip, 2007, 7, 256–263 RSC.
- H. R. Sahoo, J. G. Kralj and K. F. Jensen, Angew. Chem., Int. Ed. Engl., 2007, 46, 5704–5708 CrossRef CAS.
- A. Adamo, P. L. Heider, N. Weeranoppanant and K. F. Jensen, Ind. Eng. Chem. Res., 2013 DOI:10.1021/ie401180t.
- M. N. Kashid, Y. M. Harshe and D. W. Agar, Ind. Eng. Chem. Res., 2007, 46, 8420–8430 CrossRef CAS.
- D. Goldfarb, US Pat., 6,436,135, 2002.
- M. Yamamoto, Y. Obata, Y. Nitta, F. Nakata and T. Kumamaru, J. Anal. At. Spectrom., 1988, 3, 441–445 RSC.
- X. Wang and R. Barnes, J. Anal. At. Spectrom., 1988, 3, 1091–1095 RSC.
- J. P. McMullen and K. F. Jensen, Org. Process Res. Dev., 2010, 107, 2300–2318 Search PubMed.
- C. Massin, F. Vincent, A. Homsy, K. Ehrmann, G. Boero, P.-A. Besse, A. Daridon, E. Verpoorte, N. F. de Rooij and R. S. Popovic, J. Magn. Reson., 2003, 164, 242–255 CrossRef CAS.
- J. Bart, A. J. Kolkman, A. J. Oosthoek-de Vries, K. Koch, P. J. Nieuwland, H. J. W. G. Janssen, J. P. J. M. van Bentum, K. A. M. Ampt, F. P. J. T. Rutjes, S. S. Wijmenga, H. J. G. E. Gardeniers and A. P. M. Kentgens, J. Am. Chem. Soc., 2009, 131, 5014–5015 CrossRef CAS.
- R. M. Fratila and A. H. Velders, Annu. Rev. Anal. Chem., 2011, 4, 227–249 CrossRef CAS.
- C. Southan, P. Lavery and K. G. Fantom, Anal. Biochem., 1999, 271, 152–158 CrossRef CAS.
- J. Huft, C. A. Haynes and C. L. Hansen, Anal. Chem., 2013, 85, 1797–1802 CrossRef CAS.
- W. De Malsche, S. De Bruyne, J. Op De Beek, P. Sandra, H. Gardeniers, G. Desmet and F. Lynen, J. Chromatogr., A, 2012, 1230, 41–47 CrossRef CAS.
- J. P. Kutter, J. Chromatogr., A, 2012, 1221, 72–82 CrossRef CAS.
Footnotes |
| † Electronic supplementary information (ESI) available. See DOI: 10.1039/c3ay41251b |
| ‡ Note, segmented flow systems are also of interest in circumstances where chemical species are partially soluble in both liquids, as the high contact area between the two phases can substantially increase the efficiency of biphasic processes. |
| § Note, fluorous oils are ideal carrier fluids for segmented-flow microchemistry since they are inert and form sharp bilayers with non-fluorous liquids, with negligible emulsification at the interface. |
| ¶ It is worth pointing out that, since the fluid collected at the separator outlet is purely solvent with no contamination by PFPE, this configuration can still be useful in circumstances where complete removal of PFPE is required but achieving 100% recovery of the solvent phase is not essential. |
| || Due to its circular cross section, the effective path length of the capillary is somewhat smaller than its inner diameter of 1 ± 0.01 mm. For the 0.5 mm aperture used in the transmission measurement, the effective path length was determined to be 0.9 mm by cross-calibrating with a reference dye of known absorbance. |
| This journal is © The Royal Society of Chemistry 2013 |
