Quantification of multiple bile acids in uninephrectomized rats using ultra-performance liquid chromatography-tandem mass spectrometry†
Carlos A.
Penno
*abe,
Denis
Arsenijevic
ce,
Thierry
Da Cunha
ae,
Gerd A.
Kullak-Ublick
de,
Jean-Pierre
Montani
ce and
Alex
Odermatt
*ae
aDivision of Molecular and Systems Toxicology, Department of Pharmaceutical Sciences, University of Basel, Klingelbergstrasse 50, CH-4056 Basel, Switzerland. E-mail: alex.odermatt@unibas.ch; Fax: +41 61 267 1515; Tel: +41 61 267 1530
bNovartis Institute for Biomedical Research, Novartis, CH-4009 Basel, Switzerland. E-mail: carlos.penno@unibas.ch; Fax: +41 61 267 1515; Tel: +41 61 267 1484
cDepartment of Medicine/Physiology, University of Fribourg, Fribourg, Switzerland
dDepartment of Clinical Pharmacology and Toxicology, University Hospital Zurich, Zurich, Switzerland
eThe Swiss National Center of Competence in Research (NCCR) Kidney Control of Homeostasis (Kidney.CH) Web: http://www.nccr-kidney.ch/
First published on 14th January 2013
Abstract
In order to study the roles of individual BAs and due to limited blood sample volumes available from experimental animals, improved methods for the simultaneous quantification of multiple BAs are needed. We developed and validated an ultra-performance liquid chromatography tandem mass spectrometry (UPLC-MS/MS) method for the quantification of 24 BAs, including 11 unconjugated, 6 glycine-conjugated and 7 taurine-conjugated BAs, in 50 μL of rat serum or plasma. The UPLC-MS/MS method, operated in negative and positive ion mode, allows quantification of BAs using multiple-reaction monitoring (MRM), with specific fragmentation of BAs. The method showed acceptable intra- and inter-day accuracy, precision, extraction recovery and high sensitivity, with a lower limit of quantification (LLOQ) in the pM range for several taurine-conjugated BAs. We applied the established method to investigate potential time-dependent changes of BAs in plasma from sham-operated and uninephrectomized male Sprague-Dawley rats. The levels of several primary and secondary BAs were transiently elevated one week after uninephrectomy, followed by normalization thereafter. In contrast, several conjugated BAs were slightly increased after the second week post-surgery. The established UPLC-MS/MS method, employing specific fragmentation of free and conjugated BAs by MRM, allows the simultaneous quantification of multiple BAs in 50 μL serum or plasma samples, and can be used to assess BA profiles in patho-physiological situations.
Introduction
The importance of bile acids (BAs) as end products of cholesterol catabolism and as emulsifiers for the absorption of dietary lipids and lipid soluble vitamins (A and D) has long been known.1–3 More recently, their ability to activate nuclear receptors such as the farnesoid-X-receptor (FXR-α), pregnane-X-receptor (PXR), constitutive androstane receptor (CAR), vitamin D receptor (VDR) and G-protein coupled bile acid receptor (TGR5), as well as their role in liver regeneration have been identified.4–7 Through the modulation of the activities of these various receptors, BAs regulate their own homeostasis as well as that of lipids and glucose, thereby controlling energy metabolism and thus opening new opportunities for therapeutic interventions to combat metabolic diseases.3,8,9 Besides, BAs are involved in the solubilization and excretion of xenobiotics and are thus of toxicological relevance. Therefore, establishing novel, highly sensitive and accurate methods enabling the simultaneous quantification of a larger number of BAs in biofluids from normal and pathological conditions is expected to broaden our understanding of their functions.Liquid chromatography tandem mass spectrometry (LC-MS/MS) has been considered the gold standard for quantification of BAs in biological fluids and tissues, due to several advantages over traditional techniques such as gas chromatography (GC)-MS, including ease of sample preparation and no need for hydrolysis of conjugated BAs or complex derivatization reactions.10 However, despite the technological advance in MS to increase sensitivity, several problems still remain to be overcome such as the requirement of large sample volumes depending on the analyte to be quantified,11 the need for derivatization depending on the availability of sample amount,12 interference with contaminating endogenous BAs in biological matrices,11 and limited specificity when using selective ion monitoring (SIM) for quantification.10 Although there is a consensus in the literature regarding the use of multiple reaction monitoring (MRM) for the quantification of taurine- and glycine-conjugated BAs, MRM has not yet been widely used for quantification of unconjugated BAs.11,13–25 In the present study, we applied specific fragmentation using MRM for both conjugated and unconjugated BAs in order to increase the specificity of detection and sensitivity for quantification of BAs in complex biological matrices such as serum and plasma.
Primary BAs are synthesized and conjugated in hepatocytes, followed by excretion into bile and the intestinal tract. Gut microorganisms generate secondary BAs by deconjugation and dehydroxylation. Upon reuptake by intestinal transporters, BAs are reconjugated in the liver to complete the enterohepatic cycle. BAs can also be filtered in the kidney through the glomerulus, followed by urinary excretion. Most BAs undergo reuptake by renal tubular transporters and, under normal conditions, the amount of excreted BAs is low. However, impaired hepatorenal function can lead to increased urinary BA excretion.
The kidney has a key role in the control of whole body homeostasis, including electrolyte balance and blood pressure, production and utilization of systemic glucose, degradation of hormones and excretion of waste metabolites.26 Recent observations unraveled the importance of the kidney in the regulation of lipid metabolism, fat distribution and adipocyte differentiation.27 In rats reduced renal function upon uninephrectomy has been linked with several aspects of the metabolic syndrome such as lipodystrophy of subcutaneous and visceral adipose depots, with lipid depletion, adipocyte dedifferentiation, lipid peroxidation, hypercholesterolemia and hypertriglyceridemia.28 Similarly, nondiabetic patients on hemodialysis manifested fat redistribution with increasing visceral fat and altered serum lipid profiles.29 These findings indicate that reduced renal function can cause disturbances of lipid homeostasis. Due to the close association between BA signaling and metabolic homeostasis30–33 and the observed impact of reduced kidney function on lipid homeostasis, we investigated the impact of uninephrectomy in rats on plasma BA profiles by applying the validated UPLC-MS/MS method.
Materials and methods
Ethics statement
The animal experimental protocol was approved by the Ethical Committee of the Veterinary Office of Fribourg, Switzerland.Chemicals and reagents
Cholic acid (CA), chenodeoxycholic acid (CDCA), deoxycholic acid (DCA), lithocholic acid (LCA), ursodeoxycholic acid (UDCA), glyco-deoxycholic acid (G-DCA), glyco-chenodeoxycholic acid (G-CDCA), tauro-chenodeoxycholic acid (T-CDCA), [2,2,4,4-2H4]-CA (98% isotopic purity), [2,2,4,4-2H4]-CDCA (>98% isotopic purity) and [2,2,4,4-2H4]-LCA (98% isotopic purity) were purchased from Sigma-Aldrich (St. Louis, MO). 7-Oxodeoxycholic acid (7-oxoDCA), 7-oxolithocholic acid (7-oxoLCA), hydeoxycholic acid (HDCA), α-muricholic acid (α-MCA), β-muricholic acid (β-MCA), ω-muricholic acid (ω-MCA), glyco-lithocholic acid (G-LCA), glyco-ursodeoxycholic acid (G-UDCA), tauro-lithocholic acid (T-LCA), tauro-α-muricholic acid (T-α-MCA), tauro-β-muricholic acid (T-β-MCA) and [2,2,4,4-2H4]-DCA (98% isotopic purity) were obtained from Steraloids (Newport, RI). Glyco-cholic acid (G-CA), tauro-cholic acid (T-CA), tauro-deoxycholic acid (T-DCA) and tauro-ursodeoxycholic acid (T-UDCA) were purchased from Calbiochem (Läufelfingen, Switzerland), and [2,2,4,4-2H4]-UDCA (>98% isotopic purity), [2,2,4,4-2H4]-G-CA (>98% isotopic purity), [2,2,4,4-2H4]-G-CDCA (>98% isotopic purity) and [2,2,4,4-2H4]-G-UDCA (>98% isotopic purity) from C/D/N Isotopes Inc. (Pointe-Claire, Canada). The conjugated bile acids tauro-7-oxoLCA (T-7-oxoLCA) and glyco-7-oxoLCA (G-7-oxoLCA) were a gift from Dr Alan F. Hofmann (University of California at San Diego, San Diego, CA, USA). All other chemicals were from Fluka AG (Buchs, Switzerland) of the highest grade available.Preparation of stock solutions, calibrators and quality control (QC) samples
Stock solutions were prepared in methanol for each standard and deuterium-labeled internal standards (IS) at a concentration of 10 mM. Thereafter, working solutions containing standards and deuterium-labeled IS (100 μM each) were prepared. All stock solutions of standards and deuterium-labeled IS were stored at −20 °C. Unspiked charcoal-treated rat serum represented the zero calibration point. Calibration curves were prepared by serial dilution of the working solutions of standards in charcoal-treated pooled male rat serum (Dunn Labortechnik GmbH, Asbach, Germany). For that purpose, 100 mg mL−1 of activated charcoal was stirred overnight at 4 °C, and centrifuged thereafter for 20 min at 13![[thin space (1/6-em)]](https://www.rsc.org/images/entities/char_2009.gif) 000 × g to remove endogenous BAs. Following three centrifugation cycles, the supernatant was filtered through a 0.20 μm membrane and stored in aliquots at −20 °C until further use. The absence of remaining endogenous BAs from the matrix was verified by UPLC-MS/MS.
000 × g to remove endogenous BAs. Following three centrifugation cycles, the supernatant was filtered through a 0.20 μm membrane and stored in aliquots at −20 °C until further use. The absence of remaining endogenous BAs from the matrix was verified by UPLC-MS/MS.
Animal preparation and experimental protocol
Male Sprague Dawley rats (Elevage Janvier, France) of ∼5 weeks of age were caged singly in a temperature-controlled room (22 ± 1 °C) with a 12 h light/dark cycle. After one week of acclimation, the rats (eight animals per group) underwent surgery under general anesthesia with ketamine/xylazine (150 mg kg−1 and 2 mg kg−1, respectively) and sterile conditions for uninephrectomy or sham-surgery. Briefly, an incision was made on the left flank to access the kidney retroperitoneally. In half of the rats, renal blood vessels and the urethra were ligated with a surgical thread, the connection to the kidney was cut and the kidney was removed. Tissues were sutured and the wound was closed with metal clips. In sham-operated rats, the surgery was identical except that the kidney was left intact in place. For the whole experiment, rats were fed an isocaloric diet 90 kcal per day (low fat diet Nr 2125 from Kliba, Kaiseraugst, Switzerland). Eight rats per group were sacrificed by decapitation 1 week, 2 weeks and 4 weeks after surgery, and blood was collected from the neck immediately after decapitation in EDTA tubes under ice and cold-centrifuged. The plasma was separated and stored at −20 °C for later analysis.Sample preparation
Plasma samples (total volume of 50 μL) and calibrators were subjected to protein precipitation by adding 500 μL of ice-cold acetonitrile containing deuterium-labeled internal standards (IS), at a final concentration of 100 nM each of CA-d4, CDCA-d4, DCA-d4, UDCA-d4, G-CA-d4, G-CDCA-d4 and G-UDCA-d4. The final concentration of LCA-d4 was adjusted to 1000 nM due to its low ionization efficiency. The concentrations of IS used are similar to those used by other investigators and did not interfere with the concentrations of endogenous BAs found in samples.23 Extraction was performed for 30 min at 4 °C with continuous shaking. Samples were centrifuged at 14000 × g for 15 min at 4 °C, and the supernatants were transferred to new tubes, followed by evaporation and reconstitution in 50 μL of methanol/water of 50/50 (v/v). The injection volume was 5 μL.
Separation, ionization and detection conditions
The UPLC-MS/MS consisted of an Agilent 1290 UPLC coupled to an Agilent 6490 triple quadrupole mass spectrometer equipped with an electrospray ionization (ESI) source (Agilent Technologies, Basel, Switzerland). Separation of analytes was achieved using reversed-phase column (ACQUITY UPLC BEH C18, 1.7 μm, 2.1 × 150 mm, Waters, Wexford, Ireland) heated to 65 °C. Data acquisition and analysis was performed using Mass Hunter software (Agilent Technologies).The mobile phase consisted of water–acetonitrile–formic acid (A) (95/5/0.1; v/v/v) and (B) (5/95/0.1; v/v/v). The eluent gradients were set from 25%–35% of B during 0–8 min, 35%–70% eluent B during 8–18 min and 95% of B at 18.1 min onwards. The run was stopped at 20 min, followed by re-equilibration of the column. The flow rate was set to 0.75 mL min−1. Ionization was performed using an ESI source operated in the positive and negative ion modes. Fragmentation was tuned for each compound using Optimizer software (Agilent Technologies). Optimized conditions are shown in Table 1. The source parameters were set to gas temperature 350 °C, gas flow 15 L min−1, nebulizer pressure 20 psi, sheath gas temperature 250 °C, sheath gas flow 11 L min−1, capillary voltage 3000 V (positive and negative), nozzle voltage 2000 V and cell accelerator voltage 5 V.
| BA | Precursor Ion (m/z) | Product ion (m/z) | Collision energy (V) | Polarity | Internal Standard |
|---|---|---|---|---|---|
| CA | 373.3 | 355.2 | 48 | Positive | CA-d4 |
| CDCA | 357.2 | 95.1 | 40 | Positive | CDCA-d4 |
| DCA | 357.2 | 95.1 | 40 | Positive | DCA-d4 |
| 7-oxoDCA | 371.3 | 353.2 | 8 | Positive | DCA-d4 |
| HDCA | 357.2 | 95.1 | 40 | Positive | UDCA-d4 |
| LCA | 359.3 | 135.1 | 24 | Positive | LCA-d4 |
| 7-oxoLCA | 373.3 | 355.2 | 8 | Positive | UDCA-d4 |
| α-MCA | 373.3 | 355.2 | 8 | Positive | UDCA-d4 |
| β-MCA | 373.3 | 355.2 | 8 | Positive | UDCA-d4 |
| ω-MCA | 373.3 | 355.2 | 8 | Positive | UDCA-d4 |
| UDCA | 357.2 | 95.1 | 40 | Positive | UDCA-d4 |
| G-CA | 464.2 | 74 | 37 | Negative | G-CA-d4 |
| G-CDCA | 448.2 | 74 | 41 | Negative | G-CDCA-d4 |
| G-DCA | 448.2 | 74 | 41 | Negative | G-CA-d4 |
| G-LCA | 432.2 | 74 | 41 | Negative | G-UDCA-d4 |
| G-7-oxoLCA | 446.2 | 74 | 37 | Negative | G-UDCA-d4 |
| G-UDCA | 448.2 | 74 | 37 | Negative | G-UDCA-d4 |
| T-CA | 480.3 | 126 | 24 | Positive | G-UDCA-d4 |
| T-CDCA | 464.2 | 126 | 28 | Positive | G-CDCA-d4 |
| T-DCA | 464.2 | 126 | 28 | Positive | DCA-d4 |
| T-LCA | 466.2 | 126 | 28 | Positive | G-UDCA-d4 |
| T-7-oxoLCA | 480.3 | 126 | 20 | Positive | G-UDCA-d4 |
| T-β-MCA | 480.3 | 126 | 24 | Positive | G-DCA-d4 |
| T-UDCA | 464.2 | 126 | 28 | Positive | G-UDCA-d4 |
| CA-d4 | 377.3 | 359.2 | 48 | Positive | — |
| CDCA-d4 | 361.2 | 95.1 | 40 | Positive | — |
| DCA-d4 | 361.3 | 95.1 | 40 | Positive | — |
| LCA-d4 | 363.3 | 135.1 | 24 | Positive | — |
| UDCA-d4 | 361.2 | 95.1 | 40 | Positive | — |
| G-CA-d4 | 468.2 | 74 | 37 | Negative | — |
| G-CDCA-d4 | 452.2 | 74 | 41 | Negative | — |
| G-UDCA-d4 | 452.2 | 74 | 41 | Negative | — |
Method validation
Method validation was performed according to the FDA guidelines for Bioanalytical Method Validation.34 The linearity of each BA calibration curve was determined by analyzing charcoal treated rat serum prepared to contain standards at the concentration ranges of 0.12 nM, 0.98 nM, 7.8 nM, 62.5 nM, 500 nM and 4 μM. Calibration curve linearity was evaluated by assessing the correlation coefficient (R2) of three freshly prepared calibration curves. Standard curves were constructed by least-squares linear regression analysis using the peak area ratio of a given BA over its reference IS against the nominal concentration of the calibrator. Quantification of samples was performed identically. Due to the unavailability of reference IS, 7-oxoDCA, HDCA, 7-oxoLCA, α-MCA, β-MCA, ω-MCA, G-DCA, G-LCA, G-7-oxoLCA, T-CA, T-CDCA, T-DCA, T-LCA, T-7-oxoLCA, T-β-MCA and T-UDCA were semi-quantified by referring to a surrogate deuterium-labeled IS (Table 1).Values of the lower limit of quantification (LLOQ) were calculated by assessing the signal to noise ratio (SNR) (baseline noise determined on an interval before and after the peak of interest and using the peak height as signal definition). Five replicates were extracted and analyzed for each concentration. A signal equal or higher than ten times that of the baseline was considered the LLOQ, with accuracy between 80 and 120% of the true value and coefficient of variation (CV) of 15%. Due to the persistence of trace amounts of G-CA, G-CDCA and G-DCA after charcoal treatment, their LLOQs were determined as being the lowest concentration at which these analytes could be quantified with sufficient precision (CV of 15%) and accuracy (between 85% and 115%).
In order to assess intra- and inter-day precision and accuracy, five replicates of five different quality control (QC) samples with concentrations ranging from 0.002 μM to 2 μM were extracted and quantified using freshly prepared calibrators in charcoal treated rat serum. Replicates of each QC sample were analyzed in a given day in order to determine intra-day accuracy and precision as well as over a period of three days (inter-day) using freshly prepared calibration curves.
Recovery experiments were performed using untreated and charcoal-treated serum samples in order to mimic extraction conditions similar to those of real samples and to assess the impact of matrix components on extraction recoveries. In order to assess extraction recovery, twelve untreated and charcoal-treated serum samples were taken for each of the concentration levels (2000 nM, 200 nM and 20 nM). From these twelve samples, six were spiked with the appropriate amount of standard stock solution and IS prior to extraction, and the remaining six samples were extracted as blanks and reconstituted with the same amount of standard stock solution and IS after extraction. Six additional unspiked serum samples were extracted in order to determine endogenous concentrations of BAs. Thereafter, samples were evaporated, reconstituted and injected. Correction of the spiked serum samples was performed by subtracting the endogenous amounts of the respective BAs. Recovery results were obtained by expressing the average of the mean peak area of samples spiked prior to extraction as a percentage of that of samples spiked after extraction.
Matrix effects were assessed by using untreated pooled rat serum in order to mimic chemical conditions of those of real samples. For that purpose, six samples were spiked with defined amounts of standard stock solutions (2000 nM, 200 nM and 20 nM) and IS after extraction. Six additional unspiked serum samples were extracted in order to determine the endogenous concentration of BAs. Thereafter, all samples were evaporated and reconstituted in the mobile phase. Correction of the spiked serum samples was performed by subtracting the endogenous amounts of the respective BAs, and matrix effects were calculated by expressing the peak area of spiked serum samples after extraction as a percentage of the peak area of that of net solutions containing only the pure standard in methanol.
Statistical analysis
Data are presented as mean ± SD. Statistical significance was assessed by Student's t-test.Results and discussion
In the present study, a sensitive and specific UPLC-MS/MS method for the quantification of 24 BAs, including 11 unconjugated, 6 glycine- and 6 taurine-conjugated BAs was developed. Additionally, T-α-MCA was included in the analytical method after validation. The method was validated according to the Food and Drug Administration (FDA) guidelines,34 using 50 μL of rat serum. In the validation procedure we included the following parameters: linearity of calibration curves, inter- and intra-day accuracy and precision, extraction recoveries and matrix effects. Following validation, the method was applied to determine BA profiles in the plasma of sham-operated and uninephrectomized male Sprague-Dawley rats.Chromatography and ionization conditions
Due to the fact that it is impossible to differentiate isobaric BA species by MS, a prior chromatographic step is needed (see Fig. 1 for structures). Our chromatography conditions allowed the separation of the 24 BAs in a 20 min run using a reversed-phase column heated to 65 °C (Fig. 2). T-α-MCA and T-β-MCA peaks were resolved with a resolution of approximately 1.0 (Fig. 2, insert). In order to gain sensitivity, the MS program was divided in segments in which defined transitions were monitored according to the retention time of the metabolites. An electrospray ionization (ESI) source operating in the negative ion mode was used for glycine-conjugated BAs and in the positive ion mode for unconjugated and taurine-conjugated BAs (Table 1). Most studies so far reported the use of negative ion mode for the quantification of BAs in biological matrices.11,13,15–25,35–37 In spite of this, we found that ESI-positive ion mode provided higher ionization efficiency for unconjugated and taurine-conjugated BAs, regardless of whether formic acid or ammonium formate was used as the ionizing agent. Moreover, we obtained more stable and abundant fragments for MRM transitions of unconjugated BAs in positive but not in negative ion mode. Superior signal-to-noise ratios (SNRs) and LOD values (SNR∼3) have been obtained with positive ion mode. LCA, for example, could not be quantified in negative ion mode using transitions reported in the literature (Fig. S1 and S2†).23 This may be explained by the solvent system employed in the present study. Supporting this idea, Qiao et al. reported more efficient ionization of DCA in ESI-negative mode using a solvent system consisting of water-methanol compared with acetonitrile, while maintaining reasonable signal intensity in positive ion mode.38 Controversially, García-Canãveras et al. used acetonitrile as a solvent and negative ion mode for quantification of DCA and LCA, with LLOQ of 5 and 10 nM, respectively.23 The discrepancy between results obtained in positive and negative ion mode may be dependent, at least in part, on the different instruments used.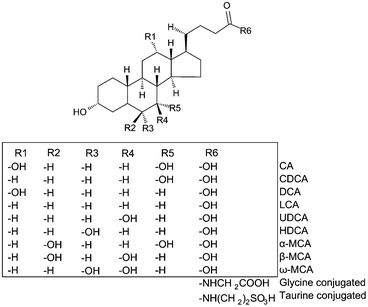 | ||
| Fig. 1 Structure of BAs. | ||
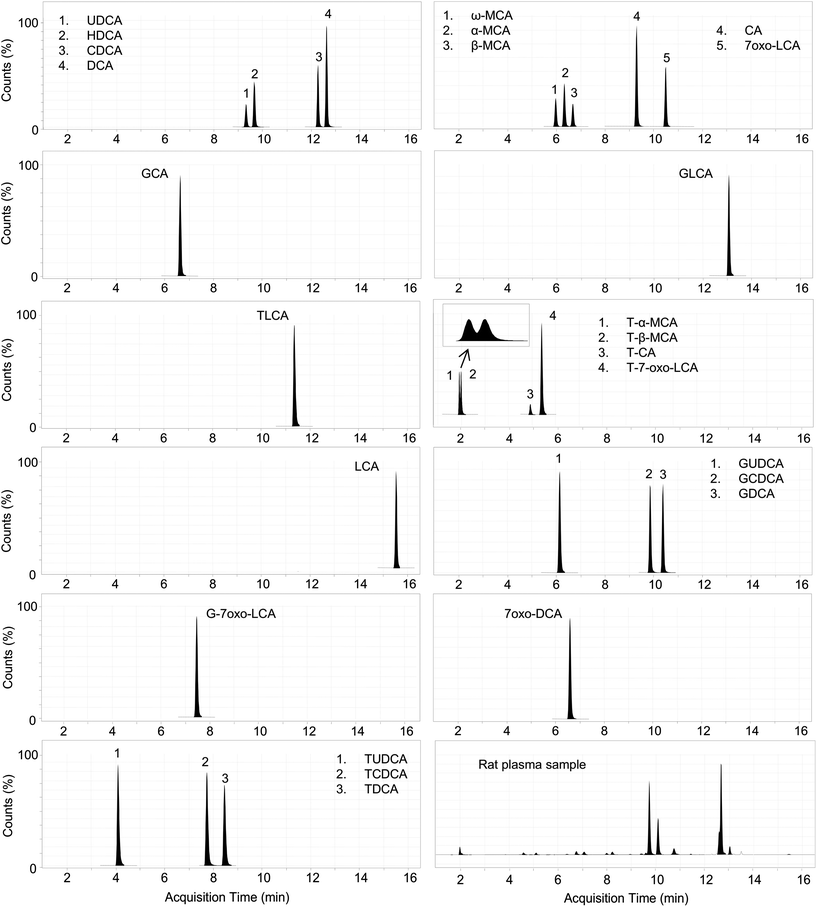 | ||
| Fig. 2 Representative chromatogram of bile acids extracted from a plasma sample and charcoal-treated rat serum spiked with 24 bile acids standard. | ||
Fragmentation of BAs
To achieve higher specificity and sensitivity in the quantitative analysis of BAs in biological samples, we aimed at defining MRM transitions for each metabolite, including unconjugated BAs (Table 1). Several earlier studies reported stable fragments for conjugated BAs; however, identical precursors and product ions were employed for the quantification of free BAs.11,13–23 This approach is called selective ion monitoring (SIM) and, although useful, it has limited specificity.10 There are only a few studies on the fragmentation of unconjugated BAs,24,25 and it is important to identify and validate novel fragments that may enhance sensitivity and specificity for the quantification of BAs in biological matrices. Fragmentation of BAs was defined by direct injection of each individual standard into the MS, and identification of the most abundant fragments was performed using Optimizer software (Agilent technologies). Glycine- and taurine-conjugated BAs were efficiently fragmented, yielding the product ions m/z 74 and 126, respectively. This fragmentation pattern is derived from the elimination of glycine and taurine, respectively.38 The unconjugated BAs 7-oxoLCA, 7-oxoDCA, α-MCA, β-MCA, ω-MCA and CA yielded product ions by the consecutive neutral loss of water molecules, so-called dehydrated BAs. HDCA, UDCA, CDCA and DCA were fragmented to generate the ion m/z 95.1, whereas LCA was monitored with m/z 135.1. Deuterium-labeled IS yielded fragmentation patterns similar to those of their corresponding non-deuterated forms (Table 1). In a recent study Qiao, et al. characterized the fragmentation behavior of BAs.38 They found similar fragmentation patterns for taurine- and glycine-conjugated BAs and also observed the neutral loss of water for CA and the ion m/z 135.1 for LCA. However, the ion m/z 95.1 for CDCA, UDCA, HDCA and DCA detected in the present study has not yet been described or validated.38 The differences in fragmentation behavior and peak abundances are probably due to limitations in low mass measurements by the different instruments used. Although Qiao et al. reported on the fragmentation patterns of several BAs, they did not investigate the applicability, reproducibly and robustness of BA fragments for MRM quantification. Here, we report the identification and applicability of novel fragments for the quantification of free BAs using UPLC-MS/MS. The use of fragmentation conditions not only for conjugated, but also for unconjugated BAs is expected to enhance specificity and sensitivity of measurements.Inter- and intra-day accuracy, precision, linearity and lower limits of quantification (LLOQ)
Overall accuracy and precision were appropriate for all measurements (Table 2). Intra- and inter-day accuracy ranged from 85% to 115%. Intra- and inter-day precision measured as coefficient of variation (CV) (%) ranged from 1.1% to 15.0% (Table 2). Accuracy and precision were also evaluated for selected bile acids (TCA, GCDCA, GUDCA, DCA, CA, LCA, CDCA and α-MCA) in a fortification assay by adding 3 increasing concentrations (+25%, +50% and +100% of endogenous) to samples, and acceptable accuracy and precision intervals were obtained (data not shown). Linearity of calibration curves was acceptable with a correlation coefficient after linear regression of ≥ 0.99 (Table 3). The LLOQ was defined as the lowest concentration of a given analyte with a signal-to-noise ratio (SNR) ≥ 10. The LLOQs for BAs obtained in the present study ranged from 200 pM to 25 nM. Surprisingly, T-CDCA, T-DCA, T-LCA, T-β-MCA and T-UDCA reached LLOQs at the pM range and are remarkably lower than those of previous studies (Table 3).18,23 This can be explained by employing MRM and using specific fragments for quantification of BAs, thereby reducing the SNR in the second mass filter and improving sensitivity. Recently, García-Cañaveras et al. reported comparable LLOQs for a number of unconjugated BAs in 25 μL of sample volume using SIM operated in negative ion mode, differences that are likely to be caused by different sensitivities of the instruments used.23 Nevertheless, MRM is generally accepted as the superior approach for the specific determination of chemicals, and therefore its usage is likely to improve the quality of data generated.| QC 2 nM | QC 4 nM | QC 100 nM | QC 1000 nM | QC 2000 nM | ||||||
|---|---|---|---|---|---|---|---|---|---|---|
| CV (%) | Accuracy (%) | CV (%) | Accuracy (%) | CV (%) | Accuracy (%) | CV (%) | Accuracy (%) | CV (%) | Accuracy (%) | |
| a CV: coefficient of variation. N.D.: not determined owing to concentration below lower limit of quantification. | ||||||||||
| Intra-day | ||||||||||
| CA | N.D. | N.D. | 6.4 | 100.0 | 2.5 | 111.1 | 1.5 | 93.0 | ||
| CDCA | N.D. | N.D. | 2.1 | 88.0 | 2.2 | 99.3 | 1.9 | 102.7 | ||
| DCA | N.D. | N.D. | 3.1 | 90.6 | 2.6 | 101.0 | 4.8 | 103.3 | ||
| 7-oxoDCA | N.D. | N.D. | 8.3 | 104.6 | 3.2 | 101.0 | 2.7 | 98.3 | ||
| HDCA | N.D. | N.D. | 10.2 | 88.7 | 9.6 | 110.4 | 11.1 | 103.4 | ||
| LCA | N.D. | N.D. | 6.2 | 94.2 | 3.8 | 95.0 | 6.4 | 98.5 | ||
| 7-oxoLCA | N.D. | N.D. | 5.1 | 109.9 | 3.2 | 102.4 | 6.3 | 102.7 | ||
| α-MCA | N.D. | N.D. | 2.4 | 106.8 | 1.4 | 98.6 | 5.1 | 105.9 | ||
| β-MCA | N.D. | N.D. | 6.5 | 103.7 | 4.3 | 108.0 | 2.4 | 101.7 | ||
| ω-MCA | N.D. | N.D. | 5.9 | 95.8 | 2.2 | 108.7 | 9.5 | 98.6 | ||
| UDCA | N.D. | N.D. | 8.6 | 96.3 | 3.5 | 106.0 | 3.9 | 102.3 | ||
| G-CA | N.D. | 12.9 | 95.2 | 2.9 | 87.5 | 4.2 | 105.8 | 4.5 | 96.5 | |
| G-CDCA | N.D. | N.D. | 2.4 | 91.2 | 2.3 | 104.2 | 1.8 | 90.6 | ||
| G-DCA | 8.9 | 102.0 | 8.3 | 92.5 | 2.0 | 90.1 | 3.6 | 104.8 | 1.9 | 103.1 |
| G-LCA | 10.4 | 111.1 | 7.4 | 102.6 | 2.7 | 90.1 | 6.4 | 100.2 | 1.9 | 99.5 |
| G-7-oxo-LCA | 5.4 | 113.8 | 3.3 | 88.5 | 1.5 | 86.8 | 3.2 | 108.0 | 3.6 | 94.6 |
| G-UDCA | 7.7 | 106.8 | 11.7 | 102.6 | 3.2 | 95.4 | 6.8 | 112.5 | 1.7 | 94.7 |
| T-CA | 9.3 | 96.2 | 8.8 | 105.3 | 4.7 | 94.3 | 1.9 | 101.9 | 3.2 | 96.3 |
| T-CDCA | 10.6 | 88.4 | 8.2 | 91.7 | 3.8 | 93.8 | 2.6 | 105.0 | 3.2 | 104.5 |
| T-DCA | 9.4 | 103.3 | 3.0 | 87.7 | 4.8 | 98.0 | 2.4 | 96.6 | 3.3 | 99.4 |
| T-LCA | 8.6 | 108.2 | 12.6 | 101.0 | 4.2 | 99.4 | 4.6 | 100.0 | 4.0 | 96.7 |
| T-7-oxo-LCA | 14.8 | 92.6 | 6.4 | 97.6 | 3.4 | 92.9 | 4.2 | 93.5 | 3.2 | 98.6 |
| T-β-MCA | 7.2 | 114.9 | 12.6 | 101.0 | 4.1 | 100.6 | 6.9 | 97.7 | 4.2 | 99.4 |
| T-UDCA | 12.2 | 92.3 | 5.2 | 97.1 | 3.9 | 96.5 | 3.0 | 104.7 | 4.5 | 97.6 |
| Inter-day | ||||||||||
| CA | N.D. | 5.5 | 96.8 | 5.2 | 99.4 | 4.4 | 97.0 | 3.8 | 93.8 | |
| CDCA | N.D. | 6.0 | 93.4 | 2.2 | 97.4 | 1.9 | 95.1 | 3.8 | 97.1 | |
| DCA | N.D. | 3.5 | 93.8 | 4.0 | 93.0 | 1.7 | 96.4 | 2.0 | 100.0 | |
| 7-oxoDCA | N.D. | N.D. | 5.1 | 106.6 | 1.9 | 100.2 | 1.2 | 104.0 | ||
| HDCA | N.D. | N.D. | 4.6 | 92.0 | 3.0 | 94.8 | 3.7 | 96.1 | ||
| LCA | N.D. | N.D. | 4.3 | 97.8 | 1.8 | 93.3 | 2.9 | 99.8 | ||
| 7-oxoLCA | N.D. | N.D. | 4.4 | 104.0 | 5.9 | 92.3 | 4.4 | 99.1 | ||
| α-MCA | N.D. | N.D. | 3.8 | 99.4 | 3.5 | 92.4 | 5.4 | 98.1 | ||
| β-MCA | N.D. | N.D. | 5.5 | 96.5 | 4.3 | 94.9 | 5.3 | 99.2 | ||
| ω-MCA | N.D. | N.D. | 3.7 | 95.0 | 2.1 | 97.5 | 6.7 | 95.6 | ||
| UDCA | N.D. | N.D. | 7.1 | 97.2 | 4.8 | 93.7 | 1.8 | 98.3 | ||
| G-CA | N.D. | 4.8 | 102.9 | 1.8 | 91.8 | 2.4 | 99.5 | 3.4 | 101.7 | |
| G-CDCA | N.D. | N.D. | 2.3 | 92.9 | 1.8 | 97.9 | 1.9 | 93.2 | ||
| G-DCA | 12.3 | 90.1 | 7.2 | 96.0 | 2.4 | 93.3 | 2.3 | 98.7 | 4.9 | 101.4 |
| G-LCA | 9.2 | 105.6 | 4.8 | 94.9 | 1.3 | 88.9 | 1.3 | 98.0 | 1.4 | 99.8 |
| G-7-oxo-LCA | 9.3 | 109.5 | 2.1 | 90.6 | 2.2 | 90.7 | 1.7 | 99.0 | 1.8 | 98.3 |
| G-UDCA | 9.5 | 102.7 | 7.8 | 100.8 | 2.9 | 96.1 | 2.4 | 98.2 | 1.5 | 94.7 |
| T-CA | 8.5 | 96.8 | 4.7 | 90.9 | 2.8 | 95.1 | 1.8 | 99.3 | 1.4 | 101.4 |
| T-CDCA | 12.0 | 90.6 | 4.6 | 91.5 | 3.3 | 96.4 | 2.9 | 104.4 | 4.0 | 96.8 |
| T-DCA | 14.2 | 102.1 | 2.5 | 86.8 | 2.1 | 96.2 | 5.0 | 99.9 | 1.1 | 104.2 |
| T-LCA | 8.2 | 111.4 | 4.2 | 98.0 | 2.2 | 98.1 | 3.2 | 101.4 | 1.7 | 102.7 |
| T-7-oxo-LCA | 15.0 | 95.2 | 2.2 | 93.9 | 3.2 | 94.9 | 1.3 | 95.6 | 1.4 | 102.1 |
| T-β-MCA | 11.7 | 109.5 | 5.5 | 92.4 | 2.1 | 95.1 | 4.3 | 99.9 | 2.8 | 104.3 |
| T-UDCA | 12.3 | 95.4 | 2.5 | 87.2 | 3.1 | 94.3 | 3.7 | 104.7 | 3.1 | 105.5 |
| Bile acids | LLOQ (nM) | SNR | RT (min) | Linearity (R2) | Calibration range (nM) | Extraction recoveriesa (%) | ||
|---|---|---|---|---|---|---|---|---|
| 20 nM | 200 nM | 2 μM | ||||||
| a Data are presented as the average ± %R.S.D of three levels of QC concentrations (20 nM, 200 nM and 2 μM), six samples per concentration. b N.A. not applicable: LLOQs were determined as the lowest concentration in which these analytes were quantified with sufficient precision (CV of 15%) and accuracy (between 85% and 115%). | ||||||||
| CA | 3 | 11 ± 4 | 9.3 | 0.9921 | 4000–0.98 | 78 ± 30 | 97 ± 14 | 70 ± 11 |
| CDCA | 3 | 13 ± 4 | 12.3 | 0.9914 | 4000–0.98 | 76 ± 3 | 94 ± 12 | 83 ± 8 |
| DCA | 3 | 10 ± 1 | 12.6 | 0.9985 | 4000–0.98 | 75 ± 12 | 86 ± 26 | 63 ± 7 |
| 7-oxoDCA | 25 | 11 ± 1 | 6.6 | 0.9955 | 4000–7.8 | 78 ± 9 | 71 ± 16 | 73 ± 5 |
| HDCA | 8 | 11 ± 2 | 9.6 | 0.9957 | 4000–7.8 | 43 ± 8 | 33 ± 6 | 39 ± 9 |
| LCA | 13 | 10 ± 2 | 15.5 | 0.9963 | 4000–7.8 | 95 ± 13 | 60 ± 4 | 68 ± 4 |
| 7-oxoLCA | 8 | 10 ± 2 | 10.5 | 0.9902 | 4000–7.8 | 76 ± 22 | 68 ± 5 | 79 ± 3 |
| α-MCA | 13 | 17 ± 3 | 6.3 | 0.9952 | 4000–7.8 | 77 ± 6 | 64 ± 12 | 60 ± 9 |
| β-MCA | 13 | 11 ± 2 | 6.7 | 0.9922 | 4000–7.8 | 77 ± 11 | 66 ± 13 | 61 ± 8 |
| ω-MCA | 13 | 16 ± 4 | 5.9 | 0.9954 | 4000–7.8 | 76 ± 7 | 59 ± 7 | 54 ± 2 |
| UDCA | 13 | 11 ± 2 | 9.3 | 0.9962 | 4000–7.8 | 62 ± 15 | 68 ± 6 | 74 ± 4 |
| G-CA | 3 | N.A.b | 6.6 | 0.9926 | 4000–0.98 | 79 ± 13 | 71 ± 15 | 52 ± 12 |
| G-CDCA | 6 | N.A.b | 9.8 | 0.9970 | 4000–0.98 | 61 ± 6 | 58 ± 12 | 61 ± 8 |
| G-DCA | 1 | N.A.b | 10.4 | 0.9978 | 4000–0.98 | 57 ± 24 | 62 ± 3 | 58 ± 5 |
| G-LCA | 1 | 17 ± 4 | 13.1 | 0.9936 | 4000–0.98 | 53 ± 1 | 56 ± 5 | 69 ± 4 |
| G-7-oxoLCA | 1 | 18 ± 4 | 7.5 | 0.9910 | 4000–0.98 | 55 ± 1 | 64 ± 3 | 77 ± 6 |
| G-UDCA | 1 | 12 ± 3 | 6.1 | 0.9951 | 4000–0.98 | 60 ± 12 | 60 ± 6 | 73 ± 5 |
| T-CA | 1 | 14 ± 3 | 4.5 | 0.9955 | 4000–0.98 | 67 ± 18 | 92 ± 10 | 80 ± 4 |
| T-CDCA | 0.2 | 10 ± 4 | 7.7 | 0.9900 | 4000–0.1221 | 65 ± 17 | 87 ± 9 | 89 ± 6 |
| T-DCA | 0.2 | 10 ± 3 | 8.3 | 0.9947 | 4000–0.1221 | 78 ± 12 | 73 ± 6 | 83 ± 5 |
| T-LCA | 0.4 | 12 ± 1 | 11.4 | 0.9910 | 4000–0.1221 | 62 ± 2 | 79 ± 5 | 93 ± 4 |
| T-7-oxoLCA | 1 | 14 ± 3 | 5.2 | 0.9963 | 4000–0.98 | 60 ± 4 | 81 ± 3 | 96 ± 4 |
| T-β-MCA | 0.2 | 10 ± 3 | 1.9 | 0.9945 | 4000–0.1221 | 71 ± 10 | 110 ± 3 | 80 ± 6 |
| T-UDCA | 0.2 | 11 ± 1.5 | 4.1 | 0.9967 | 4000–0.1221 | 73 ± 3 | 78 ± 4 | 93 ± 3 |
Extraction recovery and matrix effects
Since it was reported that solid phase extraction (SPE) is not optimal for BA extraction owing to low recovery for some analytes,23 and to avoid excessive sample handling, a single extraction step using acetonitrile was performed in the present method. The deuterium-labeled IS UDCA-d4, CDCA-d4, LCA-d4, G-UDCA-d4, G-CA-d4, CA-d4 and DCA-d4 were included to minimize possible bias during extraction.Low extraction recoveries were observed for a few BAs (HDCA, G-DCA, G-LCA and G-UDCA), in contrast to a previous study using a similar extraction procedure.14 A possible explanation for these discrepancies may be the presence of matrix components interfering with the extraction of the aforementioned BAs, because identical experiments using charcoal-treated instead of untreated rat serum provided superior extraction recoveries (Table S1†). Overall, extraction recoveries using acetonitrile were reproducible across the concentration studied and ranged from 33% to 110% in untreated serum and from 70% to 88% in charcoal-treated serum. According to the FDA guidelines for validation of analytical methods, the recovery of a given analyte does not need to be 100%, but the amount of recovery must be consistent, precise and reproducible.34 Due to the fact that HDCA extraction recovery was discrepant between untreated and charcoal-treated samples, its value may not reflect the absolute concentration. Regarding matrix effects, the ionization of BAs studied was not affected by the matrix components at the three concentrations studied (Table 4). Overall, our findings are in line with that of other investigators.18
| Relative response (%) | |||
|---|---|---|---|
| 20 nM | 200 nM | 2000 nM | |
| a Data is presented as the average ± CV (%). | |||
| CA | 108 ± 6 | 99 ± 14 | 114 ± 5 |
| CDCA | 91 ± 3 | 110 ± 6 | 115 ± 1 |
| DCA | 90 ± 15 | 114 ± 1 | 114 ± 3 |
| 7-oxoDCA | 87 ± 10 | 104 ± 10 | 110 ± 2 |
| HDCA | 100 ± 10 | 111 ± 5 | 111 ± 1 |
| LCA | 77 ± 9 | 105 ± 1 | 106 ± 3 |
| 7-oxoLCA | 87 ± 10 | 115 ± 7 | 114 ± 5 |
| α-MCA | 103 ± 15 | 103 ± 8 | 109 ± 1 |
| β-MCA | 95 ± 13 | 104 ± 10 | 115 ± 3 |
| ω-MCA | 92 ± 13 | 99 ± 6 | 112 ± 2 |
| UDCA | 97 ± 7 | 105 ± 9 | 113 ± 2 |
| G-CA | 89 ± 15 | 102 ± 8 | 113 ± 2 |
| G-CDCA | 92 ± 12 | 102 ± 7 | 114 ± 1 |
| G-DCA | 96 ± 15 | 114 ± 2 | 111 ± 4 |
| G-LCA | 107 ± 2 | 113 ± 2 | 115 ± 2 |
| G-7-oxo-LCA | 112 ± 3 | 113 ± 1 | 111 ± 2 |
| G-UDCA | 105 ± 4 | 120 ± 1 | 115 ± 3 |
| T-CA | 98 ± 3 | 96 ± 6 | 115 ± 2 |
| T-CDCA | 114 ± 6 | 107 ± 3 | 114 ± 2 |
| T-DCA | 111 ± 10 | 113 ± 1 | 118 ± 1 |
| T-LCA | 106 ± 7 | 114 ± 1 | 112 ± 3 |
| T-7-oxo-LCA | 99 ± 2 | 112 ± 2 | 111 ± 2 |
| T-β-MCA | 84 ± 12 | 99 ± 6 | 97 ± 4 |
| T-UDCA | 98 ± 4 | 115 ± 4 | 115 ± 2 |
Profiling of circulating BAs in sham-operated and uninephrectomized rats
We hypothesized that reduced renal function might affect BA homeostasis due to reduced filtration capacity and/or proximal tubular reuptake. Therefore, we applied the established UPLC-MS/MS method to determine BA profiles in sham-operated and uninephrectomized male Sprague-Dawley rats following one, two and four weeks after the surgical intervention (Table 5). A 2-fold increase in circulating total primary BAs was observed one week after uninephrectomy, which was fully reversed after the second week. The two most abundant primary BAs, CA and CDCA, were increased by 2.3- and 2.2-fold at one week post-surgery. The amount of total secondary BAs was also slightly elevated one week after uninephrectomy, followed by reversal to normal levels at the second week. In contrast to primary BAs, total taurine-conjugated BAs remained unchanged at one week post-surgery, but they were increased by 40% after the second week and tended to be higher by 20% after the fourth week, suggesting a delayed response. Thus, the established method allowed the detection of transient changes in the levels of circulating BAs following uninephrectomy in rats.| 1 Week sham | 1 Week UNX | Fold increase | 1 Week sham | 2 Weeks UNX | Fold increase | 4 Weeks sham | 4 Weeks UNX | Fold increase | |
|---|---|---|---|---|---|---|---|---|---|
| a The results are expressed in nM as mean ± standard deviation (n = 8). N.D.: not detected. Underlined values represent below lower limit of quantification. Sham, sham-operated control rats; UNX, uninephrectomized rats. Statistics: * for p ≤ 0.05. | |||||||||
| Primary BAs | |||||||||
| α-MCA | 381 ± 332 | 642 ± 326 | 1.7 | 616 ± 486 | 481 ± 391 | 0.8 | 256 ± 187 | 328 ± 2000 | 1.3 |
| β-MCA | 357 ± 335 | 428 ± 166 | 1.2 | 346 ± 256 | 429 ± 384 | 1.2 | 252 ± 201 | 338 ± 235 | 1.3 |
| CDCA | 483 ± 420 | 1052 ± 436* | 2.2 | 801 ± 576 | 794 ± 577 | 1 | 644 ± 602 | 380 ± 310 | 0.6 |
| CA | 795 ± 653 | 1860 ± 1515 | 2.3 | 1037 ± 881 | 1192 ± 1094 | 1.1 | 884 ± 576 | 830 ± 669 | 0.9 |
| Total | 2016 ± 202 | 3983 ± 632* | 2 | 2800 ± 292 | 2896 ± 351 | 1 | 2035 ± 310 | 1878 ± 242 | 0.9 |
| Secondary BAs | |||||||||
| LCA | 14 ± 7 | 17 ± 9 | 1.3 | 9 ± 6 | 14 ± 4 | 1.6 | 5 ± 1 | 6 ± 2 | 1.2 |
| DCA | 22 ± 15 | 46 ± 34 | 2.1 | 38 ± 27 | 58 ± 48 | 1.5 | 40 ± 25 | 55 ± 24 | 1.4 |
| UDCA | 176 ± 161 | 300 ± 137 | 1.7 | 243 ± 162 | 230 ± 168 | 0.9 | 131 ± 62 | 160 ± 93 | 1.2 |
| HDCA | 199 ± 119 | 214 ± 158 | 1.1 | 372 ± 371 | 398 ± 419 | 1.1 | 209 ± 247 | 213 ± 248 | 1 |
| 7-oxoLCA | 23 ± 25 | 38 ± 23 | 1.6 | 35 ± 30 | 55 ± 52 | 1.6 | 22 ± 16 | 23 ± 14 | 1.1 |
| 7-oxoDCA | 482 ± 590 | 479 ± 222 | 1 | 716 ± 779 | 645 ± 745 | 0.9 | 249 ± 254 | 323 ± 184 | 1.3 |
| ω-MCA | 69 ± 36 | 111 ± 61 | 1.6 | 107 ± 79 | 163 ± 155 | 1.5 | 90 ± 64 | 121 ± 67 | 1.4 |
| Total | 986 ± 169 | 1204 ± 170* | 1.2 | 1519 ± 256 | 1563 ± 228 | 1.0 | 746 ± 94 | 901 ± 114 | 1.2 |
| Taurine-conjugated BAs | |||||||||
| T-UDCA | 3 ± 1 | 4 ± 1* | 1.2 | 3 ± 1 | 5 ± 4* | 1.9 | 2 ± 1 | 4 ± 3 | 1.5 |
| T-CDCA | 52 ± 22 | 59 ± 16 | 1.1 | 33 ± 19 | 31 ± 13 | 0.9 | 25 ± 10 | 34 ± 21 | 1.3 |
| T-CA | 150 ± 38 | 189 ± 79 | 1.3 | 134 ± 73 | 213 ± 85* | 1.6 | 123 ± 60 | 190 ± 124 | 1.5 |
| T-DCA | 6 ± 4 | 8 ± 6 | 1.3 | 7 ± 3 | 12 ± 9 | 1.8 | 7 ± 5 | 12 ± 9 | 1.8 |
| T-LCA | N.D. | 1 ± 0.7* | N.D. | 2 ± 4 | N.D. | 1 ± 0.6* | |||
| T-α-MCA | 320 ± 100 | 300 ± 88 | 0.9 | 279 ± 99 | 348 ± 159 | 1.2 | 269 ± 92 | 286 ± 168 | 1.1 |
| T-β-MCA | 56 ± 31 | 47 ± 7 | 0.8 | 48 ± 29 | 85 ± 64 | 1.8 | 62 ± 26 | 67 ± 48 | 1.1 |
| T-7oxo-LCA | 3 ± 1 | 3 ± 1 | 1.3 | 2 ± 1 | 5 ± 3* | 2 | 3 ± 1 | 3 ± 2 | 1.2 |
| Total | 591 ± 112 | 612 ± 110 | 1 | 506 ± 98 | 700 ± 127 | 1.4 | 490 ± 94 | 597 ± 107 | 1.2 |
| Glycine-conjugated BAs | |||||||||
| G-CA | 29 ± 13 | 27 ± 15 | 0.9 | 51 ± 58 | 93 ± 95 | 1.8 | 79 ± 84 | 84 ± 76 | 1.1 |
| G-UDCA | N.D. | N.D. | N.D. | N.D. | N.D. | N.D. | |||
| G-CDCA | 3 ± 1 | 3 ± 2 | 0.9 | 5 ± 2 | 8 ± 8 | 1.6 | 7 ± 6 | 7 ± 6 | 1 |
| G-DCA | 0.4 ± 0.4 | 1 ± 0.9 | 1.2 | 1.5 ± 1.6 | 4 ± 6 | 2.9 | 3 ± 4 | 4 ± 3 | 1.2 |
| G-LCA | N.D. | N.D. | N.D. | N.D. | N.D. | N.D. | |||
| G-7oxo-LCA | N.D. | N.D. | N.D. | N.D. | N.D. | N.D. | |||
| Total | 33 ± 14 | 31 ± 13 | 0.9 | 57 ± 24 | 106 ± 44 | 1.8 | 90 ± 38 | 95 ± 40 | 1.1 |
Conclusions
We established a method for the quantification of BAs in serum and plasma by employing specific fragmentation of BAs, which has demonstrated to be robust, reproducible and accurate, thus enhancing the specificity of the quantitative analysis of BAs in biological samples. We applied the method to study the impact of uninephrectomy in healthy rats on BA homeostasis and observed that impaired kidney function indeed alters BA homeostasis by transiently increasing their circulating concentrations. The mechanisms and physiological significance of these findings remain to be further investigated.Acknowledgements
We thank Jean-François Cajot, University of Fribourg, for support in animal experimentation and Dr Alan F. Hofmann, University of California at San Diego, for providing some of the bile acid standards. This work was supported by the NCCR Kidney.CH, funded by the Swiss National Science Foundation.Notes and references
- A. F. Hofmann, Hepatology, 2009, 49, 1403–1418 CrossRef CAS.
- M. J. Monte, J. J. G. Marin, A. Antelo and J. Vazquez-Tato, World J. Gastroenterol., 2009, 15, 804–816 CrossRef CAS.
- C. Thomas, R. Pellicciari, M. Pruzanski, J. Auwerx and K. Schoonjans, Nat. Rev. Drug Discovery, 2008, 7, 678–693 CrossRef CAS.
- W. Huang, K. Ma, J. Zhang, M. Qatanani, J. Cuvillier, J. Liu, B. Dong, X. Huang and D. D. Moore, Science, 2006, 312, 233–236 CrossRef CAS.
- C. Thomas, A. Gioiello, L. Noriega, A. Strehle, J. Oury, G. Rizzo, A. Macchiarulo, H. Yamamoto, C. Mataki, M. Pruzanski, R. Pellicciari, J. Auwerx and K. Schoonjans, Cell Metab., 2009, 10, 167–177 CrossRef CAS.
- P. B. Hylemon, H. Zhou, W. M. Pandak, S. Ren, G. Gil and P. Dent, J. Lipid Res., 2009, 50, 1509–1520 CrossRef CAS.
- A. A. Khan, E. C. Chow, R. J. Porte, K. S. Pang and G. M. Groothuis, Toxicol. in Vitro, 2011, 25, 80–90 CrossRef CAS.
- J. Prawitt, S. Caron and B. Staels, Curr. Diabetes Rep., 2011, 11, 160–166 CrossRef CAS.
- T. W. Pols, L. G. Noriega, M. Nomura, J. Auwerx and K. Schoonjans, J. Hepatol., 2011, 54, 1263–1272 CrossRef CAS.
- W. J. Griffiths and J. Sjovall, J. Lipid Res., 2009, 51, 23–41 CrossRef CAS.
- X. Xiang, Y. Han, M. Neuvonen, J. Laitila, P. J. Neuvonen and M. Niemi, J. Chromatogr., B: Anal. Technol. Biomed. Life Sci., 2010, 878, 51–60 CrossRef CAS.
- T. Higashi, Y. Shibayama, T. Ichikawa, K. Ito, T. Toyo'oka, K. Shimada, K. Mitamura, S. Ikegawa and H. Chiba, Steroids, 2010, 75, 338–345 CrossRef CAS.
- L. Yang, A. Xiong, Y. He, Z. Wang, C. Wang, Z. Wang, W. Li, L. Yang and Z. Hu, Chem. Res. Toxicol., 2008, 21, 2280–2288 CrossRef CAS.
- Y. Alnouti, I. L. Csanaky and C. D. Klaassen, J. Chromatogr., B: Anal. Technol. Biomed. Life Sci., 2008, 873, 209–217 CrossRef CAS.
- J. Huang, S. P. R. Bathena, I. L. Csanaky and Y. Alnouti, J. Pharm. Biomed. Anal., 2011, 55, 1111–1119 CrossRef CAS.
- M. Scherer, C. Gnewuch, G. Schmitz and G. Liebisch, J. Chromatogr., B: Anal. Technol. Biomed. Life Sci., 2009, 877, 3920–3925 CrossRef CAS.
- M. Hagio, M. Matsumoto, M. Fukushima, H. Hara and S. Ishizuka, J. Lipid Res., 2009, 50, 173–180 CrossRef CAS.
- C. Steiner, A. von Eckardstein and K. M. Rentsch, J. Chromatogr., B: Anal. Technol. Biomed. Life Sci., 2010, 878, 2870–2880 CrossRef CAS.
- X. Qiao, M. Ye, C. Xiang, T. Bo, W.-z. Yang, C.-f. Liu, W.-j. Miao and D.-a. Guo, Steroids, 2012, 77, 745–755 CrossRef CAS.
- M. Ando, T. Kaneko, R. Watanabe, S. Kikuchi, T. Goto, T. Iida, T. Hishinuma, N. Mano and J. Goto, J. Pharm. Biomed. Anal., 2006, 40, 1179–1186 CrossRef CAS.
- I. Burkard, A. von Eckardstein and K. M. Rentsch, J. Chromatogr., B: Anal. Technol. Biomed. Life Sci., 2005, 826, 147–159 CrossRef CAS.
- E. J. Want, M. Coen, P. Masson, H. C. Keun, J. T. M. Pearce, M. D. Reily, D. G. Robertson, C. M. Rohde, E. Holmes, J. C. Lindon, R. S. Plumb and J. K. Nicholson, Anal. Chem., 2010, 82, 5282–5289 CrossRef CAS.
- J. C. García-Canãveras, M. T. Donato, J. V. Castell and A. Lahoz, J. Lipid Res., 2012, 53, 2231–2241 CrossRef.
- N. Janzen, S. Sander, M. Terhardt, A. M. Das, J. O. Sass, R. Kraetzner, H. Rosewich, M. Peter and J. Sander, J. Lipid Res., 2010, 51, 1591–1598 CrossRef CAS.
- X. Qiao, M. Ye, D.-l. Pan, W.-j. Miao, C. Xiang, J. Han and D.-a. Guo, J. Chromatogr., A, 2011, 1218, 107–117 CrossRef CAS.
- A. Odermatt, Am. J. Physiol.: Renal Physiol., 2011, 301, F919–F931 CrossRef CAS.
- H.-L. Zhao, Y. Sui, L. He, J. Guan, S.-J. Xiao, D.-R. Zhong, Q. Xu and S.-E. Zeng, Acta Diabetol. Lat., 2011, 48, 317–328 CrossRef CAS.
- H.-L. Zhao, Y. Sui, J. Guan, L. He, X. Zhu, R.-R. Fan, G. Xu, A. P. S. Kong, C. S. Ho, F. M. M. Lai, D. K. Rowlands, J. C. N. Chan and P. C. Y. Tong, Kidney Int., 2008, 74, 467–477 CrossRef CAS.
- M. Odamaki, R. Furuya, S. Ohkawa, T. Yoneyama, M. Nishikino, A. Hishida and H. Kumagai, Nephrol., Dial., Transplant., 1999, 14, 2427–2432 CrossRef CAS.
- T. Li, E. Owsley, M. Matozel, P. Hsu, C. M. Novak and J. Y. L. Chiang, Hepatology, 2010, 52, 678–690 CrossRef CAS.
- K. Ma, P. K. Saha, L. Chan and D. D. Moore, J. Clin. Invest., 2006, 116, 1102–1109 CrossRef CAS.
- Y. Zhang, F. Y. Lee, G. Barrera, H. Lee, C. Vales, F. J. Gonzalez, T. M. Willson and P. A. Edwards, Proc. Natl. Acad. Sci. U. S. A., 2006, 103, 1006–1011 CrossRef CAS.
- T. Li, M. Matozel, S. Boehme, B. Kong, L.-M. Nilsson, G. Guo, E. Ellis and J. Y. L. Chiang, Hepatology, 2011, 53, 996–1006 CrossRef CAS.
- FDA. http://www.fda.gov/downloads/Drugs/GuidanceComplianceRegulatoryInformation/Guidances/UCM070107.pdf.
- L. Humbert, M. A. Maubert, C. Wolf, H. Duboc, M. Mahé, D. Farabos, P. Seksik, J. M. Mallet, G. Trugnan, J. Masliah and D. Rainteau, J. Chromatogr., B: Anal. Technol. Biomed. Life Sci., 2012, 899, 135–145 CrossRef CAS.
- I. Bobeldijk, M. Hekman, J. de Vries-van der Weij, L. Coulier, R. Ramaker, R. Kleemann, T. Kooistra, C. Rubingh, A. Freidig and E. Verheij, J. Chromatogr., B: Anal. Technol. Biomed. Life Sci., 2008, 871, 306–313 CrossRef CAS.
- S. Perwaiz, B. Tuchweber, D. Mignault, T. Gilat and I. M. Yousef, J. Lipid Res., 2001, 42, 114–119 CAS.
- X. Qiao, M. Ye, C.-f. Liu, W.-z. Yang, W.-j. Miao, J. Dong and D.-a. Guo, Steroids, 2012, 77, 204–211 CrossRef CAS.
Footnote |
| † Electronic supplementary information (ESI) available. See DOI: 10.1039/c3ay26520j |
| This journal is © The Royal Society of Chemistry 2013 |