A compact comprehensive two-dimensional gas chromatography (GC×GC) approach for the analysis of biogenic VOCs
Samuel J.
Edwards
,
Alastair C.
Lewis
*,
Stephen J.
Andrews
,
Richard T.
Lidster
,
Jacqueline F.
Hamilton
and
Christopher N.
Rhodes
Department of Chemistry, University of York, Heslington, York, North Yorkshire YO105DD, UK. E-mail: ally.lewis@york.ac.uk; Fax: +44 (0)1904 322516; Tel: +44 (0)1904 322522
First published on 12th October 2012
Abstract
We describe the development of a compact comprehensive two-dimensional gas chromatograph suitable for the measurement of biogenic VOCs in the atmosphere at part per billion mixing ratios. The design seeks to minimise instrument size and power consumption and maximise portability and autonomy. The instrument concept is to achieve high analyte selectivity for complex VOC mixture analysis using comprehensive two-dimensional GC (GC×GC), rather than hyphenation with larger more expensive detectors such as MS. Key features of the analytical approach are a custom-built miniature thermal desorption trap to collect and concentrate VOCs from the sample gas stream, a copper conducting direct column heating system and a valve-modulated interface to enable GC×GC. The high power and large form-factor turbulent GC oven is replaced by direct column heating (and cooling below ambient) by thermal transfer from copper bobbin holders with heating and cooling input from Peltier devices. The combination of two independent copper bobbins allows for independent control of the two columns needed for comprehensive GC. A heated two position 1/16′′ diaphragm valve is used to enable flow modulation between two columns, with analyte detection at the outlet of the second column using a miniaturised low cost photo-ionisation detector. The instrument sub-components are controlled by a Compact RIO computer (National Instruments) and purpose designed software written in LabVIEW allowing autonomous measurements. The complete system weighs 15 kg, is around the size of a desktop computer and has a mean power demand of 112 W when battery powered. Results on the sensitivity and linearity for isoprene collection and analysis of standard gas mixtures are presented along with a discussion of limiting factors that hinder field device performance.
1 Introduction
Volatile organic compounds are introduced to the atmosphere from a variety of sources, but by mass and on a global basis, their origins are primarily biogenic.1 Biogenic VOCs have attracted considerable interest over the past 50 years because of their effects on atmospheric chemistry, and air pollution in particular, and more recently on climate through their influence on the atmospheric oxidative balance, aerosol formation and the modification of greenhouse gas concentrations.1–4 Two techniques dominate the field of atmospheric VOC analysis: gas chromatography (GC) and proton transfer reaction mass spectrometry (PTR-MS). The latter technique is reviewed extensively and has particular advantages in terms of measurement speed.5,6 Gas chromatography is a slow method of analysis but remains central to the measurement of atmospheric VOCs arising from its ability to distinguish between isobaric interferences. This can include the many isomers of alkanes, alkenes and monoaromatics in the atmosphere that have identical nominal (and indeed exact) molecular masses. GC-MS and comprehensive two-dimensional gas chromatography (GC×GC) are especially suited to the separation of complex mixtures of biogenic VOCs since they resolve this complex class of C10 hydrocarbons on the basis of both their unique vapour pressures in combination with either mass spectra in the case of GC-MS or polarity in the case of GC×GC.7,8 Comprehensive gas chromatography is in principle a simpler approach to take for the measurement of biogenic VOCs compared to GC-MS. GC×GC employs two GC columns linked by a device called a modulator. The purpose of the modulator is to collect eluent from the first column and periodically inject it as a plug onto the second column; this is achieved using either a thermal launch or a fluidic one.7–9 A typical GC×GC system couples a non-polar primary column with a shorter, polar, secondary column. By using contrasting columns it is possible to resolve compounds that would not be separated by a single GC column. The second column is often shorter than the first to ensure that the entire sample injected by the modulator elutes before another sample is injected. This avoids wrap around where peaks from one modulation period elute during subsequent elution sequences. Samples elute rapidly from the second column (complete separation in 1–10 s) and with very narrow peak widths of the order 10–250 ms FWHM. This adds a requirement for a relatively fast response detector, typically a FID or mass spectrometer. Comprehensive GC provides increased peak capacity and improved sensitivity over conventional one-dimensional chromatography.7,8 It also produces ordered chromatograms where structurally related compounds appear in bands, which is useful for compound grouping and the identification of unknown species.Modern GC×GC instrumentation is sophisticated and highly sensitive, but it is bulky, power intensive and can require cryogens or cryo-coolers if a thermal modulation approach is taken. In situ field measurements in remote or hostile environments are often not possible because GC×GC instruments lack portability or require excessive consumables. Instead, environmental samples are often collected using Tedlar bags, adsorbent tubes, SPME fibres or gas canisters and transported to laboratories for analysis. This introduces the possibility of sample degradation during transport which can affect measurement accuracy, delays measurement, inevitably reduces time resolution and can ultimately lead to transport costs which greatly outweigh the analytical costs.
The lack of portability of conventional GC instruments has encouraged the development of microfabricated and miniaturised GC systems that are compact, robust and have low power demands.10–12 Several miniaturised GC instruments are available commercially though many are limited to isothermal operation and their resolving power is limited.13
In this paper we report the development of the first compact comprehensive GC×GC system suitable for the measurement of biogenic VOCs in the atmosphere. The design seeks to minimise size and power consumption in order to maximise portability so that the instrument could be used for in situ field measurements. As part of this development we have designed a new column heating system; GC columns are traditionally heated by a fan forced oven which is large, power intensive and not suitable for a portable system. Whilst resistively heated capillary columns present an excellent alternative for compact field portable instruments14–16 they are not yet widely commercially available. In our new column heating design, standard off the shelf fused silica capillary columns are heated by thermal transfer from heated copper holders or bobbins. Because the fragile columns are completely enclosed within the copper holders the system is sturdier than a conventional oven as well as being highly power efficient.
We have also constructed a miniaturised thermal desorption (TD) unit for the preconcentration of atmospheric samples. Commercial thermal desorption units are typically standalone devices which are coupled to GC systems by a heated transfer line. Our miniaturised TD unit is highly energy efficient and sufficiently small to be incorporated within the instrument. The complete miniaturised GC×GC system is controlled by an on-board computer, can run autonomously and demonstrates good sensitivity and separation when tested with standard VOC mixtures and atmospheric samples. The size, low cost of manufacture and power efficiency make the system ideal for the measurement of biogenic VOCs in the field.
2 Experimental
The GC×GC system has been manufactured from a mixture of commercial and custom made parts. The modular instrument architecture comprises: a thermal desorption (TD) unit for collecting atmospheric samples; a gas manifold controlling gas flow through the system; pneumatically controlled micro diaphragm valves for sample injection and for modulation; a copper column heating and cooling system and a photoionization detector (PID). The instrument is controlled by a National Instruments CompactRIO (cRIO) computer using customised software developed in LabVIEW. The completed system weighs around 15 kg (excluding gas supplies), has dimensions of 400 × 200 × 400 mm (W × H × L) and can be powered by two 12 VDC car batteries.2.1 Gas manifold
Helium (or hydrogen) carrier gas is supplied to the two GC columns via manual pressure regulators (Model 4000, Porter) which we chose over electronic flow control for their simplicity and low cost. Since the pressure regulators are set manually to one set point there is no compensation for flow changes as column temperatures are increased. A third gas regulator governs the compressed gas supply used to actuate the two pneumatic valves in the instrument. These can be actuated either by compressed air (if available) or by helium carrier gas, so limiting consumables to one gas cylinder for fieldwork. The diaphragm valves (detailed later) use less than 1 mL per actuation. Line pressures are measured using differential pressure transducers (MPX5700D, Freescale Semiconductor). Gas flow through the manifold is controlled by a series of two-way solenoid valves and a 6-port 2-position micro diaphragm valve (Valco Instruments). The diaphragm valve is pneumatically operated with the actuating gas supply controlled by a solenoid valve. The configuration of the solenoid valves for purging the TD unit with helium, trapping a sample and then injecting the sample onto the primary column is outlined in Fig. 1. The gas lines are 1/16′′ PEEK tubing except for the lines linking the TD unit to the diaphragm valve and on to the primary column. These are narrow bore stainless steel tubing (0.007′′ i.d., Supelco) and are heated by resistive heating wire. A 200 sccm flow meter (AWM3100V, Honeywell) is used to measure the flow rate through the TD unit when an air sample is collected.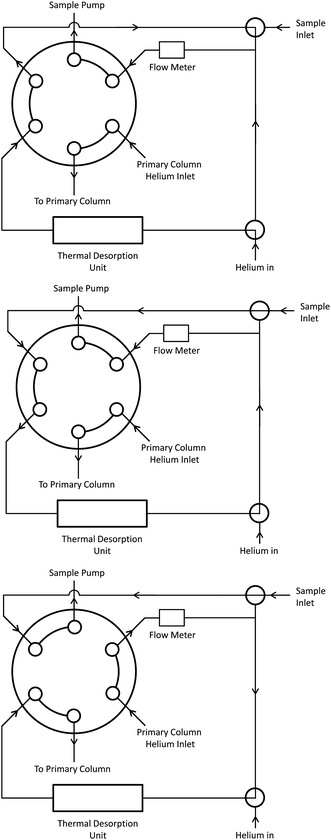 | ||
| Fig. 1 Schematic showing the configuration of the sample inlet 6-port 2-position diaphragm valve and solenoid valves for purging the trap with helium (upper), trapping an air sample (middle) and injecting the collected sample onto the primary column (lower). The diaphragm valve changes position when a sample is injected. | ||
2.2 Thermal desorption trap
A thermal desorption unit has been custom built for this project. The design of the trapping system is shown in Fig. 2. A quartz tube (1 mm i.d., 3 mm o.d) is connected to the sample inlet lines by compression fittings with graphite ferrules. A short section of the tube is filled with approximately 4 mg Carbopack™ B 60–80 mesh adsorbent (Supelco) held in place by quartz wool plugs. A Thermocoax heating element with a built in K-type thermocouple is coiled around the packed section of quartz. The Thermocoax coil is enclosed by a copper sheath which is interfaced to a 30 × 30 mm Peltier element (MCHPE-127-10-08-E, Multicomp) with thermally conductive grease. A layer of conductive grease on the underside of the Peltier forms a thermal link to a fan cooled heat sink. The area around the quartz trap is enclosed by a Teflon frame with a Perspex lid. The overall dimensions of the trap are 60 × 73 × 150 mm (W × H × L). To trap VOCs from air the TD unit is first purged with helium then cooled to a specified temperature using the Peltier element. An air or gas sample is then drawn through the trap by a micro diaphragm pump (NMP 830KNDC, KNF). The sample pump typically draws 50 mL min−1 of air through the trap although this can be varied according to how much adsorbent is packed into the quartz tube. Once a sample has been collected the trap is again purged with helium, then flash heated by the Thermocoax element and the sample flushed onto the primary column. The Thermocoax element can be heat the trap to over 300 °C at up to 40 °C per second. The maximum temperature used in this work is 180 °C. The trap is designed so that the helium gas flow through the trap when a sample is injected/desorbed is opposite to the flow when a sample was collected, as illustrated in Fig. 1.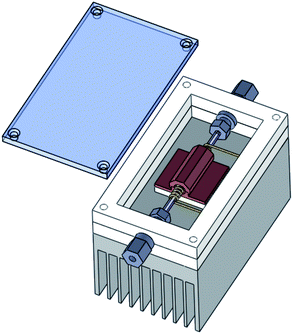 | ||
| Fig. 2 The design of the thermal desorption unit. A thin quartz tube packed with adsorbent is surrounded by a coil of Thermocoax heating wire. The quartz tube is connected to sample lines by compression fittings with graphite ferrules. A copper sheath surrounds both the heater and quartz tube and is separated from the fan cooled heat sink by a Peltier element. The components are enclosed by a Teflon frame with a Perspex lid. | ||
2.3 The modulation valve
A modulator provides the interface between the two columns in a GC×GC system. Its function is to collect eluent from the first column and periodically inject the collected sample onto the second column. The majority of early atmospheric applications of GC×GC used cryogenic modulators which are unsuitable for field measurements and which can suffer from breakthrough of very low boiling compounds. We have used 6-port 2-position micro diaphragm valve (Valco Instruments) in the manner described by Lidster et al.17 as the modulator for this instrument – the approaching being essentially a further adaption of methods first proposed by Seeley et al.18 This method is shown pictorially in Fig. 3. Gas from the primary column passes into one of the valve ports and fills a 250 μL loop (Thames Restek) before reaching a stopper. Every few seconds the valve position is briefly switched and the eluent of the primary column that is in the loop is flushed onto the second column. Since the system is closed there is essentially a 100% transfer of material between first and second dimensions, with the first column operating in a mode where it undergoes many rapid and short stop flow cycles. The narrow bore of the first column and moderate length result in an equilibration time that is longer than the modulation cycle, meaning that at the column head, carrier gas flow is always positive going into the column. The time to complete one cycle is known as the modulation period. The primary column operates at a much higher pressure than the secondary column to ensure that the stoppered loop sample fills between modulations. The modulation valve and the sample inlet valve are housed in an insulated aluminium box and heated by a resistive heating mat.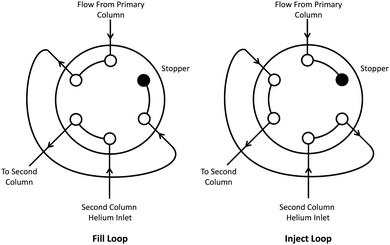 | ||
| Fig. 3 Configuration of the 6-port 2-way valve modulator. The valve is periodically switched to inject the contents of the 250 μL loop onto the second column. The stopper ensures that all of the eluent from the primary column is retained and injected onto the second column. | ||
2.4 Columns and column heating
A unique feature of this system is the absence of a conventional GC oven. Instead, we employ a method whereby the columns are heated indirectly by thermal transfer from copper holders. The column holders are hollow copper cylinders (50 mm long, 40 mm i.d.) which have one end capped by a square copper plate. Each was machined from a single piece of copper. Small holes are drilled at the top and bottom of the cylinders for ingress and egress of the columns which are coiled in a spiral inside. The natural recoil of the capillary columns pushes them outwards and into contact with the cylinder walls and is sufficient to hold them firmly in place. A 40 × 40 mm Peltier element (MCPE1-12707AC-S, Multicomp) separates the square base plate of each column holder from a large fan cooled heat sink. Each surface of the Peltier is covered with thermally conductive grease to maximise heat transfer between the surfaces. Bespoke one metre long Thermocoax heating elements wound around the exterior of the copper tubing are used to heat the columns. As the Thermocoax elements heat the copper, the heat is efficiently transferred to the columns coiled within the cylinders. The temperature of each column holder is measured by a K-type thermocouple fixed to the base plate. The temperature of the columns is not measured directly but is assumed to be equal to the temperature measured on the copper holder, which the columns are in contact with. The Peltier elements are principally used to cool the columns at the end of an experiment, but by reversing their polarity they can also be used to support the Thermocoax heating of the columns. The Peltier elements allow for rapid cooling of the columns at the end of a run as well as permitting the use of sub-ambient column temperatures during at the start of a measurement cycle. Teflon plugs machined to fit the empty space within the cylinders help to minimise internal heat losses. To reduce heat loss to the surroundings the columns are enclosed by a box which is fixed to the top of the heat sink. Fig. 4 shows the design of the column heating system (enclosure not shown).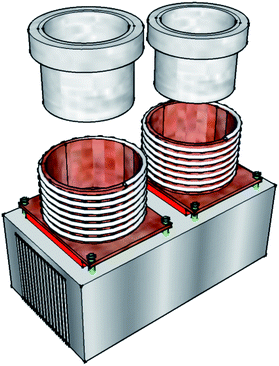 | ||
| Fig. 4 Design of the column heating system. The columns are coiled in a spiral within the copper cylinders. Each copper column holder is separated from the finned heat sink (cooling fans not shown) by a Peltier element and held in place by four PEEK screws. A Thermocoax heating element is coiled around the exterior of each copper cylinder. A Teflon plug fits snugly inside each copper cylinder to minimise internal heat losses. | ||
The primary column holder contains a coil of approximately 18.5 metres of BPX5 column (0.15 mm i.d., 0.25 μm film thickness, SGE) and the second holder contains approximately 6.5 metres of BP20 column (0.25 mm i.d., 0.25 μm film thickness, SGE). When choosing the column combination, consideration was given to the results of Lidster et al.17 The second column is necessarily much shorter than the primary column to ensure that all components elute within one modulation period. The output of the secondary column is fed directly to the detector which is mounted to the box covering the column holders. The columns are accessed from the exterior of the column box by narrow bore Valco bulkhead unions. Details on column flow rates and pressures used are discussed in a later section as part of the optimisation experiments.
2.5 Detector
While the combination of a GC column with a mass spectrometer or FID detector is the most widely laboratory approach to VOC analysis, for simplicity, size, low cost and portability we have used a photo-ionisation detector (Alphasense, PID-AH). This particular commercial detector is not designed as a GC detector, rather it is used widely as an industrial solvent alarm. However by removing its PTFE inlet filter and by directing the column flow onto the PID via the capillary, it performs remarkably well.19 The PID has field operational advantages over the FID in that it does not require supply gases such as hydrogen and is highly sensitive towards biogenic compounds. The ionisation potential of the PID lamp is 10.6 eV which is sufficient to ionise most VOCs with exceptions being low molecular weight saturated VOCs and halogenated compounds. Unsaturated and aromatic VOCs are more susceptible to ionisation and are detected more efficiently. The detector has excellent sensitivity and a broad dynamic range. The unit has a cost of around 250 GBP.2.6 Instrument control
All electronic components and devices within the instrument are controlled by a National Instruments Compact RIO (cRIO) 9022 computer and purpose built software created in LabVIEW. The small footprint and robust build quality of the cRIO are ideal for a portable instrument. Components of the instrument are interfaced with the computer via an NI cRIO 9022 4-slot chassis and four cRIO input/output modules: an NI 9207 analog input module; an NI 9403 32 channel bi-directional digital input output module; an NI 9474 sourcing digital output module and an NI 9219 universal analog input module. Analog input signals are received by the NI 9219 module (thermocouple signals) and the NI 9207 (detector, pressure sensors and flow meter). Each of the Peltier and Thermocoax elements is controlled via a separate digital output from the NI 9403 module. To achieve satisfactory temperature control, power to each of the elements is regulated (by the software) between 0 and 100% by modulating the on-off duty cycle of a 10 kHz signal. For devices which are simply switched on or off like the pressure sensors, flow meter, detector and solenoid valves the NI 9474 module is used with a 12 VDC source. The control software for the instrument is written in LabVIEW. Developed on a host PC, the software is deployed onto the cRIO computer via an Ethernet connection. The host PC displays the user interface which requires the user to specify the experimental procedure and parameters at the start of a run. This includes the temperature program for each column, the volume of sample to trap and the run time. Once deployed onto the cRIO, the program runs autonomously and the user has no further control other than the ability to stop the experiment. Progress and results are displayed continuously on the host PC. Because the software runs on the cRIO, it is not necessary for the host PC to remain connected to the cRIO once the program has been deployed. The program will continue to run if the host PC is disconnected. The cRIO 9022 has a two gigabyte memory and has been programmed to save data automatically at the end of each experiment. Data files are saved in a LabVIEW format which can be easily converted to .txt or .csv data files at a later date. For this work, data files were typically one megabyte for a half hour analysis meaning the cRIO has sufficient capacity for more than a months worth of continuously recorded chromatographic data. The PID output is measured at 100 Hz and data continuously recorded as a one-dimensional array. In order to visualise a two-dimensional plot the one dimensional data is transformed into two dimensional data by stacking 1-D chromatograms from each modulation period side-by-side. The abscissa of the resulting plot represents the first dimension retention and the ordinate second dimension retention. Visualisation of signals is achieved by using a colour gradient for the signal intensity. The LabVIEW user interface displays both 1-D and 2-D plots during an experiment but colour interpolation in LabVIEW is difficult and improved visualisation is possible by importing saved data files into commercial software such as Zoex GC Image (Zoex). Smoothed and interpolated GC×GC plots presented in this paper were created in Zoex GC Image.2.7 Power supplies
The GC×GC system was designed to run primarily from a 12 VDC supply (DNR120 AS12-1, XP Power) with the intention being to create a system that could run from a car battery. This was somewhat tempered by the need for additional power supplies for the cRIO computer (PS-15, 24 VDC, National Instruments) and the Thermocoax elements (QUINT-PS 1AC, 48 VDC, Phoenix Contact). Whilst the Thermocoax elements are highly efficient and draw little current, they did not provide adequate heating at 24 VDC resulting in the need for a 48 VDC supply. It was still possible to run the system from two 12 VDC car batteries by using a 24 VDC to 48 VDC converter. In some cases a voltage regulator has been used to reduce the 12 VDC to the level required for a device, for example the PID requires a 5 VDC supply.3 Results and discussion
Each aspect of the instrument was tested and calibrated before construction of the complete GC×GC instrument. Establishing the optimum settings for the column pressures and the modulation period is a non-trivial task. The primary column pressure must be set considerably higher than the secondary column to ensure that the sample loop (Fig. 3) fills after each modulation. In addition the modulation period is critical because if too much time is spent filling the sample loop, gas flow through the primary column may slow or stop resulting in poor separation in the first dimension. Initial testing and characterisation of the modulator was conducted without the TD unit. Instead gas samples from the headspace of a VOC test mix were introduced to the system using manual loop injections. The optimum modulator settings were determined by an iterative process. The best results were obtained with the primary column pressure set to 60 psi, the secondary column 30 psi and using a modulation period of 5 seconds where the sample loop fills for 4.7 seconds and the contents are flushed onto the second column for 0.3 seconds.Next the performance of the column heating system was assessed. The maximum attainable temperature for each column when full power was applied to the Thermocoax elements supported by the Peltiers acting as heating elements was 165 °C. Higher temperatures may be possible by improving insulation around the column holders, however this temperature was more than adequate for the VOCs of interest here. It was possible to heat the columns at greater than 15 °C min−1 using a combination of Thermocoax and Peltier heating. Above 100 °C the maximum heating rate decreases and above 125 °C was no greater than 8 °C min−1. With the Peltiers in cooling mode it was possible to cool the columns to a starting temperature of 0 °C although obtaining temperatures below 5 °C took too long to be practically useful. The ability to begin the analytical cycle at 5 or 10 °C is we believe of great advantage, since it improves phase ratio refocusing at the column head following thermal desorption, and allows for thinner film stationary phases to be used in turn reducing column maximum temperatures.
The ambient air temperature naturally affects the fan cooling of the heat sink and hence the minimum temperature attainable. Cooling at the end of an experiment is rapid and it is possible to cool the columns from 165 °C to below 40 °C in less than three minutes. This rate is quicker than the most modern commercial fan cooled GCs in our laboratory.
Through an iterative process using manual loop injections it was found that the best chromatographic resolution was obtained with the following column temperatures: primary column initially set to 10 °C then ramped at 10 °C min−1 up to 140 °C; secondary column initially held at 30 °C then ramped at 10 °C min−1 up to 140 °C. Above 125 °C the heating elements cannot ramp the temperatures at 10 °C min−1 and the heating rate slows. The columns are then held at 140 °C until near the end of a run at which point the Peltiers are switched to cooling. The point at which the Peltier cooling begins is determined by the length of the experiment as defined by the operator. Returning the columns to sub-ambient temperatures takes two to three minutes. For efficiency this can be done at the start of the next experiment as a new sample is being collected.
Before coupling the thermal desorption unit with the rest of the instrument its individual performance was examined with a conventional GC×GC-FID system. By applying full power to the TD Peltier it was possible to cool the trap to around −8 °C. This minimum temperature is again affected by fluctuations in the ambient laboratory temperature. Lower temperatures would be possible with a more powerful Peltier at the expense of power efficiency. The minimum temperature that could be consistently achieved was −5 °C and all samples presented in this paper were collected at this temperature. In order to inject the trapped VOCs onto the primary column in a narrow band it is essential that the trap is heated rapidly. The Thermocoax heating element was able to heat the trap from −5 °C to 180 °C in around three seconds. This is greater than the maximum column temperature used (140 °C) because the thermocouple that measures the trap temperature is incorporated within the Thermocoax element, thus measuring the element temperature and not that of the quartz tube which takes longer to heat. The best chromatography was obtained when the trap was held at 180 °C for 45 seconds. A chromatogram recorded with the TD unit combined with a conventional GC×GC-FID is shown in Fig. 5.
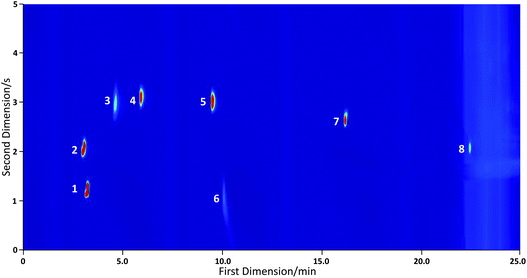 | ||
| Fig. 5 Chromatogram recorded using a VOC standard with the TD unit connected to a conventional GC×GC-FID system. Labelled peaks are identified as follows: (1) acetone; (2) isoprene; (3) propanol; (4) butan-2-one; (5) 3-methyl butan-2-one; (6) 1-butanol; (7) toluene and (8) cyclohexanone. | ||
The conditions listed here represent standard experimental settings and were used in the recording of all data presented in this paper, unless otherwise specified. Following characterisation of the TD unit with a conventional GC it was incorporated with the miniaturised GC×GC system. The complete instrument was tested with a 30 component VOC standard (National Physical Laboratory, NPL) and a seventeen component VOC standard (National Physical Laboratory, NPL). In both standards each component has a concentration of approximately 4 ppbv. Experimental conditions were as described above and in each case 500 mL of the standard was sampled. Two dimensional chromatograms are shown in Fig. 6 for the 30 component NPL standard using helium and hydrogen as the carrier gases and in Fig. 7 for the 17 component NPL standard with helium as the carrier gas.
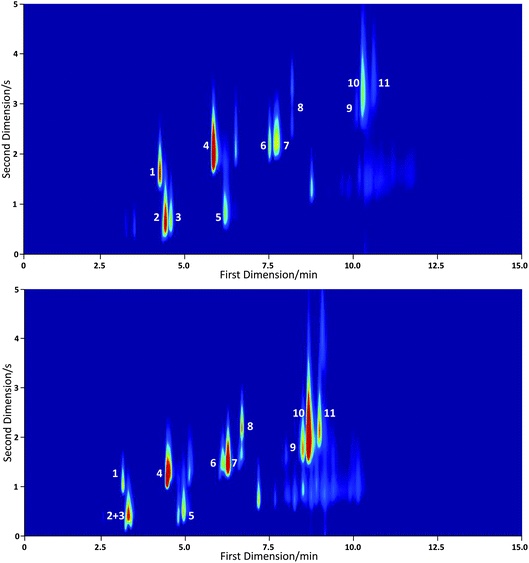 | ||
| Fig. 6 GC×GC-PID chromatograms of a 30 component VOC standard with helium (upper) and hydrogen (lower) carrier gas. Labelled peaks are identified as follows: (1) benzene; (2) heptane; (3) 2,2,4-trimethyl pentane; (4) toluene; (5) octane; (6) ethyl benzene; (7) m/p-xylene; (8) o-xylene; (9) 1,3,5-trimethyl benzene; (10) 1,2,4-trimethyl benzene and (11) 1,2,3-trimethyl benzene. Fewer than 30 species are detected because the PID is not sensitive to the low molecular weight hydrocarbons in the standard. | ||
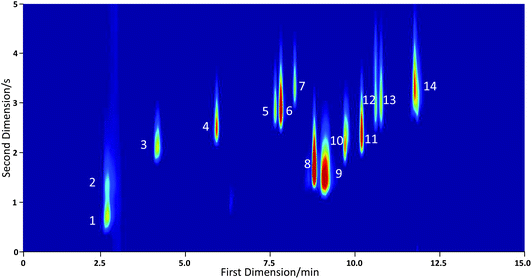 | ||
| Fig. 7 GC×GC-PID chromatogram of a 17 component VOC standard with helium carrier gas. Labelled peaks are identified as follows: (1) isoprene; (2) acetone; (3) benzene; (4) toluene; (5) ethyl benzene; (6) m/p-xylene; (7) o-xylene; (8) α pinene; (9) β pinene and myrcene; (10) Δ3-carene; (11) p-cymene; (12) limonene; (13) 1,8-cineole and (14) camphor. A peak for cis-ocimene could not be conclusively identified. | ||
The instrument was tested in the field during the summer phase of the Clean Air For London (ClearfLo) campaign from 21 July to 23 August 2012. One litre air samples were collected hourly and dried by passing the sample through Nafion tubing sealed in a box filled with molecular sieve prior to the trap. A two dimensional chromatogram for an air sample collected during this work is shown in Fig. 8. The instrument demonstrated excellent sensitivity. The toluene peak detected at approximately 6 minutes in Fig. 8 corresponds to a concentration of 310 pptv.
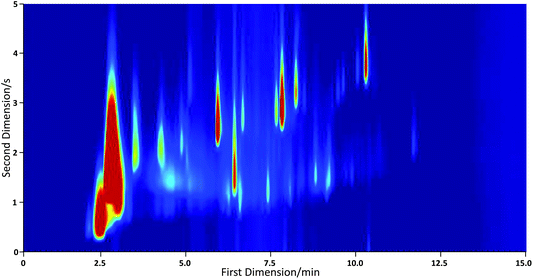 | ||
| Fig. 8 GC×GC-PID chromatogram of a 1 L air sample collected in London on 2 August 2012 at 7 pm. The toluene peak occurring at approximately 6 minutes represents a concentration of 310 pptv. | ||
These chromatograms demonstrate that second dimension separation is successfully achieved with aromatic peaks offset in the second dimension relative to the saturated alkanes. The peaks are narrow in the first dimension indicating good separation on the primary column but are quite broad in the second dimension with long peak tails.
3.1 PID vs. FID tradeoff
The PID used here is very low power and is essentially disposable. In our previous work it has been employed as a standard GC detector for peaks around 10 s FWHM and for this it performed as well as an FID. It is clear however that whilst it is very sensitive and has a fast rise time, the signal returns slowly to the baseline giving an asymmetric peak shape. The peak tailing is more easily observed in the one-dimensional data, prior to construction of the 2-D plot. A short section of one-dimensional data is shown in Fig. 9 alongside data recorded when the instrument was coupled with an FID. Here we have simply added a heated transfer line between the instrument and a FID in an Agilent 7890 GC system. As Fig. 9 demonstrates, peaks that are poorly resolved in the PID data are baseline resolved by the FID for an identical separation. This implies that the second dimension chromatography in our portable device is good and that the issue lies with the detector. When the instrument is used with a commercial FID the resulting 2-D chromatograms have much less tailing; see Fig. 10. The GC×GC-PID chromatograms whilst somewhat compromised from those that might be achieved in a bespoke laboratory set up are nonetheless reasonably resolved and give more than adequate resolution for compound identification.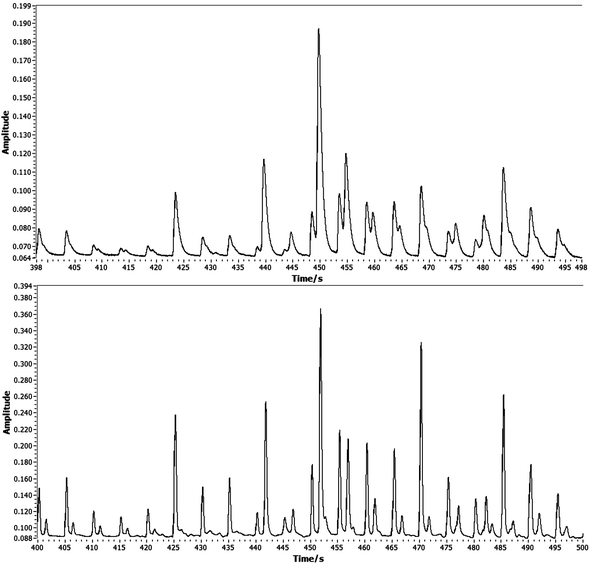 | ||
| Fig. 9 A comparison of 1-D signal data for the PID (upper) and FID (lower) detectors showing the effect of the PID peak tailing on resolution. The modulation period is five seconds. | ||
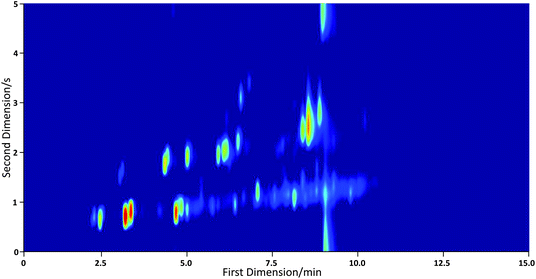 | ||
| Fig. 10 GC×GC-FID chromatogram of a 30 component VOC standard recorded with miniature GC×GC system coupled to an FID in an Agilent 7890 GC system showing a marked reduction in peak tailing in the second dimension. | ||
We have examined the possibility that the peak tailing arises from a dead volume within the PID, since it is not a flow-through device. Compounds eluting from the column may potentially not be rapidly flushed away from the detector because of this dead volume and would continue to be detected giving rise to peak tailing. When a dilution flow (makeup gas) was added to the eluent of the second column to increase the flow through the detector and reduce the residence time of the VOCs, sensitivity was reduced but the peak shapes were unaffected suggesting this is not the cause. Potential causes may be due to electronic damping of the signal or analyte sticking inside the detector, to a degree that even makeup gas does not improve the position. This highlights a key current limitation in the production of high sensitivity field portable devices. GC×GC as a technique creates a very high resolution separation of complex mixtures even in a simplified device such as the one described here. It relies however on a fast responding and simple detector to manifest this capability and at present the options are somewhat limited. There is no doubt that the application of a FID in the field would be possible, using hydrogen as both fuel gas and carrier gas, but it adds to the experimental burden.
3.2 Calibration
As the most abundant biogenic VOC, isoprene is an important target for this instrument.1 A calibration curve was constructed by sampling a series of volumes from 100 to 1500 mL of a 9.68 ppbv isoprene gas standard (CK Gas Products). Peak integration was not performed within the LabVIEW software. Instead, the one-dimensional data was imported to GRAMS/AI (Thermo-Scientific) which has built-in integration functions. Because isoprene is detected over several modulation periods the integration is the sum of the peak areas. That the resulting calibration curve was linear demonstrates the success and consistency of the TD unit. Based on a 500 mL sample we calculate an LOD of 212 pptv and an LOQ of 709 pptv for isoprene from the calibration data. The LOD and LOQ are calculated from the baseline signal plus 3 and 10 times standard deviation of the S/N respectively. These results are promising given that typical concentrations of isoprene in forests/rainforests are between 2 and 10 ppb daytime maximum depending on the local tree species.20Whilst testing the analytical concepts and limitations of compact GC×GC with a PID was the most important aim of this work, we have also attempted to optimise the energy efficiency and potential for portability. This is reflected in the design of the column heating system and the miniaturised TD unit which give a complete analysis cycle of around 34 minutes using standard conditions. This is very similar to normal laboratory equipment. When the instrument is run using mains power the average power consumption is 186 W with a peak load of 315 W. The maximum loading occurs when the TD unit is flash heated and lasts for less than five seconds. We have successfully run experiments where the system is powered using two 12 VDC car batteries. The three switch-mode power supplies (12, 24 and 48 VDC) consume 74 W when idle but are not required when the system is battery powered, which reduces the average power consumption to 112 W. This is vastly superior to conventional GC systems which require up to 2 kW (peak) and exclude the additional power drawn by an add-on TD unit.
4 Conclusions
A miniaturised, comprehensive GC×GC system suitable for the measurement of biogenic VOCs has been constructed and successfully tested. The device uses low cost components and attempts to reduce power and size without sacrificing too great a degree of analytical resolution. A miniaturised thermal desorption unit for the collection of atmospheric samples and a direct column heating system are significant features of the new instrument that have worked well. Commercially available GC columns have been used with heating and cooling by thermal transfer from copper holders. Peltier cooling of the column holders delivers rapid cool down times as well as permitting sub-ambient column temperatures during experiments. The combination of Thermocoax heating elements and Peltier cooling gives an accessible temperature range of 0 °C to 165 °C. The heating system requires much less power than a conventional GC oven and is more rugged, with the fragile columns protected within the copper holders.Two-dimensional chromatograms from the instrument demonstrate effective separation of VOCs in both dimensions when tested with standard gas mixtures. When the separation and TD system is connected to a commercial FID the results show a very good degree of VOC separation of alkanes from aromatics and terpenes. To achieve portability we have tested a low cost PID which has produced reasonable results giving a response that has been enough to achieve resolved GC×GC chromatograms, but with degradation when compared to the FID. Using the completed system with the PID, repeat analyses of gas standards have been reproducible and calibrations linear. Quantitative analysis of an isoprene standard yielded an LOD of 212 pptv. Peak tailing in the second dimension may complicate the quantitative analysis of complex VOC mixtures. We highlight that there remains a substantial role for a simple universal and fast responding GC detector which could be coupled to the compact GC×GC described here, since detection is the limiting factor at present rather than separation capability. The complete system is relatively small and energy efficient when compared to traditional GC systems and can be run from two 12 VDC car batteries. The sensitivity and portability of the unit make it ideal for in situ measurements of biogenic VOCs. The low cost of construction (less than £ 15![[thin space (1/6-em)]](https://www.rsc.org/images/entities/char_2009.gif) 000) presents the possibility of creating a network of fieldwork instruments to provide geospatial information about VOC emissions.
000) presents the possibility of creating a network of fieldwork instruments to provide geospatial information about VOC emissions.
Acknowledgements
This work was funded by the Natural Environment Research Council under grant NE/F015240/1.References
- A. Guenther, C. Hewitt, D. Erickson, R. Fall, C. Geron, T. Graedel, P. Harley, L. Klinger, M. Lerdau and W. McKay, et al. , J. Geophys. Res., 1995, 100, 8873–8892 CrossRef CAS.
- J. Hamilton, A. Lewis, T. Carey, J. Wenger, E. Borrás i Garcia and A. Munoz, Atmos. Chem. Phys., 2009, 9, 3815–3823 CrossRef CAS.
- M. Kulmala, T. Suni, K. Lehtinen, M. Dal Maso, M. Boy, A. Reissell, Ü. Rannik, P. Aalto, P. Keronen and H. Hakola, et al. , Atmos. Chem. Phys., 2003, 3, 6093–6107 Search PubMed.
- J. Peņuelas and J. Llusiā, Trends Plant Sci., 2003, 8, 105–109 CrossRef.
- R. Blake, P. Monks and A. Ellis, Chem. Rev., 2009, 109, 861 CrossRef CAS.
- J. de Gouw and C. Warneke, Mass Spectrom. Rev., 2007, 26, 223–257 CrossRef CAS.
- J. Dallüge, J. Beens and U. Brinkman, J. Chromatogr., A, 2003, 1000, 69–108 CrossRef.
- L. Mondello, P. Tranchida, P. Dugo and G. Dugo, Mass Spectrom. Rev., 2008, 27, 101–124 CrossRef CAS.
- M. Pursch, K. Sun, B. Winniford, H. Cortes, A. Weber, T. McCabe and J. Luong, Anal. Bioanal. Chem., 2002, 373, 356–367 CrossRef CAS.
- S. Terry, J. Jerman and J. Angell, IEEE Trans. Electron Dev., 1979, 26, 1880–1886 CrossRef.
- E. Kolesar Jr and R. Reston, IEEE Trans. Compon., Packag., Manuf. Technol., Part B, 1998, 21, 324–328 CrossRef.
- W. Steinecker, W. Tian, M. Oborny, J. Nichols, M. Agah, J. Potkay, H. Chan, J. Driscoll, R. Sacks and K. Wise, et al. , Lab Chip, 2005, 5, 1123–1131 RSC.
- C. Harris, Anal. Chem., 2002, 74, 585–589 Search PubMed.
- E. Ehrmann, H. Dharmasena, K. Carney and E. Overton, J. Chromatogr. Sci., 1996, 34, 533–539 CAS.
- J. Dallüge, R. Vreuls, D. van Iperen, M. van Rijn and U. Brinkman, J. Sep. Sci., 2002, 25, 608–614 CrossRef.
- A. Wang, H. Tolley and M. Lee, J. Chromatogr., A, 2012 Search PubMed.
- R. Lidster, J. Hamilton and A. Lewis, J. Sep. Sci., 2011, 34, 812–821 CrossRef CAS.
- J. Seeley, F. Kramp and C. Hicks, Anal. Chem., 2000, 72, 4346–4352 CrossRef CAS.
- A. Lewis, J. Hamilton, C. Rhodes, J. Halliday, K. Bartle, P. Homewood, R. Grenfell, B. Goody, A. Harling and P. Brewer, et al. , J. Chromatogr., A, 2010, 1217, 768–774 CrossRef CAS.
- C. Hewitt, A. MacKenzie, P. Di Carlo, C. Di Marco, J. Dorsey, M. Evans, D. Fowler, M. Gallagher, J. Hopkins and C. Jones, et al. , Proc. Natl. Acad. Sci. U. S. A., 2009, 106, 18447–18451 CrossRef CAS.
| This journal is © The Royal Society of Chemistry 2013 |
