 Open Access Article
A handheld magnetic sensing platform for antigen and nucleic acid detection†
Alex
Pai
a,
Aroutin
Khachaturian
a,
Stephen
Chapman
a,
Alexander
Hu
a,
Hua
Wang
ab and
Ali
Hajimiri
*a
aDepartment of Electrical Engineering, California Institute of Technology, Pasadena, California 91125, USA. E-mail: hajimiri@caltech.edu
bDepartment of Electrical and Computer Engineering, Georgia Institute of Technology, Atlanta, Georgia 30332, USA
First published on 10th December 2013
Abstract
The core requirements for point-of-care (POC) diagnostics necessitate low-cost, portability, easily integrated sample preparation, and quick measurement time. Frequency-shift based magnetic sensing is a measurement technique utilizing a complementary metal-oxide-semiconductor (CMOS) integrated-circuit (IC) chip for magnetic label detection. The sensing scheme leverages the low-cost manufacturing of IC chips while demonstrating the potential for multiplexing capabilities. In this article, we present modifications to this scheme for POC viability. We introduce a handheld reusable reader and a disposable open-well cartridge for the detection of nucleic acids and antigens. The diagnostic system utilizes a novel “magnetic freezing” technique to reduce measurement time, obviates baseline measurement before or during biological assay, and reduces sensor noise. We utilize these enhancements for the room temperature, amplification-free detection of a 31 base-pair DNA oligomer and the interferon-γ (IFN-γ) protein. We have demonstrated reliable measurements down to 100 pM for the DNA assay and 1 pM for the protein.
Introduction
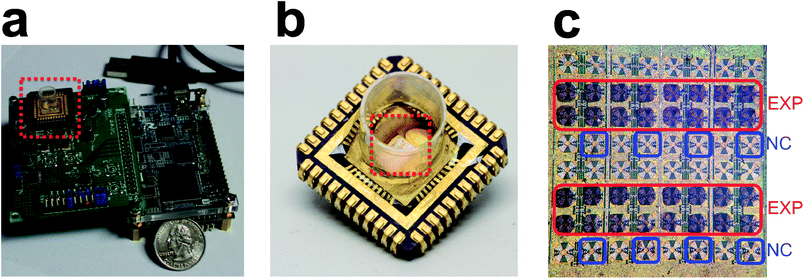
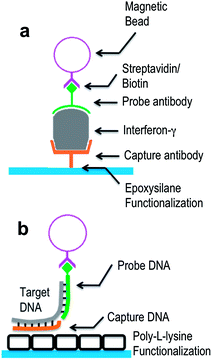
Point-of-care (POC) diagnostics represents a growing segment of the healthcare industry.1 Although many types of sensors have been proposed with high sensitivities, few have demonstrated the key features that will allow a device to achieve widespread use: low-cost, multiplexing, portability, easily integrated sample preparation, and quick measurement time.2,3 In this paper, we present a complete handheld diagnostic device (Fig. 1a) with two fully implemented assays for proteins and nucleic acids (Fig 2a and b). It is based on the novel “magnetic freezing” scheme that removes the need for baseline measurements, allows for multiple sensor measurements, and eliminates the long warm-up and calibration phases. To the best of our knowledge, magnetic freezing is a new technique and previously unpublished. We have devised a disposable, low-cost single chamber cartridge-based approach, which simplifies the sample handling significantly (Fig. 1b). We have developed all the necessary surface chemistry to functionalize the surface of a standard CMOS chip, further reducing the cost and complexity of this handheld diagnostic device. We also eliminate expensive and bulky infrastructure that limits other sensing technologies such as microfluidic pumps and optical elements.A crucial component of any POC diagnostic is the biosensor used to detect biologically relevant targets. Many biosensors have been proposed utilizing optical (e.g., ref. 4–6), electrochemical (e.g., ref. 7–14), mechanical (e.g., ref. 15), or magnetic (e.g., ref. 16–21) sensing modalities. Magnetic based platforms enjoy higher sensitivity and virtually non-existent background due to the absence of strong magnetic properties in most biological samples. The same magnetic labels can also serve as a means of magnetic manipulation during sample preparation (e.g., separation, purification, lysing, etc.) in an integrated system.9,17,22–24
One promising class of magnetic sensors are complementary metal-oxide-semiconductor (CMOS) frequency-shift based magnetic resonant sensors.18,25,26 They rely on detecting the shift in the natural frequency of a free-running oscillator based on an electromagnetic resonator in the presence of an external magnetic material. The resonator is often implemented on a silicon chip using an inductor, L, and a capacitor, C, forming an LC resonator. When a magnetic bead is in the vicinity of the inductor, it increases its inductance, which in turn lowers the resonance frequency. This leads to a small, yet discernible drop in the oscillation frequency that is registered by electronically counting the number of cycles over one or multiple time intervals. The frequency shift can be correlated with the number of beads near the resonator. A single-chip array of frequency shift sensors was designed using integrated circuits (IC) in a CMOS process and previously reported.18 A novel noise reduction technique, correlated double counting,25 was used to further enhance the chip's sensitivity. This CMOS chip was used to implement the handheld diagnostic reported here. The CMOS implementation is central to a low-cost, low-power implementation of this handheld diagnostic system due to its highly favorable cost structure in large volumes. The sensor has the benefits of low power, low cost, and high scalability.
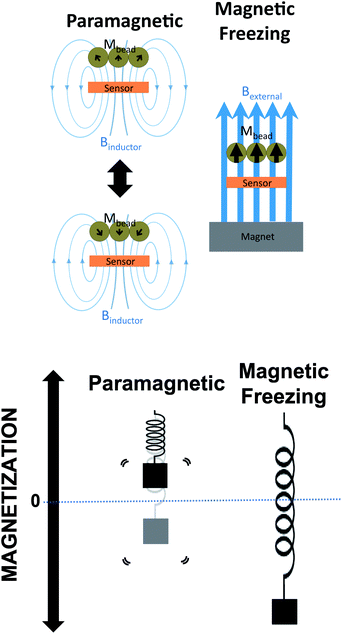
Although the frequency-shift biosensor of Wang et al.18 was proposed for potential biological applications, several important challenges had to be overcome before its widespread deployment. It was found that to achieve high accuracy measurements, each sensor oscillator had to be allowed to run (warm up) for long periods of time up to 30 min. Furthermore, to reduce the detection noise, the beads need to be rapidly removed from the sensor surface to obtain a baseline right after the sample read. This rapid removal was necessary to perform the two measurements within a time interval shorter than the drift time constants of the sensor oscillator. In a realistic biological experiment, the experimental interval is much longer than the drift time constant due to washing, target binding, and bead binding. Additionally, replicate measurements on multiple sensors would not allow for any warm-up time. To overcome these obstacles, we have developed a new technique called magnetic freezing. By saturating the magnetization of the magnetic beads with a small permanent magnet, the effect of beads on the sensor is neutralized. This obviates the need for a baseline measurement before the experimental assay thereby reducing the frequency drift and improving the sensor signal-to-noise ratio. Additionally, all the measurements can be performed after the biological assay.
Another hurdle for widespread adoption is the physical size and cost of the biosensor measurement equipment. In this design, we have integrated the entire functionality of the sensor onto a reader printed circuit board (PCB) that in tandem with a processing unit board constitute the entirety of the reusable unit that connects to USB (Fig. 1a). We have also designed a disposable open-well cartridge that combines all sensor sites (48 active and 16 reference) in a single reaction well (Fig. 1b and c). The single well allows for easy sample and reagent loading without the need for microfluidic pumps or structures. This design offers the option to perform the biological assay separately on a single or multiple disposable cartridges and to plug them (batch processing) into a socket on the reader PCB at the conclusion of the biological assay. In high volume manufacturing, the platform will cost between $10-20, and the cartridges will cost less than $1.
In order to demonstrate the viability of the sensor for biologically relevant assays, we have developed and demonstrated two representative practical assays for detecting protein and nucleic acid targets. We performed these two exemplary assays using our CMOS magnetic handheld diagnostic reader to detect an interferon-γ protein (relevant for tuberculosis diagnostics) and a 31 bp DNA oligomer. This is the first demonstration of complete nucleic acid or protein assays using a CMOS frequency-shift magnetic diagnostic sensor to the best of our knowledge. All assays were completed at room temperature without any need for amplification. We demonstrated detectable concentrations of DNA between 100 pM and 10 nM and protein between 1 and 30 pM in our first demonstration. Our developed assay incorporates surface chemistry compatible with not only our frequency-shift biosensor, but also with any standard CMOS IC chip.
Experimental methods
Handheld portable diagnostic device
Our handheld diagnostic device consists of two major components: a small, disposable cartridge (Fig. 1b) and a reader (Fig. 1a). The disposable cartridge consists of a sensor chip mounted on a chip carrier and protected with polypropylene housing. The reader consists of a commercial field-programmable gate array development board (terasIC, Dover, Delaware) with a custom-designed PCB. The sensing scheme caters to a very simple and small form factor. Data processing consists of a frequency divider (÷22) and a digital counter. Four supply biases are used to bias/power the chip. A crystal oscillator serves as a frequency reference as well as a clock. The sensing parameters are relayed to on-chip shift registers. The device is connected to a computer through a single USB cable, which also provides power to the unit. The core power consumption of the sensor is 80 mW. The entire biological assay is performed in the well of the cartridge. At the end of the assay, the cartridge is plugged into the reader for data acquisition.Open well cartridge formation
The core of our user-friendly interface allows for the sample and reagents to be loaded into a single open reaction well. We have previously demonstrated a microfluidic platform for DNA binding.18 However, the requirement for external pneumatic pressure control is restrictive to a POC solution. Therefore, a well-based design was incorporated to allow the DNA assay to be conducted by simply filling and emptying the cartridge. Filling the cartridge consisted of pipetting solution into the cartridge. The foundation of our cartridge is a chip carrier that can be plugged into a socket on our reader. The IC biosensor chip is attached to the surface of the cartridge using a conductive silver epoxy (MG Chemicals, Burlington, Ontario, Canada). Next, our chip surface is functionalized for capture probe attachment. The capture probe and negative control (NC) are printed onto each of our sensor surfaces using a contact pin based printer (Fig. 1c). After printing, the IC chip is electrically connected to the chip carrier by wire bonding from electronic pads to the chip carrier leads. To provide structural support and waterproofing for the wire bonds, a two-part epoxy is applied to the wire bonds. The surface is heated to 80 °C for 10 min before epoxy application to remove adsorbed water and ensure a good seal.27 Finally, the polypropylene housing is epoxied to the chip carrier to form an open well. After fabrication, the cartridge is stored at 4 °C until performing the assay.Sensor surface functionalization
A key component for constructing the cartridge is the functionalization of the IC chip's silicon nitride surface. In IC chips, the non-reactive silicon nitride surface serves as a passivation layer to insulate the chip electrically and prevent against corrosion. However, its non-reactivity presents a challenge when attempting to functionalize the surface. In order to attach molecules to this inactive surface, a 2 μm layer of glass was deposited to the surface using a plasma-enhanced chemical vapor deposition (CVD) method. The deposition also reduces surface roughness. Our surface functionalization allows capture DNA strands or antibodies to bind to the surface of the chip.Different functionalizations were used to prepare the silicon chip for either capture DNA strand or capture antibody attachment. Several attachment chemistries for antibody and nucleic acid attachment are commonly used for microarray applications including hydroxyl, poly-L-lysine (PLL), amine, aldehyde, and epoxy coatings. The protocol was modified from existing microarray protocols.28–34 For DNA attachment, a PLL surface is used to allow for the electrostatic adsorption of DNA. Of these coatings, we found that the amine coating of the PLL surface has the highest binding density, sensitivity, and uniformity. To deposit the PLL layer, first, the chip was plasma etched for 1 min to increase the reactivity of deposited glass to increase the PLL density. Next, the chip was incubated for 30 min in a PLL solution consisting of 37.5 mL nanopure water, 10.1 mL filtered 1× PBS, and 8.8 mL PLL from Sigma-Aldrich (St. Louis, MO). The functionalized chip is then stored in a desiccator and allowed to stand for 2 weeks to cure the PLL, thus increasing the hydrophobicity.
For antibody attachment, an epoxy surface was prepared to allow for covalent attachment to the capture antibody. Previous literature suggests that an epoxy functionalization yielded a higher binding density than an amine, aldehyde, or PLL.35 The chip was immersed for 10 min in 3 M H2SO4 followed by 10 min in 3 M HCl. Then it was immediately rinsed with water and dried with compressed nitrogen gas.32 The chip was immersed in 2% (3-glycidyloxypropyl) trimethoxysilane (Sigma Aldrich) in 95% ethanol for 15 min. Then it was rinsed with ethanol to remove unbound epoxide groups. The chip was then dried under nitrogen and baked at 110 °C for 15 min for covalent attachment of silane groups to the glass substrate.4
Probe printing
After creating a chemically active surface on our IC chip, we need to print experiment-specific attachment probes onto our sensor surface. For the DNA sandwich assay, synthetic oligomer probe strands (IDT, Skokie, IL) were used for attachment to the PLL surface. The probes were printed onto the chip surface using a SpotBot 2 contact pin based microarray printer (Arrayit, Sunnyvale, CA). The print solution was composed of 10 μL of 2× microspotting solution (Arrayit, Sunnyvale, CA) with 10 μL of 50 μM probe DNA. The chip was then allowed to dry overnight in a desiccator. Next, the chip was baked at 80 °C for 80 min to further dry the chip and enhance DNA binding. Following printing and drying, the chip was placed in a container with BlockIt Plus microarray blocking buffer (Arrayit, Sunnyvale, CA) and placed on an orbital shaker for 1 h at 100 rpm. Finally, the chip was lightly rinsed for 30 s in nanopure water and spun dry.For the immunoassay, antibodies were printed using a SpotBot 2 microarray printer at room temperature. The humidity level was maintained between 50 and 55%. Print solution was prepared by mixing 10 μL stock solution of antibodies with 10 μL of protein printing buffer (Arrayit, Sunnyvale, CA). Protein solution buildup in the pin reduced the uniformity of the printed spots on the sensors. Thus, the pin was routinely cleaned prior to printing by sonication in 50 mM KOH from 10 min to 1 h.36After printing every 10 spots, the pin was sonicated for 10 min in distilled H2O, Arrayit light pin cleaning protocol.37 After printing antibodies on the sensors, the chip was left in the desiccator to dry overnight.
DNA hybridization sandwich assay
After probe printing, the chip can be stored until a sample is ready to be tested. To test the viability of the instrument for the quantification of unique DNA targets, we employed a sandwich assay consisting of a capture (5′-TTT TTC TGG TTG GGT TGA TTG GAT TTA GCT TGG C-3′) strand, a target (5′-ATC CAA TCA ACC CAA CAA TAT TGA TAA GGA T-3′) strand, and a biotinylated probe strand (5′-Biotin-ATC CTT ATC AAT ATT-3′) for indirectly labeled detection. A non-complementary NC capture strand (5′-ATG CGA AAC GAT CCT CAT CCT GTC TCT TGA-3′) is also printed to test cross-binding.The hybridization assay took place within the open well. Emptying the well consisted of gently inverting the well. Buffers used in the assay were a hybridization buffer (1× PBS, 1 mg mL−1 BSA, 5 nM EDTA, 0.1% Tween-20, 0.1 mg mL−1 salmon sperm DNA), stringent wash buffer 1 (Arrayit, Sunnyvale, CA), stringent wash buffer 2 (Arrayit, Sunnyvale, CA), and a bead preparation buffer (5 mM Tris–HCl pH 7.5, 0.5 mM EDTA, 1 M NaCl). First, the dry well was washed 3 times with hybridization buffer. Next, a hybridization solution containing varying concentrations of target DNA and 1 μM biotin labeled probe DNA was prepared. A total of 200 μL of hybridization solution was added to the well and allowed to incubate at room temperature for 30 min. During hybridization, a solution of streptavidin-conjugated 1 μm diameter super-paramagnetic beads was prepared. 10 μL of 10 mg mL−1 Dynabeads MyOne Streptavidin C1 (Invitrogen, Carlsbad, CA) was washed and resuspended 3 times in 100 μL of bead preparation buffer as per the manufacturer's protocol.38 After DNA incubation, the well was rinsed twice each in DNA stringent wash buffer 1 and 2 (Arrayit, Sunnyvale, CA) for 2.5 min at a time. The well was then rinsed 3 times in bead preparation buffer. The bead solution was added and allowed to bind for 20 min. Finally, the well was washed another 3 times with bead preparation buffer, then 3 times with nanopure water and emptied.
Immunoassay
IFN-γ and granulocyte-macrophage colony-stimulating factor (GM-CSF) ELISA MAX Standard kits were obtained from Biolegend (San Diego, CA). IFN-γ capture antibodies were used for the primary assay. GM-CSF capture antibodies were used as negative control. Assay diluent (1% BSA in PBS) was prepared prior to use. Lyophilized IFN-γ protein was reconstituted in assay diluent and stored in a −80 °C freezer in polypropylene vials. The chip was removed from the desiccator and blocked for 1 h in 500 μL of BlockIt Plus solution (Arrayit, Sunnyvale, CA) in an orbital shaker at 125 rpm. Afterwards, the chip was rinsed 5 times with 400 μL of wash buffer (0.05% Tween-20 in PBS) to remove the blocking solution. The IFN-γ stock solution was thawed and diluted to the target concentration. A total of 100 μL of protein solution was added to the well and incubated for 2 h at room temperature with shaking at 125 rpm. The well was rinsed 5 times with 400 μL of wash buffer to remove unbound proteins. IFN-γ detection antibody (200× dilution of stock solution in assay diluent) was added to the well and incubated for 1 h at room temperature with shaking at 125 rpm. Unbound detection antibodies were washed 5 times with 400 μL of wash buffer. A total of 5 μL of 1 μm diameter Dynabeads MyOne Streptavidin C1 coated magnetic beads was washed 3 times with PBS to remove preservatives from the bead solution.38 The beads were then resuspended in 100 μL of PBS. Afterwards, the bead solution was added to the well and was incubated for 20 min with no agitation. After incubation, 5 μL of 25% glutaraldehyde solution (Sigma-Aldrich, St. Louis, MO) was added to the well for fixation.39 After a 10 min incubation, the well was rinsed 5 times with wash buffer. Finally, the well was rinsed 5 times with water to prevent crystallization of remaining salt solution on the chip. The chips were left to dry for measurement.Measurement and processing
Following the hybridization assay, the chip can be measured while immersed in solution or dry. If allowed to dry, the chip could be measured months after the hybridization assay with less than 1% change in measurements. The reader is connected to an external laptop and a graphical user interface is initiated. Measurement consists of two cycles of measurements. The time to obtain a single measurement is 100 ms for a combined reference and sensor measurement. During a cycle, each sensor is measured for 5 s for a total of 50 measurements per sensor. All measurements had a standard deviation of less than 20 Hz. 1–48 sensor sites can be measured within up to 4 min. One cycle of measurements establishes the baseline frequency in the presence of a small rare-earth magnet. Next, the magnet is removed from the PCB. During the next cycle of measurements, the endpoint frequency measurement is obtained.The difference between the baseline measurement and the endpoint measurement is used to infer the number of beads over the sensor. More bead binding implies a higher concentration of target analyte.
Data processing
The simple processing scheme obviates the need for high computational power or filtering schemes. A simple arithmetic division is the heart of the signal processing. The presence of magnetic beads leads to a shift in the resonant frequency. The resonant frequency is determined directly from the number of periods over the measurement time. Optimal counting intervals have been previously explored.25Magnetic freezing
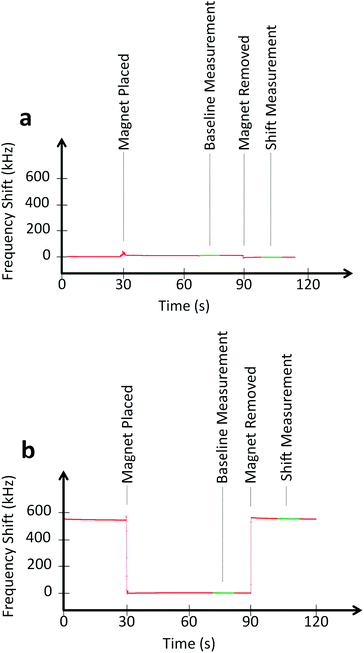
Magnetic freezing is a novel technique that adds functionality and improves the performance of frequency-shift based magnetic biosensors. We previously demonstrated the large linear dynamic range of the sensor to magnetic beads as well as single bead sensitivity.18 Techniques such as incorporating a reference sensor and a correlated double counting scheme reduced a very large fraction of frequency drift. Traditionally, a frequency-shift oscillator based magnetic biosensor without magnetic freezing requires approximately 30 min of warm up time for the oscillator to become stable. Moreover, frequency drift in oscillators compounds this problem by increasing the noise of the sensor. In the previous detection scheme, the sensitivity of the biosensor was determined by the immediate presence or absence of magnetic beads over the sensor. This would obviate long-term frequency drift by obtaining frequency shift measurements immediately after the baseline measurement. However, this is not compatible with a typical biological assay. In a biological assay, the baseline measurement would need to be acquired before the entire assay, with the final measurement needs to be performed at the conclusion of the assay. This would allow significant oscillator drift to accumulate, thus significantly decreasing the sensitivity. In addition to the requirement that the biosensor would need to stay on during the entire assay, the system would be incapable of conducting measurements over multiple sensors because only one sensor could be maintained active during the assay.Magnetic freezing solves all these issues (elimination of warm up, removal of active requirement of the system during assay, elimination of baseline measurement before assay, inability to obtain measurements from multiple sensors) by requiring only one set of measurements at the conclusion of the assay. This is accomplished by first measuring the sensor at the end of the assay using the previously described frequency shift technique, as seen in Fig. 3. In an unfrozen state, the beads are able to “track” the magnetization induced by the inductor. Next, an external magnet is used to saturate the magnetization of the bead. This “holds” the magnetization to a point of saturation. The magnetic field of the inductor cannot modulate the magnetization vector of the beads due to the magnetic saturation of the beads. Thus, the beads have no significant effect on the inductance. A small (9.5 mm × 9.5 mm × 9.5 mm) neodymium magnet with a surface field of 0.5 T is used to saturate magnetization. By having magnetization saturated, the magnetic domains inside the bead are not allowed to “track” the 1 GHz oscillation frequency of the inductor. This prevents the beads from increasing inductance and lowering the resonant frequency of the electrical oscillator.
Results and discussion
Magnetic freezing
To examine the effect of magnetic freezing, an experiment was conducted by randomly distributing between 1 and 250 beads of 4.5 μm diameter (for ease of counting) over the sensor surface. An external magnet was attached and removed from underneath the sensor. For demonstration of the magnetic freezing effect, a sensor is measured continuously for 120 s. At t = 30 s, the small magnet is placed underneath the sensor and PCB (Fig. 4). The shift in frequency is immediate, limited only by how quickly one can place the magnet. The baseline measurement is performed by calculating the mode of frequency shift over a few seconds. The noise before the shift is calculated by computing the standard deviation of the data. After removing the magnet at t = 60 s, the mode and standard deviation are again calculated over a period of a few seconds. This experiment was repeated for all 48 sensors and the results are shown in Fig. 5. An average frequency shift of 12.8 kHz per bead was measured. A shift was detected for a quantity of beads between 1 and 250. The limit of detection can be seen to be a single bead. The sensor did not show any signs of saturation. Experimental data and electromagnetic simulation revealed that the sensor could have beads stacked up to 40 μm above the sensor surface before saturating (Fig. S1†). For biological studies, paramagnetic beads of 1 μm diameter were used for the protein and nucleic acid assays. The quantification of these beads is shown in Fig 6.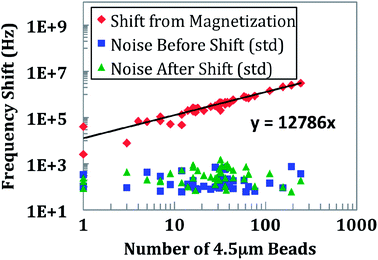 | ||
| Fig. 5 Magnetic freezing quantification of 4.5 μm beads. The average frequency shift for each 4.5 μm bead is 12.8 kHz. The coefficient of determination, R2, was greater than 0.99. | ||
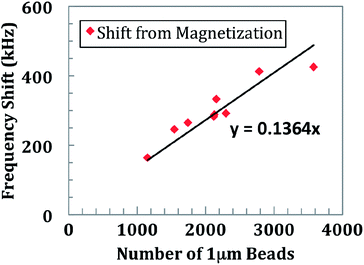 | ||
| Fig. 6 Magnetic freezing quantification of 1 μm beads. These beads were used in the DNA assay and immunoassay. The average frequency shift for each 1 μm bead is 136 Hz. | ||
DNA sandwich assay
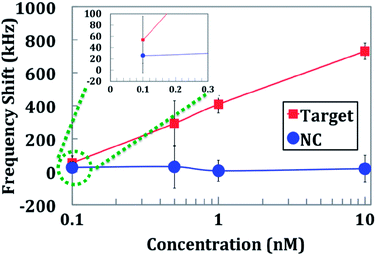
An important trend in biotechnology is the emergence of nucleic acid testing (NAT).40 Areas with the printed capture strand would result in beads binding to the sensor surface, as seen in Fig. 1c. Reference sensors and sensors printed with the NC capture strand would exhibit some fluctuations in frequency shift measurements due to variations in background bead binding to the chip. However, the NC sensors did not appear to have a different level of binding from the background binding level, indicating little or no cross-binding of the sandwich assay.Quantifiable target DNA concentrations could be detected over two orders of magnitude (Fig. 6 and S2a†). The limit of detection of the sensor was 100 pM, where the frequency shift was more than two times the background level. The sensor reached a saturation level at 10 nM. Although this sensitivity is less than those obtained by using traditional amplification-based technologies, this device did not depend on the stringent heating/cooling cycles of amplification technologies. This allows for a simpler, more reliable detection system.
Immunoassay detection of tuberculosis biomarker IFN-γ
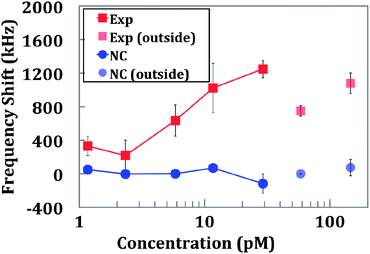
Although NAT testing has demonstrated significant progress in diagnostics, a more diverse variety of biomarkers can be detected with traditional immunoassay. To test the biological impact of the sensor, the TB biomarker IFN-γ was detected as well as its cross-binding with a GM-CSF capture antibody. Compared with the DNA assay, the immunoassay had a higher level of background binding and variability. The results of the immunoassay are shown in Fig. 8 and S2b.† The minimum detectable concentration of protein was 1 pM. The sensor saturated at approximately 30 pM. Two additional concentrations were measured outside of the quantifiable range of the ELISA kit: 60 pM and 150 pM. It is important to note that even though a single antigen was detected using a standard sandwich ELISA kit, the IC surface chemistry and detection system are compatible with any other sandwich immunoassays.Cartridge-to-cartridge variability
A reliable diagnostic should yield the same measurements for the same target concentration. Various sources of variability affect overall cartridge variability: electronic chip-to-chip variability, capture strand/antibody print alignment, and biological assay variability. All three of these variability sources contributed to the overall DNA assay and immunoassay quantification variability. Due to the nature of contact printing, variations in spot printing could be misaligned by as much as ∼50 μm. This misaligns capture molecules over the sensor and thus reduces the number of magnetic beads detected. This leads to an underestimation of target molecules.In order to quantify chip-to-chip variability, the same number of beads must be measured across multiple cartridges. A total of eight separate cartridges were measured. First, cartridges were measured with no beads present. This leads to a standard deviation of less than 4 kHz, or the equivalent of less than 30 beads.
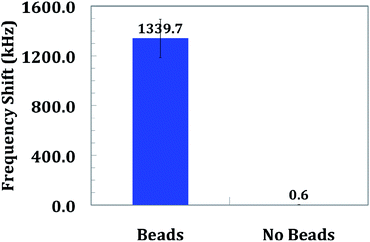
Next, we attempt to place a constant number of beads on the same sensor of the eight cartridges. The tip of a wooden probe is coated with a solution of 1 μm magnetic beads, and subsequently, a thin layer of synthetic polymer (Sally Hansen, New York, NY) to permanently attach the beads. Both the wooden probe and nail polish have a negligible effect on the sensor because they are nonconductive and nonmagnetic. The probe is visually aligned to the surface of the sensor for each cartridge and measured (Fig. S3†). The results of the cartridge-to-cartridge variability are shown in Fig. 9. The standard deviation of the probe measurements is significantly higher than those of blank cartridge measurements. However, the standard deviation of the probe measurements is approximately 10% of the overall signal. This corresponds to approximately 10 μm of probe misalignment for our 120 μm diameter sensor. Thus, the variation is likely due to probe misalignment.
Conclusions
In this paper we have presented a low-cost, low-power, amplification-free, handheld diagnostic platform for point-of-care diagnostics. The platform consists of a disposable cartridge containing 48 sensor sites in an area of 3 mm2. The cartridge can be easily and cost effectively scaled for more sensor sites without increasing the size or cost of the platform. The platform requires no bulky or expensive infrastructure such as microfluidic pumps or optical elements. Scanning time consists of 10 s per sensor site at the conclusion of the biological assay and requires no calibration or warm-up. All sites are contained in a single reaction well for ease of use and we have demonstrated the specificity of capture oligomers and antibodies for a target DNA sequence and IFN-γ. We have demonstrated simultaneous measurement of multiple sensing sites and believe this could be extended to enable spatial multiplexing of multiple targets. Commercial products exist41 for magnetic bead extraction of genomic DNA from whole blood at concentrations greater than 1 nM. Additionally, our technology could be coupled with various isothermal DNA amplification techniques for applications that require increased sensitivity.40 Both DNA and antigen targets are compatible with the detection system. To use the sensing platform, a user plugs in the prefabricated cartridge specific to the cartridge reader. The platform has been demonstrated to be capable of indirectly labeled detection of DNA to 100 pM and IFN-γ antigen to 1 pM. The sensor sites can be used to detect multiple unique targets or replicate targets for higher fidelity. This platform leverages the research and development in magnetic bead manipulation, thus allowing the technology to be compatible with magnetic bead based sample preparation. We have also developed a reliable protocol to functionalize DNA oligomers and antibodies to CMOS based sensors. The same protocols can theoretically be applied to many different DNA sequences or one of hundreds of commercially available sandwich immunoassay kits. We have introduced a measurement technique called magnetic freezing to improve noise performance, eliminate the need for a baseline measurement, and decouple the biological assay from scanning. Because our reader was constructed with standard electronics that can be integrated onto IC chips, the entire measurement system could consist of just the disposable cartridge with a small battery. These milestones enhance the POC viability of the magnetic frequency shift biosensor and future silicon IC biosensors.Acknowledgements
This research was supported by the Caltech CI2 and City of Hope grants. The authors would like to acknowledge Stephanie Johnson and Rob Phillips for their help in aiding DNA attachment chemistry; Habib Ahmad, Alex Sutherland and James Heath for guidance and tools in developing surface chemistry; and Derek Rinderknecht and Morteza Gharib for providing high power microscopes.References and notes
- A. J. Tudos, G. A. J. Besselink and R. B. M. Schasfoort, Lab Chip, 2001, 1, 83–95 RSC.
- C. A. Holland and F. L. Kiechle, Curr. Opin. Microbiol., 2005, 8, 504–509 CrossRef PubMed.
- F. L. Kiechle and C. A. Holland, Clin. Lab. Med., 2009, 29, 555–560 CrossRef PubMed.
- A. Schweinsberg, S. Hocdé, N. N. Lepeshkin, R. W. Boyd, C. Chase and J. E. Fajardo, Sens. Actuators, B, 2007, 123, 727–732 CrossRef CAS PubMed.
- R. J. Laffin, D. W. Chan, M. J. Tanasijevic, G. A. Fischer, W. Markus, J. Miller, P. Matarrese, L. J. Sokoll, D. J. Bruzek, J. Eneman, J. Nelson, K. R. Bray, J. Huang and K. G. Loveland, Clin. Chem., 2001, 47, 129–132 CAS.
- J. M. Ruano-Lopez, M. Agirregabiria, G. Olabarria, D. Verdoy, D. D. Bang, M. Bu, A. Wolff, A. Voigt, J. A. Dziuban and R. Walczak, Lab Chip, 2009, 9, 1495–1499 RSC.
- T. G. Drummond, M. G. Hill and J. K. Barton, Nat. Biotechnol., 2003, 21, 1192–1199 CrossRef CAS PubMed.
- J. Wang, Electroanalysis, 2005, 17, 7–14 CrossRef CAS.
- X. Luo, A. Morrin, A. J. Killard and M. R. Smyth, Electroanalysis, 2006, 18, 319–326 CrossRef CAS.
- L. Y. Zhou, X. Y. Zhang, G. L. Wang, X. X. Jiao, H. Q. Luo and N. Li, Analyst, 2012, 21, 5071–5075 RSC.
- D. Zhang, Y. Peng, H. Qi, Q. Gao and C. Zhang, Biosens. Bioelectron., 2010, 25, 1088–1094 CrossRef CAS PubMed.
- X. Yu, B. Munge, V. Patel, G. Jensen, A. Bhirde, J. D. Gong, S. N. Kim, J. Gillespie, J. S. Gutkind and F. Papadimitrakopoulos, J. Am. Chem. Soc., 2006, 128, 11199–11205 CrossRef CAS PubMed.
- D. Hoegger, P. Morier, C. Vollet, D. Heini, F. Reymond and J. S. Rossier, Anal. Bioanal. Chem., 2007, 387, 267–275 CrossRef CAS PubMed.
- P. Kassanos, R. K. Iles, R. H. Bayford and A. Demosthenous, Physiol. Meas., 2008, 29, S241 CrossRef PubMed.
- J. L. Arlett, E. B. Myers and M. L. Roukes, Nat. Nanotechnol., 2011, 6, 203–215 CrossRef CAS PubMed.
- X. Liang, Y. Heng, H. Shu-Jen, S. Osterfeld, R. L. White, N. Pourmand and S. X. Wang, IEEE Trans. Magn., 2008, 44, 3989–3991 CrossRef PubMed.
- E. Rapoport, D. Montana and G. S. D. Beach, Lab Chip, 2012, 21, 4433–4440 RSC.
- H. Wang, Y. Chen, A. Hassibi, A. Scherer and A. Hajimiri, Solid-State Circuits Conference – Digest of Technical Papers, 2009. ISSCC 2009. IEEE International, 2009 Search PubMed.
- R. S. Gaster, D. A. Hall and S. X. Wang, Lab Chip, 2011, 11, 950–956 RSC.
- D. M. Bruls, T. H. Evers, J. A. H. Kahlman, P. J. W. van Lankvelt, M. Ovsyanko, E. G. M. Pelssers, J. J. H. B. Schleipen, F. K. de Theije, C. A. Verschuren, T. van der Wijk, J. B. A. van Zon, W. U. Dittmer, A. H. J. Immink, J. H. Nieuwenhuis and M. W. J. Prins, Lab Chip, 2009, 9, 3504–3510 RSC.
- J. Germano, V. N. Martins, F. Cardoso, T. Almeida, L. Sousa, P. Freitas and M. S. Piedade, Sensors, 2009, 9, 4119–4137 CrossRef CAS PubMed.
- A. Deggerdal and F. Larsen, BioTechniques, 1997, 22, 554–557 CAS.
- R. Derks, A. Dietzel, R. Wimberger-Friedl and M. Prins, Microfluidics and Nanofluidics, 2007, 3, 141–149 CrossRef CAS.
- M. A. M. Gijs, Microfluidics and Nanofluidics, 2004, 1, 22–40 CAS.
- H. Wang, S. Kosai, C. Sideris and A. Hajimiri, Microwave Symposium Digest (MTT), 2010 IEEE MTT-S International, 2010 Search PubMed.
- H. Wang, C. Sideris and A. Hajimiri, Custom Integrated Circuits Conference (CICC), 2010 IEEE, 2010 Search PubMed.
- P. Cao, K. Xu, J. O. Varghese and J. R. Heath, Nano Lett., 2011, 12, 5581–5586 CrossRef PubMed.
- M. J. Hessner, L. Meyer, J. Tackes, S. Muheisen and X. Wang, BMC Genomics, 2004, 5, 53 CrossRef PubMed.
- A. W. Peterson, R. J. Heaton and R. M. Georgiadis, Nucleic Acids Res., 2001, 29, 5163–5168 CrossRef CAS PubMed.
- E. P. Ivanova, D. K. Pham, N. Brack, P. Pigram and D. V. Nicolau, Biosens. Bioelectron., 2004, 19, 1363–1370 CrossRef CAS PubMed.
- M. B. Eisen and P. O. Brown, Methods Enzymol., 1999, 179–204 CAS.
- D. R. Call and P. Darrell, BioTechniques, 2001, 30, 368–379 CAS.
- S. K. Chiu, M. Hsu, W. C. Ku, C. Y. Tu, Y. T. Tseng, W. K. Lau, R. Y. Yan, J. T. Ma and C. M. Tzeng, Biochem. J., 2003, 374, 625 CrossRef CAS PubMed.
- A. Steel, R. Levicky, T. Herne and M. Tarlov, Biophys. J., 2000, 79, 975–981 CrossRef CAS.
- S. L. Seurynck-Servoss, A. M. White, C. L. Baird, K. D. Rodland and R. C. Zangar, Anal. Biochem., 2007, 371, 105–115 CrossRef CAS PubMed.
- R. Gonzalez, S. Varnum and R. Zangar, Biomarker methods in drug discovery and development, 2008, 273–290 Search PubMed.
- Arrayit, Light pin cleaning protocol, http://arrayit.com/Products/Microarray_Instruments/Microarray_Pin_Cleaning/microarray_pin_cleaning.html, accessed October 1, 2012.
- Invitrogen, Dynabeads Wash Protocol, http://tools.invitrogen.com/content/sfs/manuals/dynabeads_myone_savC1_man.pdf, accessed October 1, 2012.
- Affymetrix, http://www.affymetrix.com.
- A. Niemz, T. M. Ferguson and D. S. Boyle, Trends Biotechnol., 2011, 29, 240–250 CrossRef CAS PubMed.
- Invitrogen, GeneCatcher™ Magnetic Beads, http://www.invitrogen.com/site/us/en/home/Products-and-Services/Applications/DNA-RNA-Purification-Analysis/dna-extraction/genomic-dna-extraction/GeneCatcher-Magnetic-Beads.html, accessed October 1, 2012.
Footnote |
| † Electronic supplementary information (ESI) available: Fig. S1–S3. See DOI: 10.1039/c3an01947k |
| This journal is © The Royal Society of Chemistry 2014 |

