 Open Access Article
 This Open Access Article is licensed under a
 Creative Commons Attribution 3.0 Unported Licence
Analysis of intracellular enzyme activity by surface enhanced Raman scattering†
Ross Stevensona,
Sarah McAughtriea,
Laura Seniora,
Robert J. Stokesa,
Helen McGachyb,
Laurence Tetleyc,
Paola Nativoa,
James M. Brewerc,
James Alexanderb,
Karen Fauldsa and
Duncan Graham*a
aCentre for Molecular Nanometrology, WestCHEM, Pure and Applied Chemistry, University of Strathclyde, 295 Cathedral Street, Glasgow, G1 1XL, UK. E-mail: duncan.graham@strath.ac.uk; Fax: +44 (0)1415520876; Tel: +44 (0)1415484701
bStrathclyde Institute of Pharmacy and Biomedical Sciences, University of Strathclyde, 161 Cathedral Street, Glasgow, G4 0RE, UK
cInstitute of Infection, Immunity and Inflammation, University of Glasgow Sir Graeme Davies Building, 120 University Place, Glasgow, G12 8TA, UK
First published on 29th August 2013
Abstract
Dysfunctional intracellular enzymatic activity is believed to be an underlying cause of a myriad of diseases. We present the first use of surface enhanced Raman scattering (SERS) as a detection technique capable of reporting intracellular activity of a specific enzyme. Careful choice of reagents allowed the preparation of high resolution cellular activity maps highlighting the specific conversion of the commonly used ELISA reagent 5-bromo-4-chloro-3-indolyl β-D-galactopyranoside (X-Gal), by wild type β-galactosidase enzymes. Further, through co-addition of X-Gal substrate and inhibitors we were able to demonstrate that intracellular substrate conversion occurred predominantly through an enzymatically specific pathway. The data presented therefore supports the application of SERS probes as sensitive, specific sensors of biochemical activity and demonstrates the use of SERS probes for the first time as beacons capable of high resolution subcellular localisation of native enzymes.
Introduction
The functional integrity of individual cells and organisms is crucially dependent upon the activity of cohorts of intracellular enzymes. Dysfunctional activity, localisation or the absence of specific enzymes is invariably associated with significant diseases including cystic fibrosis.1 As a result the ability to measure the activity and localisation of specific enzymes within a cellular environment is critical to life science research. A variety of methods exist for this purpose however, most are based on fluorescence or colorimetric detection which are limited in terms of either sensitivity or multiplexing capability.2 In addition, the reagents used for such analyses tend to provide uniform coverage across the cell which is acceptable when looking at populations but inadequate when trying to observe the sub-cellular compartmentalisation of enzymatic activities. Herein, we provide the first description of the use of surface enhanced Raman scattering (SERS) to detect galactosidase enzymes within cells in a non-destructive manner. SERS was facilitated by nanoparticle enhancement of the coloured hydrolysis product generated from the colorimetric substrate, 5-bromo-4-chloro-3-indolyl β-D-galactopyranoside (X-Gal), a commonly used marker for galactosidase enzymes.SERS requires the detection of light inelastically scattered from an analyte adsorbed onto a metal surface.3 Raman scattering is an inherently weak process prone to interference from fluorescence however, the development of SERS has led to a range of superior probes that show improved sensitivity and which can quench fluorescence.4,5 The main condition required to obtain SERS is the adsorption of the analyte onto a suitable enhancing surface, typically electrodes or specifically designed metal surfaces or nanoparticles.6 Gold or silver nanoparticles, as used in the study, can be coupled with different excitation sources to match the plasmon frequency of either unaggregated or aggregated nanoparticles.7 A further enhancement can also be obtained by using an analyte which has an electronic transition coincident with the Raman excitation frequency.8
In our approach, β-galactosidase was studied as an intracellular target to test the enzymatic generation of a SERS signal. We have previously shown that conversion of typical ELISA dye substrates, bromochloroindolylphosphate (BCIP) and 2,2-azino-bis(3-ethylbenzothiazoline-6-sulfonic acid) (ABTS), can be monitored by SERS in a sensitive and quantitative manner, however, this was never extended into a biological environment.9,10 β-galactosidase enzymes are stable and have the ability to hydrolyse dye substrates making them ideal for use in ELISAs and for testing cell senescence.11 In vitro β-galactosidase levels can currently be measured using the Miller technique12 however, this approach requires the destructive permeabilisation of the cell membrane. Herein, we report the first use of SERS to detect the activity of galactosidase enzymes from specific locations within cells by monitoring the conversion of X-Gal.
Materials and methods
Materials
All materials purchased were from Sigma-Aldrich except β-galactosidase (Calbiochem, UK) and gold nanoparticles, 40 nm (British Biocell International, UK).Measurements
Plate based spectroscopy was carried out using Renishaw inVia Raman spectrometers using different excitation wavelengths. An Ar-ion laser was used for work using a 514.5 nm (7.30 mW) incident wavelength, 632.8 nm (2.43 mW) was provided by a He–Ne laser and 785 nm utilised a laser diode (5.41 mW). An Olympus 20× LWD objective (N.A. 0.4) was used and the spectrometer grating was centred at 600 cm−1 and 10 s acquisitions were used. The specific experiment being carried out dictated what volumes of reagents were present in the sample wells.SERS mapping was performed using Renishaw inVia Raman spectrometers fitted with inverted and upright microscope systems equipped with a 100× LWD objective (N.A. 0.75) (∼6 mW power at the sample). Line mapping was performed using a StreamLine™ Raman mapping system (Renishaw plc, UK). SERS maps were coloured by integrating the area under the characteristic peak at 598 cm−1. A grating of 1200 l mm−1 was used with a RenCam CCD. Mapping was also performed with a WiTec alpha 300R (100× objective, N.A. 0.95) confocal Raman spectrometer (WiTec, Germany) (∼5 mW power at the sample). Both utilised a He–Ne 632.8 nm laser. The Renishaw spectrometer grating was centred at 600 cm−1 and used 10 s acquisitions. The WiTec system recorded spectra in the range 0–3000 cm−1 with 0.1 s acquisitions.
Sample preparation
Results and discussion
Prior to in vitro analysis the idealised SERS response was investigated using nanoparticles and different excitation frequencies (514.5 nm, 632.8 nm and 785 nm) under buffer conditions (10 mM phosphate buffer, pH 7.4). X-Gal itself yields a minimal SERS signal however, the dimerised hydrolysis product gives a strong peak at 598 cm−1 due to a skeletal vibration from the newly formed trans-alkene (Fig. 1 and S1, S2†).13 A comparison between several different, commonly used, nanoparticle suspensions namely citrate reduced gold and silver and EDTA reduced silver was carried out to compare the surface enhancement achieved. The combination of 632.8 nm excitation and gold nanoparticles (20 nm) provided the highest SERS signal in the shortest time (Fig. S2†). Smaller particles are inherently more stable and reliable and high signal intensity is achieved since the X-Gal product produces a strong blue colour with an absorbance maxima at ∼635 nm, putting it directly in resonance with both the surface plasmon of the aggregated gold nanoparticles (521 nm unaggregated, 630 nm aggregated) and the excitation frequency (632.8 nm). In order to prove that the reaction could be affected by known enzyme inhibitors two commercially available competitive inhibitors of β-galactosidase, phenylethyl-β-D-galactopyranoside (PEG) and phenylethyl-β-D-thiolgalactopyranoside (PETG)14 were used to investigate the inhibition of the enzyme and the resulting reduction of the SERS signal. The X-Gal and nanoparticle concentrations were maintained at 1 mM and 0.1 nM respectively. The inhibitor concentration was varied from 10 mM to 0.1 mM and a dose dependent response was observed (Fig. S3†). The inhibitors themselves gave minimal Raman signal and therefore did not influence the signal obtained from the hydrolysis of the X-Gal.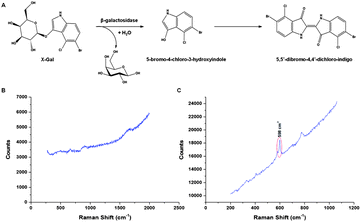 | ||
| Fig. 1 SERS detection to monitor the conversion of X-Gal. The conversion of the colourless X-Gal to the blue coloured (λmax = 635 nm) 5,5′-dibromo-4,4′dichloro-indigo by galactosidase (A) can be monitored by SERS. The product gives a new sharp vibrational Raman peak at 598 cm−1 as illustrated in the comparison of (B) and (C). | ||
A primary cell line, bone marrow-derived macrophages, was chosen to study the measurement of β-galactosidase activity by SERS. Macrophages naturally express β-galactosidase and readily endocytose metallic nanoparticles therefore eliminating the issue of cellular uptake of the nanoparticle substrates to obtain the enhancement of the Raman scattering.15 Suspensions of nanoparticles (0.1 nM) and X-Gal with various concentrations (10–0.1 mM) were added to macrophage cells grown on cover slips. Following 48 h of incubation the cells were washed, harvested and the cover slips attached to slides. The Raman spectra obtained from the cells are shown (Fig. 2A and B). The map is produced by taking the signal to baseline area (570–620 cm−1) of the major peak centred at 598 cm−1 at each individual pixel across the area. The StreamLine mapping system on the Renishaw inVia system utilizes line mapping, allowing large areas to be mapped rapidly whilst minimising tissue damage. A typical map would be a complete 150 micron by 100 micron area where Raman signals were collected every 2 microns in the X co-ordinate and 1.1 microns in the Y co-ordinate. The streamline mapping approach was limited to approximately 5–6 scans across the cell. Data can also be observed from a larger population (∼120 cells) using a 20× objective as shown in Fig. 2C. The data presented is representative of this type of experiment which has been repeated many times. It was also possible to produce a dose dependant response from the cells by varying the concentration of X-Gal substrate added to the cells (10 mM to 0.1 mM) as shown in Fig. S4.†
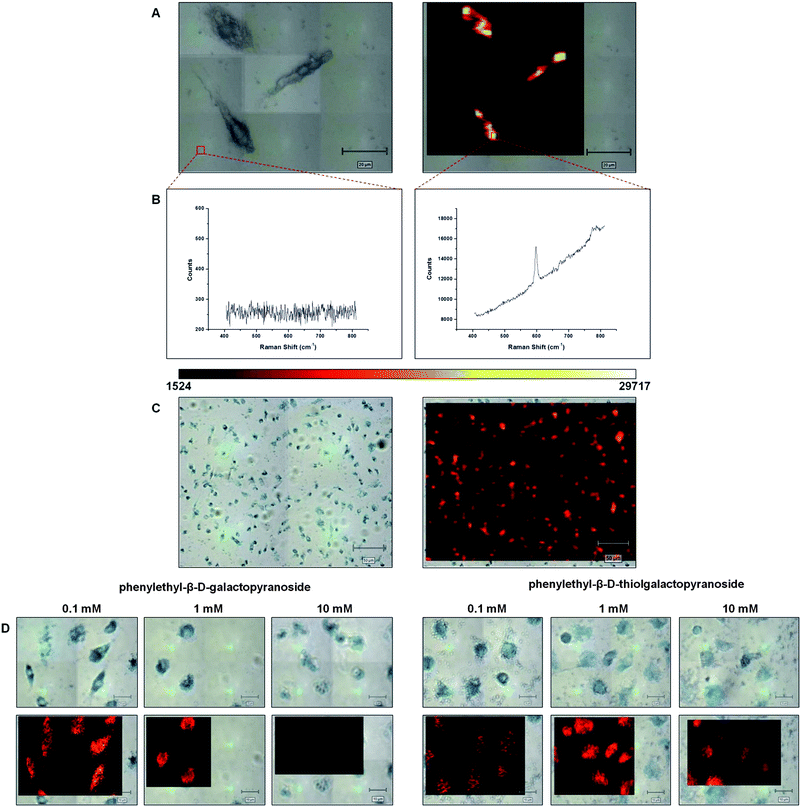 | ||
| Fig. 2 Intracellular SERS detection. The bright field (A) and false colour image (B) of three treated cells mapped by SERS using a 100× objective are shown. Spectra associated with specific mapped pixels are shown below each figure and the scale bar in (A) and (B) represents 20 μm. A false colour scale bar was used throughout and this is also shown below (A) and (B). Areas with no Raman signal appear black and areas with increasing peak intensity at 598 cm−1 are represented by increasing brightness. (C) Uses the same technique but looks at a larger area with use of a 20× objective. (D) Demonstrates the effect of inhibitor concentration on the cellular SERS response for both phenylethyl-β-D-galactopyranoside (PEG) and phenylethyl-β-D-thiolgalactopyranoside (PETG). The X-Gal and nanoparticle concentrations were 10 mM and 0.1 mM respectively. | ||
In order to test the specificity of this enzymatic transformation the two galactosidase inhibitors previously used in the optimisation of the conditions were applied to the cells. If the transformation was unique to the galactosidase then the inhibitors would reduce the enzymatic activity resulting in a lower SERS signal from the product of the X-Gal hydrolysis. In this set of experiments the X-Gal and gold nanoparticle concentrations were maintained at 10 mM and 0.1 nM respectively and the inhibitor concentrations diluted from 10 mM to 0.1 mM. The results, as shown in Fig. 2D, clearly indicate that there is a significant difference in the response measured by SERS when looking at the various concentrations of the two different inhibitors applied to the cells. In addition, it also indicates that PEG appears to be more effective than PETG 10 at inhibiting the β-galactosidase and that this is a biomolecularly specific interaction which is being measured using the gold nanoparticles and SERS within the cells. The same false colour scale was used throughout all maps.
TEM images taken of cell sections confirm that the nanoparticles were indeed inside the cell (Fig. 3A). The TEM images indicate that the nanoparticles are contained within endosomes and not simply adsorbed onto the cell membrane. Upon isolation of the nanoparticle containing intracellular compartments it was possible to characterise them as LAMP-1 expressing but transferrin receptor negative suggesting these were late endosomes or lysosomes (Fig. S5†).16,17
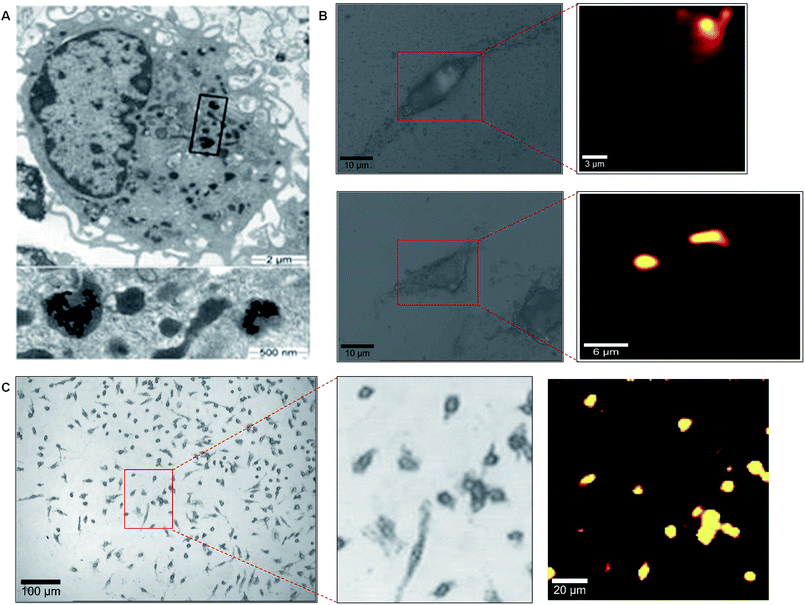 | ||
| Fig. 3 Localisation of nanoparticles within cells. Macrophages treated with gold nanoparticles are show in (A). A magnified version of the highlighted area is shown in the lower figure. (B) High resolution mapping of two individual macrophage cells and their associated false colour Raman images. (C) High resolution mapping of a cell population using a 20× objective. | ||
In order to prepare higher definition maps to observe spectra every 100 nm in the X and Y co-ordinates, a point mapping approach was taken whereby the stage was moved by 400 μm2 in combination with a 100× objective (N.A. 0.9) to provide approximate lateral resolution of 461 nm optically. The results, shown in Fig. 3B, are in agreement with the TEM image indicating that sub-cellular localisation of the nanoparticles can be observed by SERS. Furthermore, this is the first demonstration of the potential to measure enzyme activity at nanometre dimensions using SERS. Also, as shown in Fig. 3C, it was possible to screen a larger area of cells with the same high resolution screening.
These results are the first to demonstrate that SERS can be used to detect enzyme activity in an intracellular environment and that SERS provides several important advantages over conventional approaches. Firstly, detection of the substrate X-Gal with a commonly studied enzyme has been reported using gold nanoparticles and SERS. The formation of a substrate product which offers a strong unique SERS fingerprint has been monitored over a standard ELISA timeframe allowing the observation of the increasing levels of enzyme turned-over product. This aspect of the work is novel yet runs parallel to some of our groups' earlier studies where we analysed the suitability of SERS as a detection method with commonly used ELISA reagents.9,10,18 Our results also show that the measurement is specific to β-galactosidase enzymes since the addition of β-galactosidase inhibitors reduces the observed SERS signal and that the SERS response is dependent on inhibitor concentration proving that we are not observing non-specific hydrolysis. The inhibitors used both contain a galactopyranoside moiety and compete with X-Gal for the active site of the enzyme. Turnover of X-Gal yields an indole/indigo dye with a large vibrational Raman cross-section whereas the inhibitors produce phenylethyl groups with negligible Raman responses.
By combining this chemical innovation with high resolution SERS mapping it was possible to localise nanoparticles within specific cellular sites and measure biomolecular activity. Indeed, the ability to measure enzyme activity specifically in the endolysosome compartment allows the use of our approach in a wide variety of biological systems and in particular is significant for major pathophysiological conditions associated with lysosomal enzyme disorders such as Parkinson's and Alzheimer's.16,17 Differential quantification of galactosidase enzyme activities in these subcellular compartments during different disease states or inflammatory processes will provide clear insights as to how best to manipulate these biological systems therapeutically. These studies strongly support the application of SERS approaches to quantify and localise specific multiparameter biochemical activities within cells which will have a significant impact on functional biochemical imaging and analysis of a variety of biological samples.
Conclusions
The application of nanoparticles to cells has been a field of intense research and here we show that by combining the innovative detection of the X-Gal product with high resolution SERS mapping it becomes possible to localise the nanoparticles to specific cellular sites. It should be noted that SERS has previously been used in intracellular studies to measure pH and to detect 11 individual cellular components.19–22 However, these earlier studies have either delivered SERS active nanoparticles into cells22 or have relied on the cellular components to offer modest Raman gains.21 In this particular study metallic nanoparticles were employed to selectively enhance the molecular vibrations of a molecule which only becomes Raman active upon interaction with the target enzyme and this is the first documented intracellular Raman enzyme detection method. It is worth raising the point that we only observe signals from specific areas within the cell where both the nanoparticles and the turned-over product are present. However, this may not represent the true location of the enzymes. Further, it is possible that an area with a high Raman signal could be indicative of either a high concentration of nanoparticles or high enzyme concentration as it is well established that aggregated nanoparticles yield greater SERS signal. Although fluorescence spectroscopy has traditionally been the technique of choice for the monitoring of such enzyme activity it is clear that the SERS method confers numerous advantages over fluorescence namely the ability to obtain specific molecular information and its multiplexing capability. Indeed the potential to detect and measure the activity and location of multiple enzymes exists as a direct result of the sharp molecularly specific spectral bands produced by SERS. In addition, it is hoped that with the introduction of live cells, ultrafast Raman imaging, careful temporal analysis and complementary TEM analysis SERS approaches may be able to definitively ascribe enzymes to specific cellular locations. These studies strongly support the application of SERS approaches to quantify and localise specific multiparameter biochemical activities within cells. This will have a significant impact on functional biochemical imaging and the analysis of a variety of biological samples.Acknowledgements
The authors acknowledge the EPSRC platform grant EP/E000584/1 for supporting this work and the Royal Society for a Wolfson Research Merit Award to DG.Notes and references
- S. Holland, Clin. Rev. Allergy Immunol., 2010, 38, 3–10 CrossRef CAS PubMed.
- R. M. Yates, A. Hermetter, G. A. Taylor and D. G. Russell, Traffic, 2007, 8, 241–250 CrossRef CAS PubMed.
- M. Fleischmann, P. J. Hendra and A. J. McQuillan, Chem. Phys. Lett., 1974, 26, 163–166 CrossRef CAS.
- X. Zhang, J. Zhao, A. V. Whitney, J. W. Elam and R. P. Van Duyne, J. Am. Chem. Soc., 2006, 128, 10304–10309 CrossRef CAS PubMed.
- K. Kneipp, Y. Wang, H. Kneipp, L. T. Perelman, I. Itzkan, R. R. Dasari and M. S. Feld, Phys. Rev. Lett., 1997, 78, 1667–1670 CrossRef CAS.
- K. Hering, D. Cialla, K. Ackermann, T. Dörfer, R. Möller, H. Schneidewind, R. Mattheis, W. Fritzsche, P. Rösch and J. Popp, Anal. Bioanal. Chem., 2008, 390, 113–124 CrossRef CAS PubMed.
- R. J. Stokes, A. Macaskill, P. J. Lundahl, W. E. Smith, K. Faulds and D. Graham, Small, 2007, 3, 1593–1601 CrossRef CAS PubMed.
- K. Faulds, R. P. Barbagallo, J. T. Keer, W. E. Smith and D. Graham, Analyst, 2004, 129, 567–568 RSC.
- R. Stevenson, A. Ingram, H. Leung, D. C. McMillan and D. Graham, Analyst, 2009, 134, 842–844 RSC.
- F. M. Campbell, A. Ingram, P. Monaghan, J. Cooper, N. Sattar, P. D. Eckersall and D. Graham, Analyst, 2008, 133, 1355–1357 RSC.
- V. Bassaneze, A. A. Miyakawa and J. E. Krieger, Anal. Biochem., 2008, 372, 198–203 CrossRef CAS PubMed.
- J. H. Miller, Experiments in Molecular Genetics, Cold Spring Harbor Laboratory Press, USA, 1972 Search PubMed.
- D. A. Long, J. Raman Spectrosc., 2004, 35, 905 CrossRef.
- D. H. Juers, S. Hakda, B. W. Matthews and R. E. Huber, Biochemistry, 2003, 42, 13505–13511 CrossRef CAS PubMed.
- R. Shukla, V. Bansal, M. Chaudhary, A. Basu, R. R. Bhonde and M. Sastry, Langmuir, 2005, 21, 10644–10654 CrossRef CAS PubMed.
- T. E. Tjelle, B. Saigal, M. Froystad and T. Berg, J. Cell Sci., 1998, 111, 141–148 CAS.
- C. Bellettato and M. Scarpa, J. Inherited Metab. Dis., 2010, 33, 347–362 CrossRef CAS PubMed.
- S. Laing, A. Hernandez-Santana, J. R. Sassmannshausen, D. L. Asquith, I. B. McInnes, K. Faulds and D. Graham, Anal. Chem., 2010, 83, 297–302 CrossRef PubMed.
- C. E. Talley, L. Jusinski, C. W. Hollars, S. M. Lane and T. Huser, Anal. Chem., 2004, 76, 7064–7068 CrossRef CAS PubMed.
- H.-W. Tang, X. B. Yang, J. Kirkham and D. A. Smith, Anal. Chem., 2007, 79, 3646–3653 CrossRef CAS PubMed.
- J. Kneipp, H. Kneipp, M. McLaughlin, D. Brown and K. Kneipp, Nano Lett., 2006, 6, 2225–2231 CrossRef CAS PubMed.
- J. Kneipp, H. Kneipp, W. L. Rice and K. Kneipp, Anal. Chem., 2005, 77, 2381–2385 CrossRef CAS PubMed.
Footnote |
| † Electronic supplementary information (ESI) available. See DOI: 10.1039/c3an00729d |
| This journal is © The Royal Society of Chemistry 2013 |