 Open Access Article
An in situ spatially resolved analytical technique to simultaneously probe gas phase reactions and temperature within the packed bed of a plug flow reactor
Jamal
Touitou
a,
Robbie
Burch
a,
Christopher
Hardacre
*a,
Colin
McManus
a,
Kevin
Morgan
a,
Jacinto
Sá
b and
Alexandre
Goguet
*a
aCenTACat, School of Chemistry and Chemical Engineering, Queen's University Belfast, Belfast, BT9 5AG, Northern Ireland, UK. E-mail: c.hardacre@qub.ac.uk; a.goguet@qub.ac.uk
bLaboratory for Catalysis and Sustainable Chemistry, Paul Scherrer Institute, 5232 Villigen PSI, Switzerland
First published on 15th March 2013
Abstract
This paper reports the detailed description and validation of a fully automated, computer controlled analytical method to spatially probe the gas composition and thermal characteristics in packed bed systems. As an exemplar, we have examined a heterogeneously catalysed gas phase reaction within the bed of a powdered oxide supported metal catalyst. The design of the gas sampling and the temperature recording systems are disclosed. A stationary capillary with holes drilled in its wall and a moveable reactor coupled with a mass spectrometer are used to enable sampling and analysis. This method has been designed to limit the invasiveness of the probe on the reactor by using the smallest combination of thermocouple and capillary which can be employed practically. An 80 μm (O.D.) thermocouple has been inserted in a 250 μm (O.D.) capillary. The thermocouple is aligned with the sampling holes to enable both the gas composition and temperature profiles to be simultaneously measured at equivalent spatially resolved positions. This analysis technique has been validated by studying CO oxidation over a 1% Pt/Al2O3 catalyst and the spatial resolution profiles of chemical species concentrations and temperature as a function of the axial position within the catalyst bed are reported.
Introduction
The development and optimization of catalysts, adsorbents and plug flow reactors are key steps to meet the materials, energy and environmental challenges that the world is facing. One of the greatest challenges in the development of an industrial gas phase process is the deduction of the mechanistic steps in the system and the determination of the relevant kinetic parameters. For catalyst systems, in particular, direct exploration of how a chemical reaction occurs in the presence of the active material is required. Currently, an understanding of the phenomena occurring within the packed bed inside the reactor is limited. Commonly, the gas sampling probes are located downstream of the packed bed and, therefore, provide end-of-pipe measurements. This type of analysis requires knowledge of the gas composition upstream (zero conversion) and downstream of the packed bed. Until recently, it has not been possible to access the packed bed in situ (gas concentration profiles, temperature and catalyst structure) without disturbing the material significantly.To overcome these problems and to better understand the phenomena occurring in the packed bed, computational models and simulations of reactions in the catalyst bed have been developed.1 However, most of these models are applicable for a limited number of reactions and only for very specific conditions (pressure and temperature). In addition, such models have not been validated by experiments due to the previously outlined limitations in the experimental methods available. Development of in situ analysis of, for example, gas phase heterogeneous catalysts has been a goal for many groups as it provides important reaction profile information and is a valuable tool with which to validate computational models.
A number of techniques have been designed to overcome some of these issues based on transient methods. For example, despite its limitations in terms of the “pressure gap”, the Temporal Analysis of Products (TAP) reactor system can identify short-lived reaction intermediates and provide mechanistic insights due to the fast sampling ability of TAP.2,3 Steady State Isotopic Transient Kinetic Analysis (SSITKA) is also used to obtained useful kinetic information on the reaction using fast switching of isotopes.4 The amount of information provided by this type of technique during the relaxation of the system has been shown to be valuable in determining both reaction mechanism information as well as the number of active sites.
Recently, techniques have been developed to provide spatially resolved profiles of gas concentration and temperature within structured catalyst beds with minimal invasiveness. The spatially resolved capillary-inlet mass spectrometer (Spaci-MS) system provides temporal and spatial (axial and radial) analytical information for monolith supported catalysts.4 Initially developed by Oak Ridge National Laboratory (ORNL) and then further developed in conjunction with ORNL by our group, the Spaci-MS technique allows the gas concentration profiles as well as the temperature profiles to be obtained with high spatial resolution. A similar approach has been developed at the Fritz-Haber Institute, using a single axially mounted, movable and rotatable capillary connected to a quadrupole mass spectrometer for use with drilled foam catalysts and spherical pellets. The capillary contains a thermocouple or a Raman probe for temperature and spectroscopy analysis.5–7 Forzatti et al. developed a similar technique to investigate honeycomb catalyst using a capillary combined with a thermocouple and pyrometer connected to a GC.8,9 Kopyscinski et al. have also developed a technique to study catalyst plates placed under a quartz glass window.10 The gas concentration profile was obtained using a moveable capillary located above the catalyst plate and the temperature of the catalyst surface was obtained using an infrared camera.
In addition, Baiker et al. placed fixed sampling probes and thermocouples at different positions along the catalyst bed.11 This led to useful information; however, the sampling was invasive and also had limited spatial resolution with the sampling at 10 cm intervals. Liu et al. developed the “Fixed-bed Reactor O2 Distributor” for the examination of catalytic partial oxidation of methane. The gas and temperature profiles were obtained using a moveable sampling probe and thermocouple to measure the variation in O2 concentration and temperature within the catalyst bed.12 In this case, the packed bed was disturbed compared with conventional operation as the system is modified by introducing fresh reactant (oxygen) at a number of axial points throughout the catalyst bed and causing the bed to settle on moving the sampling port.
Recently, a new technique to record spatially resolved gas concentration and temperature profiles in packed beds with minimal invasiveness has been reported by our group.13 Therein, a fixed, thin capillary with holes drilled in the walls of the probe was placed within a bed of powder. The capillary was connected to a quadrupole mass spectrometer and the packed bed was moved such that the capillary sampled the gas spatially along the material. In the current work, this system has been further improved to allow simultaneous in situ recording of gas concentration and temperature profiles. This is achieved through the use of a very thin thermocouple; the smallest commercially available, coupled with a capillary with the minimum O.D. required for the thermocouple to be inserted within the probe. Furthermore, a Thorlabs automated linear translation stage has been added to replace the previously reported manual transfer mechanism. This improved automated system provides increased accuracy of sampling positioning and the ability to increase the number of sampling points down the catalyst bed. This analytical technique has been exemplified using a heterogeneously catalysed gas phase reaction specifically, CO oxidation catalysed by 1% Pt/Al2O3 was studied.
Set-up
The system developed can be divided in three main elements:Tubular reactor, automatic linear mechanism and heating system
The sampling system (described in the following section and depicted in Fig. 1) is positioned inside a quartz tubular reactor (80 mm length, 3 mm I.D., 6 mm O.D.). The quartz reactor is held by two conflat flanges with an O.D. of 70 mm (DN40CF, Caburn) fitted with a ¼′′ Swagelok connection and sealed with ¼′′ Teflon ferrule.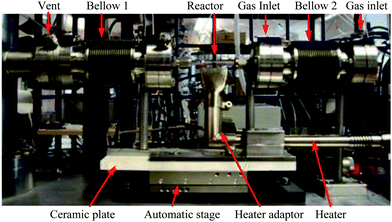 | ||
| Fig. 1 Key elements of the system. | ||
The two conflat flanges holding the reactor are connected and located between two bellows which allow the controlled linear movement of the reactor. Both bellows have an O.D. of 70 mm with a free movement length of 50 mm (DN40CF, Caburn). To allow the movement of the reactor equal to the free movement of the bellows during the experiment, with minimal interference on the system, an automatic linear translation stage (LNR50SE/M, Thorlabs) was employed. The linear translation stage is combined with the two bellows which are attached via flanges with the flange on the inlet side secured on a post fixed to the stage (see Fig. 1). The movement of the reactor is possible by extension/compression of the bellows controlled by the automatic linear translation stage. The automated system allows movement with 10 μm precision over a total range of movement of 50 mm. An important aspect of the apparatus is that the reactor moves whilst the capillary remains stationary and rigid (discussed in the next section). This reduces the strain on the capillary and decreases the possibility of the capillary breaking.
The heating of the reactor is achieved via a hot air heater (Le Mini, Leister) connected to a compressed air supply and is placed perpendicular to the reactor (see Fig. 1). The air flow is regulated with a manual valve with a maximum pressure of 8 bar while the air flow temperature is controlled with a solid state relay connected to a K-type thermocouple. It should be noted that the temperature in the catalyst bed is monitored via an independent thermocouple, which is described in the following section. A specially designed nozzle (stainless steel, 8 mm × 30 mm) is utilised in order to direct and focus the hot air flow onto the reactor with a constant and regular flow from the heater. The distance between the end of the nozzle and the reactor was kept constant at 5 mm for all the experiments. The heater is also attached to the linear translation stage so that the relative position of the heater compared with the reactor is maintained during the experiment. This configuration allows a maximum reactor temperature of 500 °C. Due to the high temperatures produced by the heater, a 1 cm ceramic plate has been installed between the motor of the linear translation stage and the heater to minimise heat transfer to the transfer motor and subsequent risk of damage to the latter. The use of the hot air heater did not require any further specific safety measures; the temperature decreases quickly after the first 5 cm of hot air flow and the temperature measured 10 cm above the nozzle was 80 °C at full power.
As described previously,13 this heating system provides the additional advantage of visual access to the reactor which, after some modifications, will allow the coupling of the spatial resolution technique with a number of spectroscopic techniques in the future.
Gas delivery, gas sampling and temperature recording system
The introduction of gases into the reactor occurs through two different inlets to limit the dead volume created by the bellow located upstream of the reactor (see Fig. 2). The inert gas is introduced via a drilled inlet within the flange located upstream of bellow 1 while the reactant gases are introduced via a drilled inlet (perpendicular to reactor axial direction) within the flange directly downstream of bellow 1, which holds the reactor.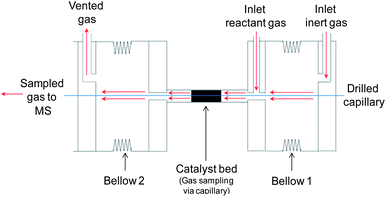 | ||
| Fig. 2 Gas flow within the system. | ||
The dead volume is further reduced due to the fact that the inert gas fills bellow 1 and then flows towards the reactor where it is mixed with the reactant gases prior to entering the reactor. A reduction in the dead volume is important in order to improve the response time of system, particularly for transient experiments. The gas to be analysed enters the capillary through sampling holes (vide infra) while the remaining gas exits the reactor and is vented via a drilled outlet on the flange directly downstream of bellow 2.
The flow rate of the gases is regulated by mass flow controllers with accuracy better than ±1% (FC-7700C, Aera). The inlet gas was pre-heated using heating tape around the feed tube and the bellow located upstream of the reactor to improve the temperature control.
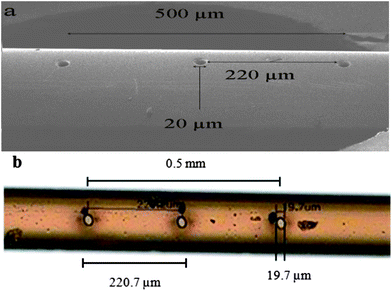
In order to sample the gas phase and accommodate the fitting of the thin thermocouple (80 μm O.D., type K, T33, Okazaki), a synthetic, fused silica capillary (250 μm O.D., 100 μm I.D., Polymicro Technologies) was utilised. The sampling capillary had holes drilled in the wall (by Oregon Physics, Hillsboro, Oregon, USA) using a xenon focused ion beam (Plasma-FIB). The diameter of the sampling holes is ∼20 μm. Six holes (3 pairs with 180° spacing) have been drilled and spread over 0.5 mm in order to avoid complete blockage of the capillary if one or several holes are covered by particles (see Fig. 3). This method of drilling the capillary differs from that reported previously, which used laser ablation.12 Compared with the laser ablation method (femtosecond pulse IR solid-state laser), plasma-FIB offers a higher accuracy of drilling, with a better alignment and a better control of the hole diameter. The second advantage is that this technique is less destructive for the capillary which increases the resistance to mechanical breakage. The comparison of the holes drilled by each method is shown in Fig. 3. Clearly, the effect of the laser can be seen around the holes of the capillary in Fig. 3b due to the heat of the laser which melts the coating of the capillary. The configuration of holes limits the spatial resolution within the system to 0.5 mm.
 | ||
| Fig. 3 Sampling holes of the capillary (a) capillary drilled by plasma-FIB, (b) capillary drilled by femtosecond pulse IR solid-state laser (picture obtained by optical microscopy). | ||
The pumping rate of the system through the capillary was measured by isolating the system so that the only channel for gas transport was through the sampling capillary. This was achieved by closing the vent line and the reactant gas inlet line, and connecting the inert gas line to a flow meter instead of the MFC, i.e. there was no flow of gas. The system was equilibrated prior to measuring the pumping rate for a period of 2 h. The measured pumping rate is ∼50 μL min−1, which represents 0.1% of the inlet flow of the validation experiment conditions detailed below (i.e. 50 mL min−1). Therefore, the impact of the gas sampled from the system can be considered as negligible. The thermocouple was present during these measurements.
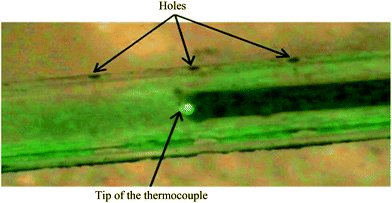
The thermocouple was inserted into the drilled capillary until the tip of the thermocouple was aligned with the middle pair of sampling holes, corresponding to the gas inlet axial direction (see Fig. 4). The position of the thermocouple within the capillary was maintained using epoxy, acrylic, and polyurethane adhesives (Araldite). This glue was chosen first, to seal the space between the capillary and the thermocouple in order to avoid leaks from the capillary. In addition, it allowed the reuse of the thermocouple and the capillary by dissolving the glue in an acetone–dichloromethane mixture.
 | ||
| Fig. 4 Picture of the capillary with the thermocouple inserted (picture obtained by optical microscopy). | ||
The temperature was recorded using a Picolog interface. To assess the response of the system, the temperature profile in the reactor in the absence of reaction was recorded using a flow of pure argon. The temperature profile had excellent stability (variation < 1 °C) over the full range of movement of the linear translation stage.
In order to analyse the gases, the end of the capillary corresponding to the gas outlet axial direction is directly connected to the vacuum chambers containing the mass spectrometer (details in the next section). The capillary is connected via a specially designed adaptor, which has been welded onto the vacuum flange. This adaptor holds and seals the capillary with the use of a 1/16′′ Swagelok nut compressing a graphite ferrule with a 300 μm hole (SGE Analytical). It should be noted that the capillary connector does not use a normal QIC liner. The consequences are that the capillary is fixed in space and its response time to transient behaviour (and therefore subsequent MS response) is greatly reduced as discussed in the following section. The other end of the capillary (where the thermocouple is inserted) is attached with an adaptor, similar to that used for the vacuum chamber side, which is attached to a fixed post to keep the capillary taut and stationary during the entire experiment. The length of the capillary from the sampling zone to the vacuum chamber is 18 cm.
Vacuum chamber and mass spectrometer
The vacuum system is composed of two chambers both connected to a turbo molecular pump (TMU 521 DN, Pfeiffer Vacuum) backed by a mechanical pump (DUO 10 M, Pfeiffer Vacuum) maintaining a base pressure of 2.5 × 10⁻⁶ Torr measured using a cold cathode pressure gauge (PKR 251, Pfeiffer Vacuum). Two differentially pumped vacuum chambers are necessary to maintain the appropriate pressure for the normal use of the quadrupole mass spectrometer (HPR20, Hiden analytical). The vacuum chambers are perpendicularly aligned to reduce the distance between the sampling point in the reactor and the MS. The difference in the pressure created between the reactor and the two vacuum chambers creates a pressure gradient which forms a molecular beam from the capillary to the mass spectrometer for analysis (see Fig. 5).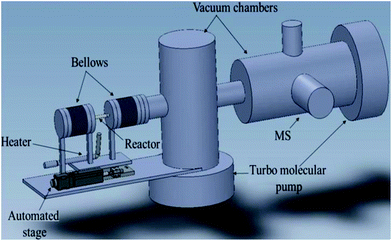 | ||
| Fig. 5 3D representation of the spatial resolution set-up. | ||
Validation of the technique
CO oxidation over a 1 wt% Pt/Al2O3 was used to validate the apparatus.14| CO + 0.5O2 → CO2, ΔHr = −280.5 kJ mol−1 |
Oxidation of CO over Pt was selected as it is an exothermic reaction and has significant practical relevance. The amount of catalyst (prepared by wet impregnation) used for each reaction was 40 mg (particle size between 250 and 450 μm); which gave a catalyst bed length of 8 mm. The size of the particles has been chosen to be larger than the diameter of the capillary (O.D.: 250 μm) in order to limit the effect of channelling due to the presence of the capillary in the catalyst bed. Prior to each experiment the catalyst was reduced at 200 °C for 2 h under 1% H2 in Ar. The reaction was undertaken using an overall flow of 50 cm3 min−1 containing 2% CO, 20% O2, 1% Kr and 77% Ar. All gases (CO, O2, Kr and Ar) were provided by BOC (purity > 99.9%). Prior to the reaction the sampling zone and the thermocouple were positioned 5 mm up-stream of the catalyst bed. The temperature and gas profiles were obtained by moving the reactor every 0.5 mm to match the resolution of the sampling zone with a dwell time of 5 min at each sampling point. This dwell time was used to examine the stability of the system during the experiment. The movement of the reactor and the recording of the data (gas and temperature profiles) were performed using a PC.
Fig. 6 shows the evolution of the gas concentration and temperature profiles upstream of, within and downstream of the catalyst bed during the reaction.
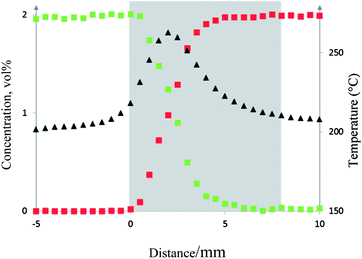 | ||
Fig. 6 Gas concentration profiles of CO ( ), CO2 ( ), CO2 ( ) and temperature profile ( ) and temperature profile ( ). The catalyst bed is represented by the shaded area. ). The catalyst bed is represented by the shaded area. | ||
As expected, no conversion was observed upstream of the catalyst bed. Within the catalyst bed, CO and O2 (not shown here) start to be consumed and CO2 is formed. Full conversion of CO is observed 6 mm from the start of the catalyst bed. At 6 mm, the concentration of CO2 = 2% which equates to full CO conversion (i.e. a carbon balance was observed). The gas concentration profiles remain constant as the sampling continues further downstream. The spatially resolved temperature profile shows a maximum increase in temperature at 50% conversion (from 210 to 260 °C). This is expected as it is where the maximum rate of reaction occurs and the increase is due to the exothermicity of the reaction.
Conclusions
The detailed experimental analytical methodology for the development of a spatially resolved technique to measure the temperature and gas composition profiles within a packed powdered bed has been reported. The technique has been validated using CO oxidation catalysed over a Pt/Al2O3 catalyst. In this case, the combined gas and temperature profiles within a fixed bed of catalyst have been reported for the first time using this technique. Whilst exemplified for a gas phase heterogeneously catalysed reaction, this analytical technique offers the opportunity to examine a wide range of systems, for example adsorbents for flue gas treatment, CO2 capture media, catalytic distillation units as well as many industrial catalytic processes.Acknowledgements
EPSRC is acknowledged for funding this work as part of the CASTech project (Grant number EP/G012156/1) as well as Mr J. Knox and his team from the mechanical workshop (School of Mechanical Engineering, Queen's University, Belfast) for their help and advice.Notes and references
- J. N. Kapur, Mathematical Modelling, New Age International Ltd., New Delhi, India, 1998 Search PubMed.
- J. T. Gleaves, G. S. Yablonskii, X. Zheng, R. Fushimi and P. L. Mills, J. Mol. Catal. A: Chem., 2010, 315, 108 CrossRef CAS.
- J. Pérez-Ramírez and E. V. Kondratenko, Catal. Today, 2007, 121, 197 CrossRef.
- J. Sá, D. L. Abreu Fernandes, F. Aiouache, A. Goguet, C. Hardacre, D. Lundie, W. Naeem, W. P. Partridge and C. Stere, Analyst, 2010, 135, 2260 RSC.
- R. Horn, O. Korup, M. Geske, U. Zavyalova, I. Oprea and R. Schlögl, Rev. Sci. Instrum., 2010, 81, 6 CrossRef.
- O. Korup, S. Mavlyankariev, M. Geske, C. F. Goldsmith and R. Horn, Chem. Eng. Process., 2011, 50, 998 CrossRef CAS.
- M. Geske, O. Korup and R. Horn, Catal. Sci. Technol., 2013, 3, 169 CAS.
- A. Donazzi, D. Livio, A. Beretta, G. Groppi and P. Forzatti, Appl. Catal., A, 2011, 402, 41 CrossRef CAS.
- A. Donazzi, D. Livio, M. Maestri, A. Beretta, G. Groppi, E. Tronconi and P. Forzatti, Angew. Chem., Int. Ed., 2011, 50, 3943 CrossRef CAS.
- J. Kopyscinski, T. J. Schildhauer, F. Vogel, S. M. A. Biollaz and A. Wohaun, J. Catal., 2010, 271, 262 CrossRef CAS.
- A. Baiker and D. Epple, Appl. Catal., 1986, 22, 55 CrossRef CAS.
- S. Liu, W. Li, Y. Wang and H. Xu, Fuel Process. Technol., 2008, 89, 1345 CrossRef CAS.
- J. Touitou, K. Morgan, R. Burch, C. Hardacre and A. Goguet, Catal. Sci. Technol., 2012, 2, 1811 CAS.
- J. Singh, E. M. C. Alayon, M. Tromp, O. V. Safonova, P. Glatzel, M. Nachtegaal, R. Frahm and J. A. van Bokhoven, Angew. Chem., Int. Ed., 2008, 47, 9260 CrossRef CAS.
| This journal is © The Royal Society of Chemistry 2013 |
