Efficient division and sampling of cell colonies using microcup arrays†
Jeng-Hao Paia, Kimberly Kluckmanb, Dale O. Cowleyb, Donna M. Bortnerb, Christopher E. Simsa and Nancy L. Allbritton*ac
aDepartment of Chemistry, University of North Carolina, Chapel Hill, NC 27599, USA. E-mail: nlallbri@unc.edu; Fax: +1 (919) 962-2388; Tel: +1 (919) 966-2291
bTransViragen, Inc., PO Box 110301 Research Triangle Park, NC 27709, USA
cDepartment of Biomedical Engineering, University of North Carolina, Chapel Hill, NC 27599, and North Carolina State University, Raleigh, NC 27695, USA
First published on 19th October 2012
Abstract
A microengineered array to sample clonal colonies is described. The cells were cultured on an array of individually releasable elements until the colonies expanded to cover multiple elements. Single elements were released using a laser-based system and collected to sample cells from individual colonies. A greater than an 85% rate in splitting and collecting colonies was achieved using a 3-dimensional cup-like design or “microcup”. Surface modification using patterned titanium deposition of the glass substrate improved the stability of microcup adhesion to the glass while enabling minimization of the laser energy for splitting the colonies. Smaller microcup dimensions and slotting the microcup walls reduced the time needed for colonies to expand into multiple microcups. The stem cell colony retained on the array and the collected fraction within released microcups remained undifferentiated and viable. The colony samples were characterized by both reporter gene expression and a destructive assay (PCR) to identify target colonies. The platform is envisioned as a means to rapidly establish cell lines using a destructive assay to identify desired clones.
Introduction
Development of cell lines is a ubiquitous activity for a diverse array of applications that include hybridoma selection,1 cDNA and phage libraries,2,3 protein-producing clones for biologic therapeutics,4 gene knockout and gene targeted stem cell lines,5–7 and generation of induced pluripotent stem cells8 among others. Picking colonies composed of optimal clones from a pool of randomly generated cell lines is almost always required to create the cell line(s) of interest. In most instances, the identification of those cells possessing the desired characteristic requires that the picked colony be expanded and then split with one portion submitted for a genetic or biochemical analysis. Unfortunately, these steps needed to create stable mammalian cell lines are very time and labor intensive.Colony picking remains one of the most critical and time consuming phases in the process of cell-line generation. Tedious colony-forming assays are used in conjunction with isolation and collection via a cloning ring, trypsinization and pipet aspiration.9–12 Typically, colonies must be allowed to expand for weeks to reach adequate size (≥1 mm) for picking as dehydration, enzymatic digestion, and mechanical trauma all conspire to reduce cell viability with manual or automated colony picking protocols.13–15 In these protocols, each colony is picked with a pipet and disaggregated. The cells of each colony are then split and a portion prepared for an analysis technique (e.g. polymerase chain reaction [PCR] or immunohistochemistry) to determine if the colony is composed of suitable cells.16 The remainder of the cells are maintained in culture or frozen pending the outcome of the analysis. The laborious efforts involved in picking and splitting colonies, and the subsequent analysis practically limit the number of clones collected and analyzed. In the field of stem-cell biology, the large number of media changes and volumes required represent a significant drawback due to the expense of growth factors required for stem cell culture. In addition, the large number of pipetting operations, trypsinization steps, and other procedures required to clone and identify the stem cells of interest lead to high passage numbers and untoward effects on the cells that can make the cells unsuitable for the intended experimental purposes.17
Over the past two decades, the pharmaceutical and biotechnology industries have driven the manufacture of a variety of high-throughput platforms to automate the generation of vectors, transfection of these into host cells, and the selection of appropriate clones.18–20 Within this effort, robotic colony picking tools have been made available from a variety of manufacturers; however, these technologies are too expensive for most academic labs and core facilities. In addition, they have significant limitations beyond their cost as they were originally developed for aspirating bacterial and yeast colonies from agar plates. When used to pick mammalian cell colonies, the automated systems use image recognition to guide a suction pipet that aspirates colonies growing in loosely adherent clusters or suspension-adapted versions of adherent cells growing in a semi-solid methylcellulose media. The viability of mammalian cells from colonies obtained in this manner is also limited, so that in practice, robotic clone picking is typically used with bacterial or robust tumor cell lines.21
Numerous techniques have been developed for culture and screening of cells and colonies utilizing microarray or microfluidic devices; however, retrieval of colonies grown on these devices has in general not been the principle design goal as the majority have been directed at isolation of single cells, not colonies.22–27 A few publications have discussed whole colony retrieval, and fewer still isolation of cells from a colony. Ashton et al. described a microcontact printed array from which individual colonies (neurospheres) were manually dislodged with a surgical blade and aspirated using a pipette.22 Lee et al. demonstrated the use of laser microdissection to collect hepatocyte colonies patterned on a microarray, but the process required cell fixation prior to collection so that the cells were nonviable.28 Khademhosseini fabricated a microwell array composed of a polymer that swelled and contracted in response to temperature and that was used to generate and retrieve aggregates of hepatic tumor cells, but required en mass release and collection of the colonies.29 Recently, Villa-Diaz et al. reported an interesting approach to sample cells from a stem-cell colony cultured in a microfluidic channel under laminar flow.30 Addition of trypsin to one stream enzymatically released cells from that portion of the colony that were washed downstream for collection and PCR analysis to assess for expression of stem-cell markers. While a clever approach for sampling cells from a colony, the procedure required the development of large colonies (>1 mm) with each colony requiring its own channel, thus limiting throughput. The Allbritton group has described microarrays composed of two similar 3-dimensional elements termed micropallets or microcups for seeding single cells to establish clonal colonies that can then be collected with high viability to generate cell lines.31,32 The work with micropallets was extended by modification of the geometry to encourage expansion of colonies over a defined culture region created by multiple micropallets. By selectively removing one of the micropallets, colonies composed of as few as 4 cells could be effectively split for biochemical assays or continued expansion.33 Two limitations to this technique were that it was optimal for colonies composed of only a few cells and was best suited to cells that grow in a monolayer firmly attached to the micropallet.
The current work describes the use of a microengineered array to split and collect portions of clonal colonies at early times after plating of single-cell suspensions. This facility is particularly important for many stem cell colonies which grow loosely adherent to their substrate and in a spherical colony phenotype. Microcups for the growth and then subsequent splitting of murine ES cells were designed and optimized to enhance cell retention within a cup while still enabling splitting of a single colony. Microcup adhesion to the surface during cell culture and laser-based release was enhanced by surface modification to the glass substrate below the microcups. Microcup dimensions were varied with the goal of reducing the time in culture prior to the sampling procedure. The health and viability of both the portion of the colony retained on the array and the collected fractions within released microcups were evaluated. Optimization of the design of the microcups to increase the rate of colony expansion to adjacent microcups was also performed. The platform was used in a proof-of-principle experiment to demonstrate the ability to split colonies for identification of stably transfected cell lines by PCR analysis.
Materials and methods
Materials
UVI-6976 photoinitiator (triarylsulfonium hexafluoroantimonate salts in propylene carbonate) was purchased from Dow Chemical (Torrance, CA) and poly(dimethylsiloxane) (PDMS, Sylgard 184 silicone elastomer kit) was purchased from Dow Corning (Midland, MI). MCC primer, MF-319 developer and SU-8 developer (1-methoxy-2-propyl acetate) were obtained from MicroChem Corp. (Newton, MA). EPON resin 1001F and 1002F (phenyl, 4,4′-(1-methylethylidene)bis-, polymer with 2,2′-[(1-methylethylidene) bis(4,1-phenyleneoxymethylene]bis[oxirane]) were obtained from Miller-Stephenson (Sylmar, CA). γ-Butyrolactone (GBL) was from Sigma-Aldrich (St. Louis, MO). (Heptadecafluoro-1,1,2,2-tetrahydrodecyl) trichlorosilane was from Gelest Inc. (Morrisville, PA). NFR 106 D2 photoresist was from JSR Micro (Sunnyvale, CA). Glasgow minimum essential medium (GMEM), MEM nonessential amino acid, L-glutamine, MEM sodium pyruvate, penicillin/streptomycin, 1× phosphate buffered saline (PBS), 2-mercaptoethanol (1000×), and 0.05% trypsin with EDTA solution were obtained from Invitrogen (Carlsbad, CA). ES cell qualified fetal bovine serum (FBS), ES cell qualified 0.1% gelatin solution and leukemia inhibitory factor (LIF) at 107 U mL−1 were purchased from Millipore (Temecula, CA). Alkaline phosphatase Stem TAG™ CBA-300 kit was obtained from Cell Biolabs Inc. (San Diego, CA). Takara 10× Ex Taq Polymerase buffer was purchased from Clontech (Mountain View, CA) and 100 mM deoxyribonucleotide triphosphates (dNTPs) were purchased from Invitrogen (Carlsbad, CA). All other reagents were obtained from Fisher Scientific (Pittsburgh, PA).Formulation of 1001F photoresist and 1002F photoresist
1001F photoresist and 1002F photoresist were produced in house from three components: epoxy resin, solvent, and photoinitiator. The EPON epoxy resin (1001F or 1002F) was dissolved in GBL and was then mixed with the photoinitiator UVI-6976 at a ratio of 61![[thin space (1/6-em)]](https://www.rsc.org/images/entities/char_2009.gif) :32.9:6.1 (resin:solvent:photoinitiator, w/w/w).
:32.9:6.1 (resin:solvent:photoinitiator, w/w/w).Surface modification of the glass substrate
All glass slides were cleaned with acetone and treated with oxygen plasma for 10 min before use. For those treated with sulfuric acid, the cleaned slides were soaked in sulfuric acid (98%, certified ACS Plus) for 24 h, then rinsed with deionized water and baked on a hotplate at 120 °C for 2 h. Treatment of glass slides with the MCC primer was performed according to the manufacturer protocol. To deposit a patterned titanium coating on the glass, the photoresist NFR 016 D2 was spin-coated onto glass slides (WS-400B-6NPP/LITE, Laurell Technologies Corporation, North Wales, PA, 30 s at 2000 rpm). The coated slides were then soft baked in an oven at 95 °C for 20 min. After baking, the slides were slowly cooled to room temperature. The photoresist film was exposed to UV light through a photomask at 100 mJ cm−2 using a collimated UV source (Oriel Model #97435, Newport Stratford, Inc., Stratford, CT). The post-exposure bake was performed in an oven at 95 °C for 2 min. After slowly cooling to room temperature, the samples were developed in MF-319 developer, rinsed with DI water, dried in a stream of nitrogen and hard baked on 95 °C hotplate for 5 min. The samples were then sputter-coated with 0.5 nm titanium (Kurt Lesker PVD 75, Kurt J. Lesker Company, Pittsburgh, PA) and developed in acetone to remove the sacrificial photoresist layer.Fabrication of micropallet and microcup arrays
Micropallet arrays were fabricated as described previously.34 The arrays of square and hexagonal microcups were fabricated similarly to that described previously, but with the second photoresist layer forming the microcup walls composed of 1001F instead of 1002F.32 The initial layer forming the base of the microcups was fabricated using 1002F. After hard baking and cooling to room temperature, 1001F was spin-coated onto the layer of 1002F microstructures and the sample exposed to UV light through a photomask using a mask aligner UV source (MA-6, Karl Suss, Inc., Waterbury Center, VT). The post-exposure bake was performed at 120 °C for 6 min. After slow cooling to room temperature, the samples were developed in SU-8 developer, rinsed with 2-propanol, and dried in a stream of nitrogen. Micropallet arrays were composed of 10000 elements 60 μm × 60 μm × 50 μm (L × W × height, gap 40 μm) with a footprint of 1 cm × 1 cm. Arrays of square microcups were composed of 10000 elements that were either 50 μm × 50 μm × 45 μm (inner L × W × depth, gap 15 μm), or 100 μm × 100 μm × 45 μm, with footprints of 0.85 cm × 0.85 cm and 1.35 cm × 1.35 cm, respectively. Hexagonal microcup walls were 62.1 μm along the inner side with a height of 45 μm, and a wall thickness of 10 μm.After fabrication, the micropallet arrays were coated with a hydrophobic perfluoroalkylsilane layer ([heptadecafluoro-1,1,2,2-tetrahydrodecyl]trichlorosilane) as described previously to enable formation of a virtual wall.34,35 This air wall blocks cell attachment in the gaps between the pallets. The microcup arrays, which do not require virtual walls, were treated for 10 min in a plasma cleaner (Harrick Plasma, Ithaca, NY). For cell culture, a chamber around the array was created by using a ring of molded PDMS attached to the glass substrate.
Cell culture on micropallet and microcup arrays
Murine ES cells were cultured at 37 °C in a humidified 5% CO2 atmosphere. The micropallet and microcup arrays were sterilized by immersion in ethanol (75%) for 10 min and then dried under sterile conditions prior to cell plating and culture. Before use, 0.1% gelatin in water was added to the samples for 1 h to provide a permissive coating of extracellular matrix on the micropallets or microcups.36 Coated arrays were rinsed 5× with cell culture media prior to experiments. Cells were plated as single-cell suspensions on the arrays at a ratio of 1 cell to 10 micropallets or microcups.Laser-based release of micropallets and microcups
ES cells were cultured on the arrays until individual colonies expanded to occupy adjacent micropallets or microcups (see Results and discussion). Individual microstructures were released using a single pulse (5 ns, 532 nm) from a Nd:YAG laser (ACL-1, New Wave Research, Fremont, CA) focused at the interface of the glass substrate and base of the microstructure.37 The laser-release energy “ER” was defined as the minimal laser energy required to release the microstructure using a single laser pulse on 10 consecutive attempts in 3 independent experiments in the absence of cells. “ES” was defined in the same manner, but for microcups/pallets that possessed a cell colony spanning to a single adjacent microstructure. The ES variable reflected both the energy required to dislodge the microstructure as well as that to overcome cell–cell adhesion and divide the colony attached to the microstructures.Collection of colony samples
Released microstructures and their attached cells were collected as previously described.36 Briefly, a sterile multiwell array molded in PDMS was oxidized for 10 min in a plasma cleaner, sterilized by immersion in ethanol (75%) for 10 min and coated with 0.1% gelatin in water for 1 h. This multiwell array was mated to the cell array under sterile conditions to form an enclosed cassette filled with media. The cassette was placed on the stage of an upright microscope (Nikon Eclipse E800) with the Nd:YAG laser aligned through an optical port. The cassette was positioned so that the micropallet/microcup array was in an inverted orientation above the multiwell array. Micropallets/microcups released from the array settled by gravity into wells of the multiwell array. The arrays were then separated under sterile conditions and placed in a cell culture incubator.Assessment of cell differentiation
After release and collection, the cells on the microarray and multiwell array were returned to culture for 48 h. Cells were then stained for alkaline phosphatase, a standard means for assessing whether murine ES cells remain undifferentiated.38 A commercial assay for alkaline phosphatase expression (Stem TAG™ CBA-300 kit, Cell Biolabs, Inc., San Diego, CA) was used per manufacturer's instructions. After staining, the cell colonies were imaged with an inverted microscope (Nikon TE2000-U) equipped with a color CCD camera (Q-Color3, Olympus, Center Valley, PA) and the images generated using standard imaging software (QIMAGING Micropublisher 3.3, Surrey, BC, Canada).Determination of colony area
After splitting and collection, the areas of sampled colonies left on the array and the sampled portion were analyzed using standard image analysis software (ImageJ, http://rsbweb.nih.gov/ij/). Images of the cells were obtained 1 h and 48 h after colony splitting. The edges of the cell mass were outlined by hand to create a region of interest (ROI). The area was determined for the ROI and compared at the two time points for each colony and sample analyzed.Results and discussion
Splitting colonies
In order to split ES cell colonies, single-cell suspensions were plated on an array tested previously for splitting colonies that grow as a monolayer.33 This array was composed of repeating sites containing two micropallets over which colonies spread across a small intervening structure. This structure served two functions – as a bridge to enable cell expansion and as a cutting device to cleave the colony in preparation for sampling. ES cells plated on the array developed into thick, dome-shaped clusters typical of the colony morphology seen on standard culture dishes.36,39 After expansion over the 3-part culture site, the intervening structure was released using the pulsed laser with the intent of cleaving and segmenting the colony so that one of the two portions of the colony could then be released and collected. However, this approach was successful in only 25 ± 5% of attempts (n = 30). The majority of failures were either due to failure of the cleaving pallet to segment the colony, or the entire colony being dislodged upon the attempt at cleavage (Fig. 1A and B). | ||
| Fig. 1 Splitting of ES cell colonies on arrays of releasable microstructures. (A) ES cell colony before laser release on an array previously optimized for splitting colonies growing in a monolayer. The dimensions of the larger micropallets are 60 × 60 μm. (B) The same colony after an attempt to split the colony. The entire colony has become detached from the surfaces of the two larger micropallets upon release of the cleaving micropallet. (C) ES cell colony on a microcup array before laser release. The dimensions of the microcups are 100 × 100 μm, 10 μm wall width and 15 μm gap between the microcups. (D) The same colony as in “C” after release of one of the microcups. (E) The released and collected microcup with its sample of cells. | ||
The major factor limiting success in these experiments was the greater cell–cell adhesion relative to the cell–pallet adhesion. To increase the total adhesion of the cells to the pallet surface, the surface area of the cell–pallet contact was increased. Microstructures (microcups) with four walls for cell attachment to anchor the colony were designed. Murine ES cells cultured on the arrays for more than 5 days expanded over the microcup walls and extended into one or more adjacent microcups (Fig. 1C and D). Isolation and collection of a portion of the cells within the colony was then performed by laser release of one of the occupied microcups. The colony splitting success rate was 85 ± 5% (n = 30). The laser release energy required to split a colony was greater (ES = 15 μJ) than that required to release the microcups alone (ER = 6 μJ) and release of individual microcups with a colony fragment was often accompanied by dislodging nearby microcups. At lower release energies, individual microcups underneath a colony were dislodged from the substrate without dislodging adjacent microcups; however, the colony remained intact. Increasing the laser energy to 15 μJ enabled removal of a microcup and its cargo of cells by shearing the colony, but also dislodged nearby microcups. The high release energies increased the size of the cavitation bubble generated, which likely impinged on nearby cups.40 Furthermore, unlike the micropallet arrays with virtual air walls, no air was entrapped between microcups, thus the interface of the microcup base and glass substrate was in continual contact with aqueous media. Water immersion of 1002F photoresist films formed on glass surfaces results in detachment of the film from the surface.41 Thus, non-targeted microcup release was probably a result of the weakened 1002F-glass adhesion plus the greater laser release energies utilized.
Substrate surface and microcup release energy
To prevent the dislodging of multiple microcups with each laser pulse, a variety of surface treatments were evaluated to improve the adhesion between the microcup and glass slide. Three different surface treatments – cleaning with sulfuric acid, treating with MicroChem MCC primer, and implementing a base layer of titanium – were assessed. The MCC primer is a commercial product (MicroChem, Newton, MA) that is a pretreatment coating material for substrate surfaces to increase photoresist adhesion. Nordstrom et al. reported that SU-8 photoresist, a photoresist chemically related to 1002F, has increased bond strengths on certain metals, including titanium, when used in microfabrication.42 Therefore, titanium (0.5 μm thickness) was deposited on the standard glass surface (Fig. 2B and C). After substrate treatment or metal deposition, microcup arrays were then fabricated on the modified glass surface. The arrays were immersed in cell culture media and maintained in a tissue culture incubator. The release energy, ER, of the microcups was measured on a daily basis for 1 week, and again at day 12 (Fig. 2A). The ER for the MCC primer-treated glass substrate was similar to that of the unmodified glass surface. While arrays fabricated on the acid-cleaned and titanium-coated glass possessed an ER that dropped dramatically over the first 48 h of immersion, the ER subsequently stabilized at 13 ± 2 μJ and 15 ± 2 μJ for the acid-cleaned and for titanium-deposited glass, respectfully. The initial decline in release energy was likely the result of reduced adhesion of the 1002F after water immersion. The titanium-coating yielded the highest release energies, i.e. best adhesion, although too great a release energy could be detrimental to cell health.31,37 The arrays fabricated on the acid-cleaned and titanium-patterned glass substrates were then tested in the presence of ES129 stem cell colonies cultured on the arrays for 6 days. For both types of surface treatments, microcup release and colony splitting were accomplished without dislodging microcups adjacent to the target in 100 ± 0% of attempts (n = 3 arrays and 30 microcups for each type of surface treatment) with ES of 23 ± 2 μJ for the acid-cleaned substrate and 35 ± 4 μJ for the titanium-patterned glass substrates. The cells on the arrayed colonies and cell samples released from both types of substrates remained viable and undifferentiated at 48 h. The patterned titanium layer also possessed the advantage of providing a fiducial for precise laser focus at the desired “z” plane during release.40 To minimize ER and ES while providing a fiducial and achieving adequate and stable adhesion of the microcup to the glass, the area of the titanium layer in contact with the microcup was further decreased. Rather than a border of metal under the edge of the microcup, dots of titanium were placed at each of the four corners (Fig. 2B and C). This pattern also had the advantage of improving the quality of the brightfield image. With this design, ER and ES were reduced to 7.6 μJ and 19.2 μJ, respectfully, while still retaining adequate adhesion to prevent dislodging adjacent pallets during colony splitting (Fig. 2D).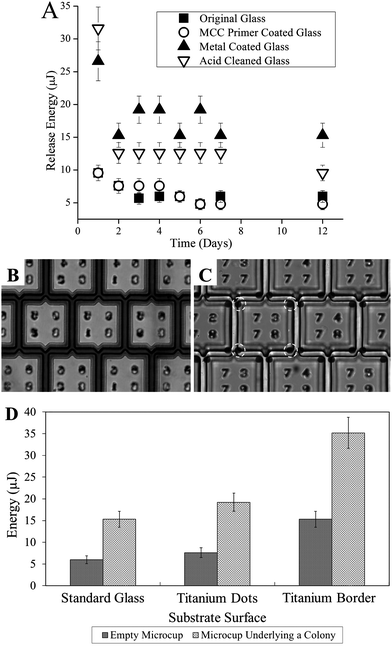 | ||
| Fig. 2 Surface modifications to improve microcup adhesion. (A) Change in ER of the microcups on the variously modified surfaces over a 12-day period immersed in media. (B) Microcups on titanium patterned surface. The metal is patterned to underlie the outside edges of the walls and cover the gaps between the microcups. (C) Microcups on titanium patterned surface in which the metal was deposited only at the four corners of the walls. (D) ER and ES for microcups on the modified surfaces without cells or containing cells from overlying colonies formed after 6 days in culture. The dimensions of the microcups in these experiments were 100 × 100 μm, 10 μm wall thickness, and 15 μm gap. | ||
Optimization of microcup dimensions
It is desirable that colonies span greater than one microcup quickly so that cell sampling can be performed as early as possible. To assess the impact of the microcup dimensions on the rate of colony growth, colony expansion was measured while varying the cup area and wall thickness, shape and design. Microcups with 10 μm walls, but differing in their inner dimensions (50 × 50 μm × 45 μm and 100 μm × 100 μm × 45 μm [L × W × D]) were evaluated. The cells were plated and cultured on the arrays and colony expansion was assessed daily. A colony was determined to be ready for sampling when the cells filled the initial microcup and extended to fill at least one-half of an adjacent microcup. For the smaller microcups, 91 ± 15% (n = 30) of colonies were satisfactory for sampling at 5 days (Fig. 3B). Microcups of 100 μm size supported larger colonies; however, colony expansion in the larger microcups required at least an additional 24 h to achieve a similar percentage of colonies ready for sampling. This time period corresponds to the predicted change in colony volume as a result of cell doubling. Assuming a cell volume of 1 pL (ref. 43) the 50 × 50 μm microcup will contain 113 cells when filled, while 450 cells are required to fill a 100 × 100 μm microcup. The doubling time for this cell line is approximately 12–18 h.44 The difference in cell number to fill 50 × 50 μm microcup and 100 × 100 μm microcup is approximately 2 doublings (∼24 h), which is consistent with the experimental results in which colonies fill a 50 × 50 μm microcup in 72–96 h and a 100 × 100 μm microcup in 96–120 h. | ||
| Fig. 3 Expansion of murine ES cell colonies on arrays with microcups of varying dimensions. (A) Colony expansion in microcups with 10 μm wall thickness and bases of 50 × 50 μm or 100 × 100 μm. (B) Colony expansion in 100 μm cups with wall thickness of 10, 15, or 20 μm, and hexagonal cups with 10 μm wall width possessing slits. | ||
Square microcups with inner dimensions of 100 μm × 100 μm × 45 μm (L × W × D) with wall thickness of 10, 15, and 20 μm were then tested. There was a direct correlation between the width of the microcup wall and the time required to achieve colonies ready for sampling (Fig. 3A). Under these conditions, 6 days were required to attain 88 ± 12% (n = 30) of colonies appropriate for sampling when the microcup walls were 10 μm, whereas only 51 ± 28% (n = 30) of colonies in the 20 μm walled microcups were ready for sampling by day 6. The thicker walls presented a barrier to cell growth into nearby cups. Hexagonal microcups were also tested for promoting colony outgrowth to multiple elements with reduction in the length of time needed to achieve colonies ready for sampling. Single cells plated into hexagonal microcups (inner side length 62.1 μm, height 45 μm, wall thickness 10 μm, area 104 μm2) showed nearly equivalent growth characteristics as the square microcups with 90 ± 7% of colonies being ready for sampling at day 6. To increase the rate of spread to adjacent microcups, hexagonal cups with 20 μm slits in each wall were fabricated (Fig. 4 and S1†). The slits were expected to provide direct routes for cells to spread without requiring the cup to fill with cells prior to colony extension. Colonies plated in these microcups were able to cross to nearby elements in as little as 4 days, but by 6 days the difference between the square and hexagonal cups was not significant.
 | ||
| Fig. 4 Isolation and expansion of cells expressing mCherry from a sampled colony. (A) A colony filling multiple microcups is identified 6 days after plating cells on an array of slit-walled hexagonal microcups. The brightfield image shows the colony filling 7 microcups. The refractile circular object on the left side of the image is an air bubble inside a cup. (B–D) After portions of the colony shown in “A” are sampled by release of 2 microcups, the colony continues to expand at 24 h (B) and 48 h (C) after the sampling procedure. (D) Fluorescence image of the colony at 48 h after sampling. (E) Paired brightfield and fluorescence images of a hexagonal microcup released and collected from a colony expressing mCherry on the day of collection (upper pair) and 48 h later (lower pair) showing the cells continue to expand after sampling. | ||
Impact of colony sampling on cell health
The impact of colony splitting on the health and viability of these cells was assessed by the ability of both the colony and the sample to continue to expand in culture and remain undifferentiated. After splitting and collection, both portions of the sampled colonies were returned to standard culture conditions where the colonies and their corresponding samples continued to expand (Fig. 4 and S2†). The area of individual colonies and the detached cell samples were determined at 1 h and 48 h after sampling. For the parent colonies, the ratio of the colony area at the two time points was 8.6 ± 2.3 (n = 12) while that for the cells collected from the released microcups was 1.3 ± 4.4 (n = 12) demonstrating that both colony portions continued to expand. Both the original colony and the sampled portion continued to display the expected phenotype for the undifferentiated embryonic stem cells—a dome-shaped cluster. The differences in expansion rates were likely the reflection of the differences in the size of the colonies as the sampled colonies were smaller and were placed in isolation from other colonies so that autocrine and paracrine factors known to stimulate growth were at lower concentrations. To confirm that the cells from both portions of sampled colonies remained undifferentiated, the colonies on the array and the sampled cells were evaluated for their differentiation status based on alkaline phosphatase expression. Of the colonies in which both colony and sample were followed over time (n = 24), 100 ± 0% of the colonies and their corresponding samples continued to express alkaline phosphatase indicating that they remained undifferentiated (Fig. 4D and E).36,38To test the arrays with an additional murine stem cell line, JM8.N4 cells were also cultured on the microcup arrays (100 μm × 100 μm × 45 μm × 10 μm [L × W × D × wall thickness]). The JM8.N4 colonies expanded on the arrays somewhat more quickly, but in a manner very similar to the ES129 cells with 100 ± 0% of colonies ready to split at day 6. The success of colony splitting using a laser energy of 27 ± 3 μJ per pulse was 100 ± 0% (n = 30). After colony sampling, expansion and differentiation of the collected colonies were evaluated (n = 2 independent experiments). All of the colonies collected (n = 14) expanded and remained undifferentiated. These data are consistent with prior work demonstrating the continued health and viability of cells after laser-based release and collection.31,36,45
Identification of target colonies for expansion
A proof-of-principle experiment to demonstrate the capability to split and assay individual colonies on the array was carried out using the slit hexagonal microcup array. ES129 cells (125000 cells per array, 6 arrays) were plated 48 h after electroporation in the presence of a plasmid carrying a neomycin (neo)-resistance selection marker as well as the gene for the fluorescent protein mCherry. Expression of these genes enabled comparison of the phenotype of cells on the array with PCR analyses performed on sampled portions of the colonies. The cells were cultured with LIF in G418-selection medium that was changed every other day to remove dead cells and replenish growth factors. The majority of colonies that appeared on the array were small and compact, only partially filling single microcups. Colonies of this phenotype generally failed to grow for more than a few days and regressed suggesting they were composed of cells that were not G418-resistant. At day 7, colonies that did continue to expand were imaged and scored for their fluorescence signature. Of those colonies that had filled multiple microcups, 33 ± 9% expressed mCherry, and 67 ± 9% were non-expressing. Eighteen of the mCherry-expressing colonies and two non-expressing colonies were sampled, collected and transferred to individual wells of a multi-well plate. The isolated colonies were expanded for an additional 12 days in the presence of G418. PCR was then carried out to compare the genetic signature of the colonies with their phenotypes. The G418-resistant phenotype indicated that the cells expressed the neomycin-resistance gene contained on the transfected plasmid. Nineteen out of 20 of the sampled colonies also scored positive by PCR analysis for the mCherry gene, confirming the presence of a larger portion of the transfected plasmid (Fig. 5). Interestingly, while a majority of the surviving mCherry-expressing colonies contained the mCherry gene present in the transfection plasmid, 5% of the sampled colonies demonstrated non-concordance in phenotype and genetic signatures. This likely occurred because the mCherry gene present in the transfected plasmid did not contain a promoter, such that mCherry expression in stable cells was dependent upon its insertion into an actively expressed gene in the genome. This was consistent with the observation that not all of the sampled colonies that contained the mCherry gene were positive for mCherry fluorescence (Fig. 5), and illustrates the value of combining phenotype with genetic analysis in identifying target colonies. Nonetheless, these experiments exemplified the ability to utilize microcup arrays to sample small colonies and identify stably transfected cell lines by a gene expression marker (mCherry expression) or destructive assay (PCR), either alone or in combination. | ||
| Fig. 5 PCR analysis of sampled colonies. PCR reactions performed with DNA lysates prepared from ES cell colonies were run on a 2% agarose gel stained with ethidium bromide. The arrow indicates migration of the 189 bp mCherry PCR product. Samples A1–C4 and E2–E5 were from colonies fluorescent for mCherry. Samples D2 and D3 were from colonies lacking mCherry expression. The non-transfected sample is from the parental 129 ES cell line. The sample designated “+ control” is a DNA sample from a previously generated ES cell line stabling expressing mCherry while the “− control” sample did not contain input DNA. | ||
Conclusions
An efficient microscale technique is demonstrated for sampling a microscopic colony and enabling aggregates of cells possessing high cell–cell adhesion to be split and the sample collected for further use. Such a sampling procedure would be useful in a genetic or biochemical assay to determine which colonies have a unique or desirable molecular characteristic so that the parent colony can be identified and collected for cell line generation. Improvements in this colony picking technique included the stability of microcup adhesion through the deposition of patterned titanium that also acted as fiducials to ease focusing of a laser pulse used to release individual array elements. The microcup dimensions were optimized in order to minimize the time in culture prior to the sampling procedure. The goal in this work was a reduction over conventional approaches in the time and labor required to expand, pick and split colonies. This issue is particularly important in the area of stem-cell biology for a number of reasons. The high-throughput efforts for creating genetically engineered mouse models currently require large numbers and volumes of media changes and include costly growth factors. In addition, a large number of steps are currently required to generate and identify clones possessing the appropriately modified gene of interest. The inefficiencies of these manipulations require cells to undergo high passage numbers which can have untoward effects in reducing the replicative potential of the cells. The technique described here can be used to establish and sample clonal colonies of rapidly dividing cells, such as murine ES cells while the colonies remain too small to pass by hand, thus reducing passage number required in achieving colonies of sufficient size for picking and splitting. The miniaturized platform also provides a culture vessel capable of supporting numerous colonies in a limited footprint. These time and size attributes will reduce the volume of media and growth factors required during colony expansion. The microarray of removable elements is amenable to automated imaging and laser-based release with the potential for hands-off robotic handling of the colonies. The implementation of this platform to sample cell colonies of various morphologic characteristics is expected to considerably reduce the time, manpower and costs imposed by conventional approaches for colony picking in stem-cell and other applications.Acknowledgements
This research was supported by the NIH (HG004843 and EB007612). The authors thank Yuli Wang and Wei Xu for technical advice. We thank Chapel Hill Analytical and Nanofabrication Laboratory (CHANL) for providing access to the facility's instrumentation.References
- A. W. Caron, C. Nicolas, B. Gaillet, I. Ba, M. Pinard, A. Garnier, B. Massie and R. Gilbert, BMC Biotechnol., 2009, 9, 42–53 CrossRef.
- P. Jones, A. Watson, M. Davies and S. Stubbings, Nucleic Acids Res., 1992, 20, 4599–4606 CrossRef CAS.
- K. Radosevic, J. S. A. Voerman, A. Hemmes, F. Muskens, L. Speleman, M. de Weers, J. G. M. Rosmalen, P. Knegt and W. van Ewijk, J. Immunol. Methods, 2003, 272, 219–233 CrossRef CAS.
- Y. Chen, S. Qiu, C.-H. Luan and M. Luo, BMC Biotechnol., 2007, 7, 45–59 CrossRef.
- J. S. Draper and A. Nagy, Handb. Exp. Pharmacol., 2007, 107–128 CrossRef CAS.
- S. Hatada, L. W. Arnold, T. Hatada, J. E. Cowhig, Jr, D. Ciavatta and O. Smithies, Proc. Natl. Acad. Sci. U. S. A., 2005, 102, 16357–16361 CrossRef CAS.
- C. Tong, G. Huang, C. Ashton, P. Li and Q.-L. Ying, Nat. Protoc., 2011, 6, 827–844 CrossRef CAS.
- D. Wu, B. Hamilton, C. Martin, Y. Gao, M. Ye and S. Yao, J. Visualized Exp., 2009, 8, 1553 Search PubMed.
- D. J. Kirkland, Br. J. Cancer, 1976, 34, 134–144 CrossRef CAS.
- N. Maeda, W. Fu, A. Ortin, M. de las Heras and H. Fan, J. Virol., 2005, 79, 4440–4450 CrossRef CAS.
- N. Maeda, Y. Inoshima, D. A. Fruman, S. M. Brachmann and H. Fan, J. Virol., 2003, 77, 9951–9959 CrossRef CAS.
- N. Maeda, M. Palmarini, C. Murgia and H. Fan, Proc. Natl. Acad. Sci. U. S. A., 2001, 98, 4449–4454 CrossRef CAS.
- D. M. Tompers and P. A. Labosky, Stem Cells, 2004, 22, 243–249 CrossRef.
- Culture of Mouse Embryonic Stem Cells, ed. G. Tremmi, M. Singer and R. Malavarca, Wiley, Hoboken, 2008 Search PubMed.
- R. I. Freshney, Culture of Animal Cells, Wiley-Liss, New York, 2000 Search PubMed.
- H. Lodish, A. Berk, C. A. Kaiser, M. Krieger, M. P. Scott, A. Bretscher, H. Ploegh and P. Matsudaira, Molecular Cell Biology, W.H. Freeman, New York, 2007 Search PubMed.
- A. Nagy, J. Rossant, R. Nagy, W. Abramow-Newerly and J. C. Roder, Proc. Natl. Acad. Sci. U. S. A., 1993, 90, 8424–8428 CrossRef CAS.
- G. Walter, K. Bussow, A. Lueking and J. Glokler, Trends Mol. Med., 2002, 8, 250–253 CrossRef CAS.
- D. C. Uber, J. M. Jaklevic, E. H. Theil, A. Lishanskaya and M. R. McNeely, BioTechniques, 1991, 11, 642–647 CAS.
- J. H. Smith, D. Madan, J. Salhaney and M. Engelstein, Current Protocols in Human Genetics, 2001, Appendix 2 Search PubMed.
- R. Huber, T. G. Palmen, N. Ryk, A. K. Hillmer, K. Luft, F. Kensy and J. Buchs, BMC Biotechnol., 2010, 10, 22–32 CrossRef.
- R. S. Ashton, J. Peltier, C. A. Fasano, A. O'neill, J. Leonard, S. Temple, D. V. Schaffer and R. S. Kane, Stem Cells, 2007, 25, 2928–2935 CrossRef CAS.
- M. Charnley, M. Textor, A. Khademhosseini and M. Lutolf, Integr. Biol., 2009, 1, 625–634 RSC.
- S. Lindstrom and H. Andersson-Svahn, Lab Chip, 2010, 10, 3363–3372 RSC.
- S. Lindstrom and H. Andersson-Svahn, Biochim. Biophys. Acta, Gen. Subj., 2011, 1810, 308–316 CrossRef.
- C. E. Sims and N. L. Allbritton, in Biological Applications of Microfluidics, ed. F. Gomez, Wiley, Hoboken, 2008, ch. 3, pp. 29–64 Search PubMed.
- D. Holmes and S. Gawad, Methods Mol. Biol., 2010, 583, 55–80 CAS.
- J. Y. Lee, C. Jones, M. A. Zern and A. Revzin, Anal. Chem., 2006, 78, 8305–8312 CrossRef CAS.
- H. Tekin, M. Anaya, M. D. Brigham, C. Nauman, R. Langer and A. Khademhosseini, Lab Chip, 2010, 10, 2411–2418 RSC.
- L. G. Villa-Diaz, Y. Torisawa, T. Uchida, J. Ding, N. C. Noguiera-de-Souza, K. S. O'Shea, S. Takayama and G. D. Smith, Lab Chip, 2009, 9, 1749–1755 RSC.
- Y. Wang, G. Young, M. Bachman, C. E. Sims, G. P. Li and N. L. Allbritton, Anal. Chem., 2007, 79, 2359–2366 CrossRef CAS.
- W. Xu, C. E. Sims and N. L. Allbritton, Anal. Chem., 2010, 82, 3161–3167 CrossRef CAS.
- W. Xu, A. Herman, C. Phillips, J. H. Pai, C. E. Sims and N. L. Allbritton, Anal. Chem., 2011, 83, 278–283 CrossRef CAS.
- Y. Wang, C. E. Sims, P. Marc, M. Bachman, G. P. Li and N. L. Allbritton, Langmuir, 2006, 22, 8257–8262 CrossRef CAS.
- Y. Wang, M. Bachman, C. E. Sims, G. P. Li and N. L. Allbritton, Anal. Chem., 2007, 79, 7104–7109 CrossRef CAS.
- H. Shadpour, C. E. Sims, R. J. Thresher and N. L. Allbritton, Cytometry, Part A, 2009, 75, 121–129 CrossRef.
- G. T. Salazar, Y. Wang, C. E. Sims, M. Bachman, G. P. Li and N. L. Allbritton, J. Biomed. Opt., 2008, 13, 034007 CrossRef.
- B. E. Reubinoff, M. F. Pera, C.-Y. Fong, A. Trounson and A. Bongso, Nat. Biotechnol., 2000, 18, 399–404 CrossRef CAS.
- J. Heo, J.-S. Lee, I.-S. Chu, Y. Takahama and S. S. Thorgeirsson, Biochem. Biophys. Res. Commun., 2005, 332, 1061–1069 CrossRef CAS.
- P. A. Quinto-Su, G. T. Salazar, C. E. Sims, N. L. Allbritton and V. Venugopalan, Anal. Chem., 2008, 80, 4675–4679 CrossRef CAS.
- Y. Wang, R. Dhopeshwarkar, R. Najdi, M. L. Waterman, C. E. Sims and N. Allbritton, Lab Chip, 2010, 10, 1596–1603 RSC.
- M. Nordstrom, A. Johansson, E. S. Nogueron, B. Clausen, M. Calleja and A. Boisen, Microelectron. Eng., 2005, 78–79, 152–157 CrossRef.
- K. K. Frame and W.-S. Hu, Biotechnol. Bioeng., 1990, 36, 191–197 CrossRef CAS.
- Y. Ito, M. Kawamorita, T. Yamabe, T. Kiyono and K. Miyamoto, J. Biosci. Bioeng., 2007, 103, 113–121 CrossRef CAS.
- H. Ma, W. Mismar, Y. Wang, D. W. Small, M. Ras, N. L. Allbritton, C. E. Sims and V. Venugopalan, J. R. Soc., Interface, 2012, 9, 1156–1167 CrossRef CAS.
Footnote |
| † Electronic supplementary information (ESI) available. See DOI: 10.1039/c2an36065a |
| This journal is © The Royal Society of Chemistry 2013 |