 Open Access Article
Creative Commons Attribution 3.0 Unported Licence
Absolute electrostatic force between two charged particles in a low dielectric solvent
A. J.
Stace
and
E.
Bichoutskaia
Department of Physical and Theoretical Chemistry, School of Chemistry, University of Nottingham, University Park, Nottingham NG7 2RD, U.K.
First published on 14th May 2012
Abstract
It is shown that a recently developed analytical solution to the problem of how two charged particles of a dielectric material interact with one another, gives excellent quantitative agreement with experimental measurements of the force between pairs of charged particles in a non-polar solvent. The theory shows how the presence of a dynamic surface charge distribution may moderate the repulsion between interacting particles, and allow them to accommodate more charge than would be estimated from a calculation of the bare Coulomb force.
Recent experiments on charged particles have focused attention on how they may be stabilised in solvents with very low dielectric constants;1–4 an environment that would not normally be expected to support isolated charged species. This interest in the behaviour of charged particles in non-polar solvents has come about in response to recent technological developments in such areas as electrostatic toners,5 electrophoretic displays,6 and drug delivery,7 where performance depends critically on the ability to control particle charge and motion. To facilitate the presence of a charge, various methods, including the use of surfactants and the incorporation of ionic groups, have been used to give particles a permanent surface charge.1,2,8 For a quantitative interpretation of the resultant electrostatic interaction, classical approximations in the form of Derjaguin, Landua, Verwey, and Overbeek (DLVO) theory and Poisson–Boltzmann theory provide good descriptions for as long as certain limiting conditions are recognised.9 However, both theories include adjustable parameters that are often modified to match the prevailing environment. For the specific example of charged dielectric particles suspended in a vacuum or a non-ionic medium, it is only very recently that analytical methods have become available for performing accurate calculations on the electrostatic forces present when two such particles interact with one another.10,11 Many earlier attempts to solve this problem provided solutions that either failed to converge or were only stable if one of the particles remained neutral (see ref. 10 for a summary of previous work).
In 2010 Bichoutskaia et al. presented an analytical solution to the problem of how charged dielectric particles interact with one another.10 The equations were shown to converge rapidly, and the solution was found to be stable up to the point where particles touch. The model can be applied to particles suspended in any non-ionic medium and calculations show the degree of interaction between particles to be very sensitive to the values of charge, size and dielectric constant. The electrostatic force due to the presence of a permanent charge residing on the surface of each of two interacting spherical particles is given in ref. 10 as a generalization of Coulomb's law for point charges:
 | (1) |
A rigorous test of the validity of the model outlined above requires high quality experimental data that have been recorded under conditions which match those specified in the derivation, i.e. dielectric particles carrying a surface charge and interacting in a non-ionic medium. Using the optical tweezer technique,15 Sainis et al. have recorded experimental data of this nature with their measurements of the electrostatic force between charged microspheres suspended in non-polar solvents.1,2,16 Of relevance to this work are their measurements of the force between poly-methyl methacrylate (PMMA) spheres suspended in hexadecane, which also contains a variable concentration of sodium-aerosol-OT (AOT) that acts as a charge control agent. In this paper we demonstrate that the derivation presented earlier is capable of accurately reproducing these data without the need for any adjustable parameters.10,12 Input to the calculations are the dielectric constants for the PMMA spheres (k1 = k2 = 2.6), their radii (a1 = a2 = 600 nm), the dielectric constant for hexadecane (ε/ε0 = 2.06) and the magnitude of the charge residing on the surface of each sphere. The charge is not known from any direct experimental measurement; however, in the study by Sainis et al.2 this was one of the variables adjusted within DLVO theory until there was a match with the experimental data. The same approach has been adopted here, with the charge on both spheres Q1 = Q2 being altered to achieve agreement with the knowledge that the previous DLVO calculations provide some indication of the value.2
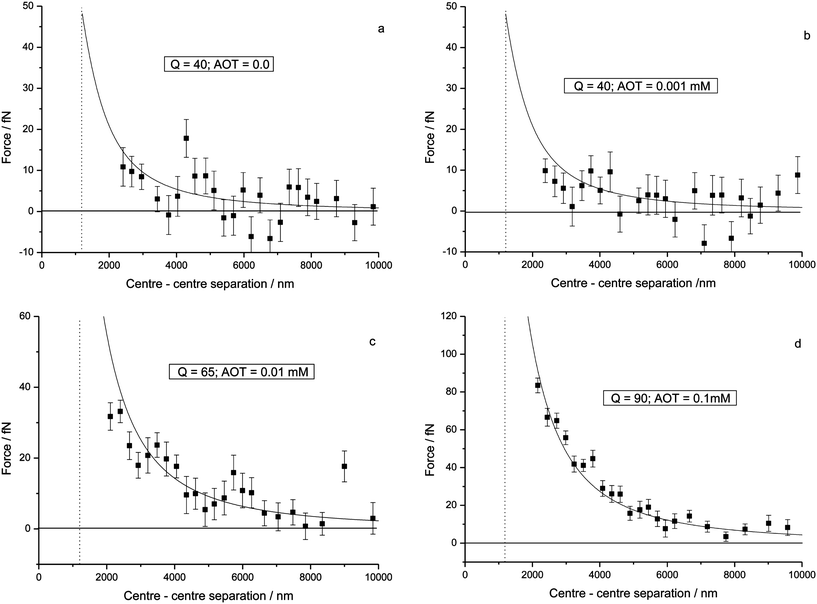
Fig. 1 (a)–(d) show plots of the electrostatic force between pairs of PMMA particles as measured in the experiments by Sanis et al.2 under conditions where the strength of the charge control agent, AOT, is gradually increased. However, as noted by Sanis et al.2 the AOT concentrations were such that the calculated Debye screening lengths (1/κ) remained much larger that the radii of the particles (κa ≪ 1). The experimental force data are plotted as a function of centre to centre separation distance between the spheres with the vertical line indicating where they should touch. Also plotted in Fig. 1 is the calculated electrostatic force between the two particles,10,12 and as can be seen, the agreement between experiment and theory across the four data sets is for the most part good, and could be considered as excellent for Fig. 1c and 1d. The calculations do not include any weak attractive contribution to the force that may arise from a van der Waals interaction.
 | ||
| Fig. 1 Comparison between experimental measurements of the force between two charged PMMA spheres and results calculated from a solution to eqn (1). The forces are given in femto-Newtons and are plotted as a function of the separation distance between the centers of the two spheres. The vertical line denotes the point of contact. Identified in Fig. 1a–1d are the charge Q given by the calculations and AOT concentration at which the experiments were performed. | ||
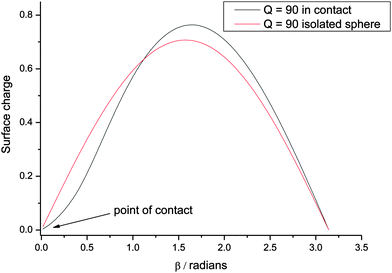
Calculation of the force associates each particle with a dynamic surface charge that can be displaced in response to the strength of the electrostatic interaction and the separation between the spheres.17Fig. 2 shows how the charge density changes across the surface of one of the spheres at the point of contact (as the results are equivalent, they are given for just one sphere). The quantity that has been plotted is 2πa2sin(β)σ(β), where β is a spherical polar coordinate that spans from 0 to 180 degrees through the sphere and β = 0 is the point of contact. σ is the charge density at a point on the surface defined by β and in the form given above, σ at each point has been weighted by an element of surface area. For the purposes of comparison, the equivalent plot for an isolated sphere is also given in Fig. 2. As can be seen, the surface charge density responds to the close proximity of a second charged sphere by becoming displaced away from the point of contact. A net effect of this displacement would be to reduce the magnitude of the repulsion experienced by the spheres with respect to that determined from a simple Coulomb law, with a possible outcome being that the spheres are able to accommodate more charge than would be apparent from a direct fit to the latter. This effect can in fact be seen from Table 1 where a comparison is given between the results calculated here and those calculated by Sanis et al.2 For the data in Fig. 1a–1d the experimental results have been fitted to a bare Coulomb repulsion, and so. for example, at an AOT concentration of 0.1 mM (Fig. 1d), Sanis et al.2 estimate the effective charge on each sphere to be ∼75 e, whereas this calculation yields a charge of 90 e. Similar enhancements in Q are to be seen for AOT concentrations of 0.001 and 0.01 mM. The experimental results also suggest that the particles carry a residual charge when the concentration of the charge control agent is zero, and the fit in Fig. 1a would confirm that. However, Q at 40 e is again larger than the 23 ± 3 e estimated from a Coulomb law fit to the data.2 Previous calculations of the surface charge have shown how subtle changes in the distribution can switch the electrostatic interaction between like-charged particles from being repulsive to attractive.17
 | ||
| Fig. 2 Plot of the calculated distribution of surface charge density on a PMMA sphere when two equivalent spheres, each with a charge Q = 90 e, are in contact. The density is plotted as a function the polar angle β17 and for reference purposes the equivalent result for an isolated sphere is also given. | ||
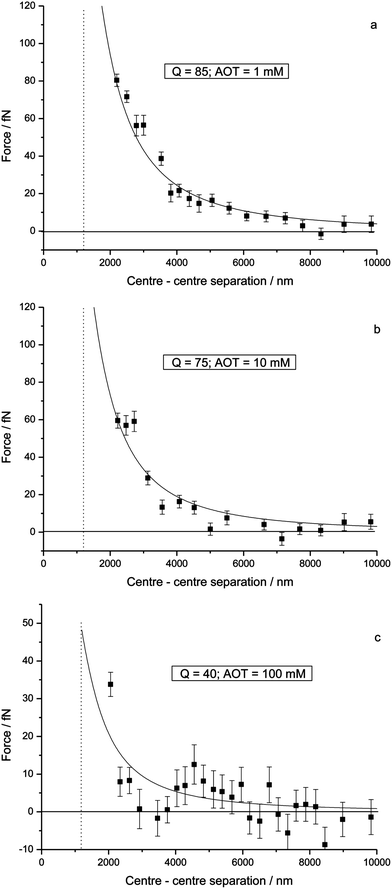
At AOT concentrations higher than those discussed above, the results from Sanis et al.2 suggest that charge screening becomes more significant as their calculations show that κa is now ∼ 1. This effect is also evident from Fig. 3a–3c where the electrostatic force has been calculated to fit data where the AOT concentrations are in the range 1–100 mM. These results together with Table 1 show that, as the concentration increases, the effective charge gradually declines, which is probably not what is happening in reality, but is a reflection of the fact that screening diminishes the magnitude of the electrostatic repulsion. It is also evident that the fits to the data are no longer uniform as function of the distance of separation, which would imply an alternative power dependence to that of the multipole expansion derived for two charged spheres. As can be seen from Table 1, the fit to data recorded at the highest AOT concentration (100 mM) is not consistent with the trend exhibited by the other results where Q is always greater than Z*. The fit to the experimental data provided by the analytical model10,11 is adequate and matches the trend in Q shown by results at lower AOT concentrations; however, the scatter in the experimental data is sufficient to allow for alternative combinations of parameters from DVLO theory.2
 | ||
| Fig. 3 Comparison between experimental measurements of the force between two charged PMMA spheres and results calculated from a solution to eqn (1). The forces are given in femto-Newtons (fN) and are plotted as a function of the separation distance between the centers of the two spheres. The vertical line denotes the point of contact. Identified in Fig. 1a–1d are the charge Q given by the calculations and AOT concentration at which the experiments were performed. | ||
Under conditions of very low ionic strength recent experiments have measured a repulsive Coulomb force between dielectric particles carrying a charge. It has been shown here that an analytical solution to the problem of calculating such a force yields excellent agreement with the experimental results without the need for adjustable parameters. The results show that a dynamic response from surface charge to the presence of a second body is an integral part of the theory's success in accounting for the experimental data. An accurate description of the electrostatic forces between charged particles will contribute towards a better understanding of their static and dynamic properties.
The authors would like to thank Prof. E. R. Dufresne for making available the data from his experiments. EB gratefully acknowledges financial support from an EPSRC-GB Career Acceleration Fellowship (EP/G005060).
References
- S. K. Sainis, et al. , Phys. Rev. Lett., 2007, 99, 018303 CrossRef.
- S. K. Sainis, et al. , Langmuir, 2008, 24, 1160 CrossRef CAS; S. K. Sainis, et al. , Langmuir, 2008, 24, 13334 CrossRef.
- C. E. Espinosa, et al. , Langmuir, 2010, 26, 16941 CrossRef CAS.
- D. El Masri, et al. , Soft Matter, 2011, 7, 3462 RSC.
- K. Pearlstine, et al. , J. Imaging Sci., 1991, 35, 55 CAS.
- B. Comiskey, et al. , Nature, 1998, 394, 253 CrossRef CAS.
- S. A. Jones, et al. , J. Pharm. Sci., 2006, 95, 1060 CrossRef CAS.
- R. Sáchez and P. Bartlett, Soft Matter, 2011, 7, 887 RSC.
- J. N. Israelachvili, Intermolecular and Surface Forces, Academic Press, New York, 1998 Search PubMed.
- E. Bichoutskaia, et al. , J. Chem. Phys., 2010, 133, 024105 CrossRef.
- P. Linse, J. Chem. Phys., 2008, 128, 21405 CrossRef.
- A. J. Stace and E. Bichoutskaia, Phys. Chem. Chem. Phys., 2011, 13, 18339 RSC.
- H. T. Ochs III and R. R. Czys, Nature, 1987, 327, 606 CrossRef.
- M. K. Mazumder, et al. , Chem. Eng. Sci., 2006, 61, 2192 CrossRef CAS.
- J. C. Crocker and D. G. Grier, Phys. Rev. Lett., 1994, 73, 352 CrossRef CAS.
- J. W. Merrill, et al. , Phys. Rev. Lett., 2009, 103, 138301 CrossRef.
- A. J. Stace, et al. , J. Colloid Interface Sci., 2011, 354, 417 CrossRef CAS ; there is a typographical error in this paper where the expression for an element of surface area should read as: 2π a2sin(β) σ(β).
| This journal is © The Royal Society of Chemistry 2012 |
