Chemical transformations of Populus trichocarpa during dilute acid pretreatment
Shilin
Cao†
ae,
Yunqiao
Pu
*be,
Michael
Studer‡
ce,
Charles
Wyman
cde and
Arthur J.
Ragauskas
*abe
aSchool of Chemistry and Biochemistry, Georgia Institute of Technology, Atlanta, GA, USA. E-mail: arthur.ragauskas@chemistry.gatech.edu; Fax: +1 (404) 894-4778; Tel: +1 (404) 894-9701
bInstitute of Paper Science and Technology, Georgia Institute of Technology, Atlanta, GA, USA. E-mail: yunqiao.pu@ipst.gatech.edu
cCenter for Environmental Research and Technology, Bourns College of Engineering, University of California, Riverside, CA, USA
dChemical and Environmental Engineering Department, Bourns College of Engineering, University of California, Riverside, CA, USA
eBioEnergy Science Center, Oak Ridge, TN, USA
First published on 4th October 2012
Abstract
In this study, Populus trichocarpa was subjected to dilute acid pretreatment at varying pretreatment times. The three major components of lignocellulosic biomass, namely cellulose, hemicellulose and lignin, were isolated from the starting and dilute acid pretreated poplar. Gel permeation chromatography (GPC) and nuclear magnetic resonance (NMR) techniques were utilized to elucidate structural transformations of poplar during dilute acid pretreatment. The results demonstrated that the pretreatment dissolved hemicelluloses and disrupted structural features of lignin and polysaccharides. As revealed by NMR, the aryl-O-ether linkage (β-O-4) of lignin was extensively cleaved and lignin repolymerization occurred during pretreatment. The lignin was also observed to have a decrease in S/G ratio and methoxyl group content and these changes were accompanied with an increase in condensed lignin. The dilute acid pretreatment resulted in a reduction in molecular weight of cellulose and hemicellulose, while no prominent change of molecular weight was observed for lignin. The polydispersity index of cellulose appeared to increase initially within a short time of pretreatment (0.3–1 min) and start to decrease with longer pretreatment time during the bulk phase of chain scission (5.4–26.8 min). The DA pretreatment demonstrated no significant impact on the crystalline index (CrI) of cellulose particularly within the short time range of pretreatments examined in this study, with CrI remaining almost unchanged during the pretreatment time of 0.3–5.4 min and a slight increase observed as the pretreatment time extended to 8.5 and 26.8 min.
1. Introduction
Increasing concerns about diminishing fossil fuel resources and energy security have spurred a renaissance in the development of renewable and sustainable energy options. The utilization of non-food lignocellulosic biomass, such as woody and herbaceous plants as well as agricultural residues, for the production of fuels, chemicals and materials has become a global research theme and will undoubtedly play an important role in our future energy portfolio.1,2 Currently, the biological route to produce biofuels from plant biomass is largely contingent on the efficient hydrolysis of plant polysaccharides to monosaccharides, which are subsequently fermented to biofuels like ethanol. One of the greatest processing challenges for the biological production of cellulosic ethanol is to develop efficient and cost-competitive technologies that enable the release of sugars ‘locked in’ the intricacy of cell wall macromolecular structures.3,4Lignocellulosic biomass has a complex and rigid cell wall structure which consists of three principal biopolymers, namely cellulose, hemicellulose, and lignin.4,5 Cellulose is a linear chain homopolymer consisting of (1→4)-β-D-glucopyranosyl units with a varying degree of polymerization (DP) with a tendency to form intra- and inter-molecular hydrogen bonds through hydroxyl groups on glucan chains. Hemicellulose is a broad class of mixed heteroglycans of pentoses and hexanoses which are linked together and frequently have branching and substitution groups. Lignin is an irregular polyphenolic biopolymer constructed of phenylpropanoid monomers with various degrees of methoxylation which is biosynthesized into a complex, racemic, cross-linked and highly heterogeneous aromatic macromolecule. The plant cell wall microstructure is believed to exist as a lignin and polysaccharides matrix in which they are associated intimately together.5 The structural complexity and unique chemical and physical properties of plant cell walls cause plant biomass to be recalcitrant to biological and chemical degradation. To date, a pretreatment that can effectively reduce biomass recalcitrance is generally required as the first step for the biological conversion of lignocellulosic biomass to biofuels.6–8 The objective of pretreatment is to structurally alter the cell walls of plant biomass, thus rendering the polysaccharides fraction (cellulose and hemicelluloses) more accessible/amenable to hydrolytic enzymes. The pretreatment stage is considered to be among the most costly processes and has a significant impact on the efficiency of enzymatic hydrolysis and subsequent fermentation.9,10 Therefore, research interest has been focused on developing viable pretreatment technologies and optimizing pretreatment conditions as well as understanding the fundamental principles that contribute to the reduced recalcitrance with pretreatment. Understanding the chemical transformations of the lignocellulosic biomass during pretreatment and their structural features that remain after pretreatment will provide important insights into the mechanism of overcoming biomass recalcitrance, which can help improve biomass pretreatment processes for the viable production of cellulosic bioethanol.
Dilute acid (DA) pretreatment is considered to be one of the leading pretreatment technologies and has been extensively studied as a pre-hydrolysis method that is particularly effective with hardwoods. DA pretreatment involves the treatment of biomass with a combination of a controlled acidic pH, heat and pressure.11–13 Typically, DA pretreatment is carried out using 0.4–2.0% (w/w) H2SO4 at a temperature of 160–220 °C. It has been reported that DA pretreatment not only solubilizes hemicellulose, but also causes structural transformation of other biomass components, namely cellulose and lignin. Structural features such as cellulose DP and crystallinity index are widely regarded among key characteristics that affect cellulose enzymatic hydrolysis performance and their changes upon pretreatment has been proposed to relate to the reduction of biomass recalcitrance.7,8 In addition, several studies have indicated that the breakdown and loosening of the lignocellulosic structure by dilute acid pretreatment increases the pore volume and pore size of the biomass, thus in turn increasing cellulose accessibility to cellulase which is suggested as a key factor governing enzymatic hydrolysis rates and extents.14–16 Lignin was observed to remain on the surface of cellulose after DA pretreatment which hinders the subsequent enzymatic hydrolysis.17,18 The structural alterations of lignocellulosic biomass after dilute acid pretreatment have attracted considerable research efforts in the past for several biomass resources such as corn stover, Loblolly pine and switchgrass.19–23 For example, Sannigrahi et al.20 reported an increase in condensed lignin structural units and an increase in the degree of crystallinity of cellulose after a two-stage dilute acid pretreatment of Loblolly pine. Similarly, Shuai et al.21 observed a condensation of lignin structure in spruce after dilute acid pretreatment. Samuel et al.22 demonstrated that dilute acid pretreatment led to a decrease of β-O-4 linkages in switchgrass lignin. Foston and Ragauskas24 investigated the effects of dilute acid pretreatment on supramolecular structure of poplar cellulose and observed an increase of lateral fibril dimension and an increase in relative proportion of para-crystalline form which was partly attributed to crystal-to-crystal type of transformation in cellulose ultrastructure. While these studies provided important insights into the structural changes of cellulose or lignin for these lignocellulosics, most of these studies were performed on the basis of comparison of the control and pretreated biomass with a fixed dilute acid pretreatment severity, or focused on the structural information of one individual fractionation component. The effects of dilute acid pretreatment on structural transformations of all three principal components (i.e., cellulose, hemicellulose and lignin) of poplar, one of the front-runners as lignocellulosic feedstock for production of biofuels and biomaterials, over the process of DA pretreatment with variable severities remain yet to be investigated.
In this study, Populus trichocarpa was subjected to dilute acid pretreatment at varying pretreatment times. Cellulose, hemicellulose and lignin were isolated from the control and pretreated poplar, respectively. The isolated biopolymers were characterized with gel permeation chromatography and nuclear magnetic resonance techniques with comparison of the data from pretreated poplars to that of the untreated poplar. This study documents a detailed elucidation of chemical structures of poplar during the course of DA pretreatment and provides a more complete picture of structural transformations of principal poplar components in this process.
2. Materials and methods
2.1 Materials
A genotype of Populus trichocarpa grown at the Oak Ridge National Laboratory, TN, was used for all experiments in this study. The logs were debarked, split with an axe, chipped (Yard Machines 10HP, MTD Products Inc., Cleveland, OH), and knife milled (Model 4 Wiley Mill, Thomas Scientific, Swedesboro, NJ) through a 1 mm screen size. The wood feedstock was air dried at National Renewable Energy Laboratory, CO for approximately one month (about 5% moisture content). All the material was then sieved to collect the fractions between 0.18 mm and 0.85 mm (Ro-Tap RX-29, Mentor, OH). The milled poplar feedstock was stored in a freezer at −5 °C until analysis. The extracts in poplar were removed by extraction with ethanol![[thin space (1/6-em)]](https://www.rsc.org/images/entities/char_2009.gif) :
:![[thin space (1/6-em)]](https://www.rsc.org/images/entities/char_2009.gif) toluene (1
toluene (1![[thin space (1/6-em)]](https://www.rsc.org/images/entities/char_2009.gif) :
:![[thin space (1/6-em)]](https://www.rsc.org/images/entities/char_2009.gif) 2, v/v) for 24 h in a Soxhlet apparatus before analysis.
2, v/v) for 24 h in a Soxhlet apparatus before analysis.
All chemical reagents used in this study were purchased either from VWR International or Aldrich and used as received, with the exception of p-dioxane which was distilled over NaBH4 prior to being used.
2.2 Dilute acid pretreatment
Poplar (solid loading 5% w/w) was treated using dilute sulfuric acid (0.5% w/w) at a temperature of 170 °C with residence times ranging from 0.3–26.8 min. In order to prevent substantial degradation of carbohydrates generating furfural and hydroxymethylfurfural with the extended pretreatment time, the reaction time periods of 0.3–26.8 min were selected in this study as the maximized total sugar (i.e. glucose and xylose) recovery was achieved around 5.0–8 min. Pretreatments were conducted in a stirred tank reactor (1.0 L) made of Hastelloy (4520 Series, Parr Instruments, Moline, IL), equipped with a double stacked pitch blade impeller (∅ = 50 mm). The stirring speed was set to 100 rpm, and the agitator rotated in a direction that pushed the biomass downward. The reactor was heated in a fluidized sand bath, in which the temperature was set to 400 °C. The target temperature was maintained by floating the reactor a small distance above the undulating surface of the sand bath. The reactor was held at the pretreatment temperature for the specified residence time ±5 s (0.3, 1.1, 5.4, 8.5, 26.8 min). At the completion of the pretreatment the reactor was cooled to 80 °C by submerging the reactor in a cold water bath. The pretreated slurry was then vacuum filtered through filter paper (Whatman No. 4, Fisher Scientific, U.S.) and the solids were washed with deionized water.2.3 Compositional analysis of starting and pretreated poplar
The compositional analysis of the starting and the DA pretreated poplar were determined according to literature methods.25,26 In brief, extractive-free poplar samples were hydrolyzed with sulfuric acid (72% w/w) for 1 h and then autoclaved at 121 °C for additional 1 h after diluting with the addition of water (4% w/w sulfuric acid). The autoclaved samples were filtered and the residues were washed, dried and weighed to give Klason lignin content. Monosaccharide contents in the filtrate were quantified using high performance anion exchange chromatography with pulsed amperometric detection (Dionex ICS 3000, Dionex Corp., Sunnyvale, CA). These measurements were performed in duplicate and the results were reported as the average.2.4 Cellulose and hemicellulose isolation
Holocellulose (a mixture of cellulose and hemicellulose) was isolated from the extractives-free starting and pretreated poplar samples according to literature procedures with a mixture of acetic acid and sodium chlorite at 70 °C for 1 h.26,27 The process was repeated until the samples have a low Klason lignin content (<2%). α-Cellulose and acid-purified cellulose samples from poplar were used for molecular weight distribution analysis and crystallinity index analysis, respectively. Both samples were prepared from holocellulose pulp following a literature procedure.27 The acid-purified cellulose was isolated by refluxing a holocellulose sample (∼0.5 g of dry weight) in an HCl solution (50 mL, 2.5 M) for 4 h in order to remove the hemicelluloses and the resulted cellulose samples were subjected to solid state NMR characterization. α-Cellulose was prepared using NaOH (17.5% w/w) to remove hemicellulose from holocellulose and stored for molecular weight distribution analysis.Poplar hemicelluloses were isolated from holocellulose samples according to literature procedure for molecular weight analysis.28 In brief, the holocellulose was extracted with KOH (24% w/w) at room temperature for 24 h. The mixture was filtered and the filtrate was poured into a mixture of ethanol-acetic acid (70![[thin space (1/6-em)]](https://www.rsc.org/images/entities/char_2009.gif) :
:![[thin space (1/6-em)]](https://www.rsc.org/images/entities/char_2009.gif) 30, v/v). The supernatant was removed by centrifugation, and the precipitated hemicellulose (yield > 85%) was washed with a mixture of ethanol–acetic acid (70
30, v/v). The supernatant was removed by centrifugation, and the precipitated hemicellulose (yield > 85%) was washed with a mixture of ethanol–acetic acid (70![[thin space (1/6-em)]](https://www.rsc.org/images/entities/char_2009.gif) :
:![[thin space (1/6-em)]](https://www.rsc.org/images/entities/char_2009.gif) 30, v/v) and air-dried for analysis.
30, v/v) and air-dried for analysis.
2.5 Lignin isolation
Poplar lignin was isolated from the starting and the DA pretreated poplar according to the literature methods.29,30 Briefly, the extractive-free poplar was placed in a porcelain ball mill jar, along with porcelain grinding media and ground in a rotary ball mill for 120 h under an inert (nitrogen) atmosphere. The ground poplar powder was enzymatically treated using cellulase and then extracted with p-dioxane: water (96![[thin space (1/6-em)]](https://www.rsc.org/images/entities/char_2009.gif) :
:![[thin space (1/6-em)]](https://www.rsc.org/images/entities/char_2009.gif) 4, v/v) solution. The lignin extracts were centrifuged, freeze-dried and purified with the yield of purified lignin being ∼12% per Klason lignin for unpretreated poplar and ∼20–30% for pretreated poplar.
4, v/v) solution. The lignin extracts were centrifuged, freeze-dried and purified with the yield of purified lignin being ∼12% per Klason lignin for unpretreated poplar and ∼20–30% for pretreated poplar.
2.6 Gel permeation chromatography (GPC) analysis
![[thin space (1/6-em)]](https://www.rsc.org/images/entities/char_2009.gif) :
:![[thin space (1/6-em)]](https://www.rsc.org/images/entities/char_2009.gif) 30, v/v) followed by filtration through a membrane filter (pore size 0.45 μm). The sample was washed using a methanol/water solution (30.0 mL × 3) and deionized water (30.0 mL × 3). The tricarbanilated α-cellulose was air dried and then vacuum dried at 40 °C overnight. The dried tricarbanilated α-cellulose was dissolved in tetrahydrofuran (THF) (1.00 mg mL−1), filtered through a 0.45 μm filter and injected into a GPC SECurity Agilent HPLC 1200 (a PSS-Polymer Standards Service, Warwick, RI, USA). The column used was four 300 mm × 7.8 mm i.d. Waters Styragel columns (HR1, HR2, HR4, HR6). Agilent UV detector was used at 270 nm. Tetrahydrofuran was used as the mobile phase and the flow rate was 1.0 ml min−1. The weight-average molecular weight (Mw) and number-average molecular weight (Mn) values were determined using a calibration curve based on narrow polystyrene standards. The weight-average degree of polymerization (DPw) was calculated by dividing the weight-average molecular weight of tricarbanilated α-cellulose by 519. Data collection and processing was achieved using Polymer Standards Service WinGPC Unity software.
30, v/v) followed by filtration through a membrane filter (pore size 0.45 μm). The sample was washed using a methanol/water solution (30.0 mL × 3) and deionized water (30.0 mL × 3). The tricarbanilated α-cellulose was air dried and then vacuum dried at 40 °C overnight. The dried tricarbanilated α-cellulose was dissolved in tetrahydrofuran (THF) (1.00 mg mL−1), filtered through a 0.45 μm filter and injected into a GPC SECurity Agilent HPLC 1200 (a PSS-Polymer Standards Service, Warwick, RI, USA). The column used was four 300 mm × 7.8 mm i.d. Waters Styragel columns (HR1, HR2, HR4, HR6). Agilent UV detector was used at 270 nm. Tetrahydrofuran was used as the mobile phase and the flow rate was 1.0 ml min−1. The weight-average molecular weight (Mw) and number-average molecular weight (Mn) values were determined using a calibration curve based on narrow polystyrene standards. The weight-average degree of polymerization (DPw) was calculated by dividing the weight-average molecular weight of tricarbanilated α-cellulose by 519. Data collection and processing was achieved using Polymer Standards Service WinGPC Unity software.
 | ||
| Fig. 1 Representative images of isolated lignin, cellulose and hemicellulose from diluted acid pretreated poplar (pretreatment at 26.8 min). a: lignin; b: cellulose; c: hemicellulose. | ||
![[thin space (1/6-em)]](https://www.rsc.org/images/entities/char_2009.gif) :
:![[thin space (1/6-em)]](https://www.rsc.org/images/entities/char_2009.gif) 1 v/v, 2.0 mL) and stirred at room temperature for 24 h. Ethanol (25.0 mL) was added to the reaction mixture, left for 30 min and removed with a rotary evaporator. The addition and removal of ethanol was repeated until trace of acetic acid was removed from the sample. The residue was dissolved in chloroform (2.0 mL) and precipitated with diethyl ether (100.0 mL). The precipitate was centrifuged, washed thrice with diethyl ether and dried under vacuum prior to GPC analysis. The molecular weight distributions of the acetylated lignin samples were analyzed on a PSS-Polymer Standards Service (Warwick, RI, USA) GPC SECurity 1200 system featuring Agilent HPLC 1200 components equipped with four Waters Styragel columns (HR1, HR2, HR4 and HR6) and an UV detector (270 nm). Tetrahydrofuran was used as the mobile phase and flow rate was 1.0 mL min−1. Standard narrow polystyrene samples were used for calibration.
1 v/v, 2.0 mL) and stirred at room temperature for 24 h. Ethanol (25.0 mL) was added to the reaction mixture, left for 30 min and removed with a rotary evaporator. The addition and removal of ethanol was repeated until trace of acetic acid was removed from the sample. The residue was dissolved in chloroform (2.0 mL) and precipitated with diethyl ether (100.0 mL). The precipitate was centrifuged, washed thrice with diethyl ether and dried under vacuum prior to GPC analysis. The molecular weight distributions of the acetylated lignin samples were analyzed on a PSS-Polymer Standards Service (Warwick, RI, USA) GPC SECurity 1200 system featuring Agilent HPLC 1200 components equipped with four Waters Styragel columns (HR1, HR2, HR4 and HR6) and an UV detector (270 nm). Tetrahydrofuran was used as the mobile phase and flow rate was 1.0 mL min−1. Standard narrow polystyrene samples were used for calibration.
2.7 NMR analysis
3. Results and discussion
3.1 Composition of the starting and DA pretreated biomass
The unpretreated poplar (Populus trichocarpa) feedstock had a typical composition of hardwood with 24.6% Klason lignin and 75.4% holocellulose. The carbohydrate fraction was predominantly composed of glucan (57.9%) and xylan (13.5%), while arabinan (0.4%), mannan (2.8%) and galactan (0.8%) were relatively minor components. The effects of DA pretreatment on the compositions of poplar were presented in Fig. 2. The solid material recovered after dilute acid pretreatment mainly contained lignin (∼25%) and glucan (∼68–75%) as shown in Fig. 2. Hemicelluloses were susceptible to dilute acid pretreatment and as the pretreatment time was extended, the hemicellulose content decreased rapidly. The majority of hemicellulose was observed to remove within the initial approximately 5 min of pretreatment. Arabinan and galactan were very prone to DA pretreatment and depleted in the pretreated poplar after a very short time (i.e., 0.3–1.1 min) of pretreatment. Xylose accounted for 1.2% in the pretreated material at a pretreatment time of 5.4 min and its relative content was lower than 1.0% when pretreatment time was extended to 8.5 min. The pretreated poplar had a 1.2% of mannose at the 1.1 min pretreatment and lower than 1.0% with a longer pretreatment time.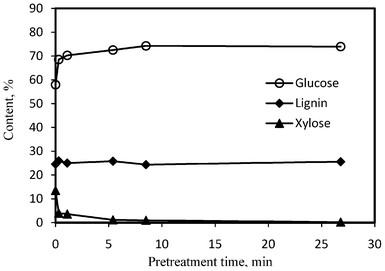 | ||
| Fig. 2 The effects of DA pretreatment on the compositions of poplar samples. | ||
Fig. 2 demonstrated that the poplar had similar lignin contents over the dilute acid pretreatment, suggesting the pretreatment in this study was fairly ineffective at the removal of lignin. The relative glucose content increased to 70.2% at a pretreatment time of 1.1 min and reached a maximum (74.2%) at 8.5 min of residence time, primarily due to the removal of hemicellulose in the pretreated poplar during DA pretreatment process. With the pretreatment time extending to 26.8 min, the relative glucose content in the pretreated poplar did not further increase. This could be readily attributed to the fact that over 99% of the hemicellulose was removed (total content lower than 0.5%) by this time and cellulose solubilization started to become the dominating process with further longer time pretreatment.
3.2 GPC analysis of poplar cellulose
GPC is frequently employed for the molecular weight (MW) measurements of cellulose in lignocellulosic materials. Various studies have shown GPC to be a valuable tool in monitoring degradation of not only cellulose but also hemicellulose and lignin.22,27,28 The molecular weight distributions (MWDs) of poplar cellulose samples derivatized with phenyl isocyanate were shown in Fig. 3. The cellulose MWDs showed a general shift of the high molecular weight fraction to lower molecular weight over pretreatment time, indicating that DA pretreatment caused chain scission reaction to occur in cellulose, thus decreasing its molecular weight. With a short pretreatment time of 0.3 min, the MWD curve remained similar at peak maximum while the width was substantially widened and the high molecular weight fraction was almost unchanged, resulting in an increase of polydispersity of cellulose. A further broadening of MWD curve with a small shift of peak maximum towards a low molecular weight was obtained when the pretreatment time was extended to 1.1 min. This suggested that within a relative short pretreatment time (0.3–1.1 min) the cellulose suffered a minor extent of chain scission that led to the appearance of lower molecular weight fractions with a broader molecular weight distribution curve, while the majority of cellulose chains were not depolymerized. When the pretreatment time was extended to 5.4 min, a clear shift in the cellulose MWD curve towards low molecular weight was observed, with the molecular weight at peak maximum being substantially reduced. This was also accompanied by a shift of high molecular weight fraction, as evidenced by the GPC curves in Fig. 3. A further shift of MWD curve towards low molecular weight was obtained when the pretreatment time was extended longer to 8.5 and 26.8 min. The shift of MWD curves at longer reaction time (5.4–26.8 min) suggested that the pretreatment in this latter phase led to a substantial hydrolytic cleavage of glycosidic bonds in the bulk of cellulose.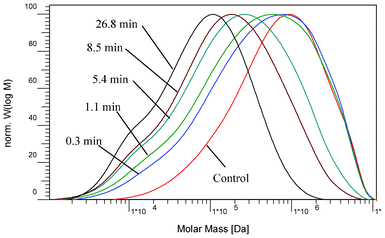 | ||
| Fig. 3 Molecular weight distributions of cellulose samples prepared from the starting and dilute acid pretreated poplar. | ||
GPC analysis can also determine the weight-average molecular weight (Mw) and the number-average molecular weight (Mn) of cellulose, where the former is calculated as the sum of total weight of each type of molecules multiplied by its respective weight fraction in a sample, while the latter is calculated as the total weight of polymer molecules divided by the total number of polymer molecules in a sample. The cellulose prepared from the untreated poplar exhibited a weight-average molecular weight of 1![[thin space (1/6-em)]](https://www.rsc.org/images/entities/char_2009.gif) 250
250![[thin space (1/6-em)]](https://www.rsc.org/images/entities/char_2009.gif) 000 g mol−1 (DPw = 2408) and number-average molecular weight of 247
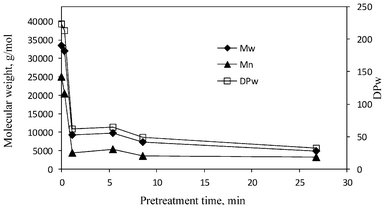
000 g mol−1 (DPw = 2408) and number-average molecular weight of 247![[thin space (1/6-em)]](https://www.rsc.org/images/entities/char_2009.gif) 000 g mol−1 (Fig. 4), which are comparable to those reported for hardwood cellulose.36Fig. 4 demonstrated a varying phase in decrease of cellulose weight-average molecular weight and number-average molecular weight over the pretreatment. For pretreatment within a relative short time of 1.1 min (the initial phase of cellulose chain scission), the number-average molecular weight of cellulose had a substantial decrease by 55–65%, while the weigh-average molecular weight decreased only approximately 17–24%. The pretreatment at about 5 min caused more cellulose chain scissions leading to a small decrease of the number-average molecular weight but a significant decrease (∼57% reduction) in the weight-average molecular weight to 541
000 g mol−1 (Fig. 4), which are comparable to those reported for hardwood cellulose.36Fig. 4 demonstrated a varying phase in decrease of cellulose weight-average molecular weight and number-average molecular weight over the pretreatment. For pretreatment within a relative short time of 1.1 min (the initial phase of cellulose chain scission), the number-average molecular weight of cellulose had a substantial decrease by 55–65%, while the weigh-average molecular weight decreased only approximately 17–24%. The pretreatment at about 5 min caused more cellulose chain scissions leading to a small decrease of the number-average molecular weight but a significant decrease (∼57% reduction) in the weight-average molecular weight to 541![[thin space (1/6-em)]](https://www.rsc.org/images/entities/char_2009.gif) 000 (DPw = 1042). As the pretreatment time was extended longer, the reduction in the number-average molecular weight slowed dramatically and became appreciably insignificant (reduction by ∼80% at 8.5 min and 86% at 26.8 min), while the weigh-average molecular weight continued to decrease further (reduction by ∼69% at 8.5 min and 87% at 26.8 min). The varying behavior in decrease of average molecular weights of cellulose revealed that the initial phase of chain scission (0.3–1.1 min) resulted primarily in a dramatic decrease in number-average MW, while the latter bulk phase of chain scission (5.4–26.8 min) predominantly led to a decrease in weight-average MW. The reduction of cellulose DP followed a similar pattern of molecular weights with DPw having a relative modest reduction (17–24%) over the initial phase and a substantial decrease (57–87%) over the later bulk phase. Interestingly, the degradation process of amorphous cellulose in cotton-based paper was reported to consist of two major stages involving an initial stage with a rapid hydrolytic attack on the amorphous chain segments and a latter level-off stage displaying a much slower hydrolytic attack.37,38 Foston et al.24 compared behaviors of cellulose in populus and switchgrass during a dilute acid pretreatment (at 160 °C) and observed similarly rapid and slow phases in the decrease of cellulose molecular weight, with populus cellulose having the rapid decrease phase at an earlier time. On the basis of molecular weights reduction behavior, the initial rapid and latter slow phases appeared to occur as a common phenomenon for cellulose during the DA treatment process.
000 (DPw = 1042). As the pretreatment time was extended longer, the reduction in the number-average molecular weight slowed dramatically and became appreciably insignificant (reduction by ∼80% at 8.5 min and 86% at 26.8 min), while the weigh-average molecular weight continued to decrease further (reduction by ∼69% at 8.5 min and 87% at 26.8 min). The varying behavior in decrease of average molecular weights of cellulose revealed that the initial phase of chain scission (0.3–1.1 min) resulted primarily in a dramatic decrease in number-average MW, while the latter bulk phase of chain scission (5.4–26.8 min) predominantly led to a decrease in weight-average MW. The reduction of cellulose DP followed a similar pattern of molecular weights with DPw having a relative modest reduction (17–24%) over the initial phase and a substantial decrease (57–87%) over the later bulk phase. Interestingly, the degradation process of amorphous cellulose in cotton-based paper was reported to consist of two major stages involving an initial stage with a rapid hydrolytic attack on the amorphous chain segments and a latter level-off stage displaying a much slower hydrolytic attack.37,38 Foston et al.24 compared behaviors of cellulose in populus and switchgrass during a dilute acid pretreatment (at 160 °C) and observed similarly rapid and slow phases in the decrease of cellulose molecular weight, with populus cellulose having the rapid decrease phase at an earlier time. On the basis of molecular weights reduction behavior, the initial rapid and latter slow phases appeared to occur as a common phenomenon for cellulose during the DA treatment process.
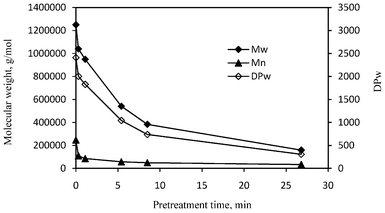 | ||
| Fig. 4 The average molecular weights (Mw and Mn) and weight-average degree of polymerization (DPw) of poplar cellulose samples versus the pretreatment time. Mw: weight-average molecular weight; Mn: number-average molecular weight. | ||
The GPC analysis revealed that the pretreatment at initial rapid phase resulted in an increased polydispersity index (PDI = Mw/Mn) of cellulose, which increased from 5.1 for the unpretreated cellulose to 9.4 and 11.1 for 0.3 and 1.1 min pretreatment, respectively. While during the bulk phase of chain scission with longer pretreatment time (5.4–26.8 min) the polydispersity index of cellulose start to decrease, with a PDI determined to be 7.7 and 4.8 for pretreatment at 8.5 and 26.8 min, respectively. The PDI profile of cellulose during DA pretreatment could be readily attributed to the observed different behavior of number-average and weight-average MW reduction during the initial and bulk phase of cellulose chain scission.
3.3 GPC analysis of poplar hemicellulose
While majority of hemicellulose was removed over the DA pretreatment process, a small amount of it was observed to remain in the pretreated poplar. GPC analysis was performed on the hemicelluloses samples extracted from the control and pretreated poplar with 24% aqueous potassium hydroxide and the molecular weight distributions were shown in Fig. 5. The hemicellulose extracted from the untreated poplar had a Mn of 2.50 × 10⁴ g mol−1, Mw of 3.35 × 10⁴ g mol−1 and polydispersity index of 1.3. As could be seen from Fig. 5, the hemicellulose MWDs showed a shift to lower molecular weight over the pretreatment time. For a short pretreatment time of 0.3 min, the hemicellulose MWD curve remained unchanged both at peak maximum and high molecular weight fraction while the width was slightly widened. A significant shift of MWD curve and peak maximum towards a low molecular weight was observed when the pretreatment time was extended to 1.1 min and longer.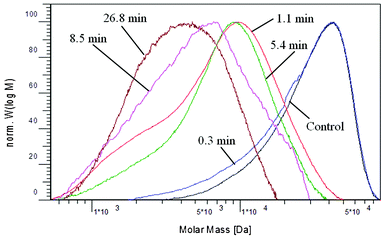 | ||
| Fig. 5 Molecular weight distributions of hemicellulose samples extracted from the starting and dilute acid pretreated poplar as determined with GPC. | ||
The weight-average and number-average molecular weights of hemicellulose extracted from poplar over the pretreatment time are summarized in Fig. 6. A very short pretreatment time of 0.3 min resulted in a moderate reduction of molecular weights (reduction of Mn by ∼18% and Mw by ∼5%) of extracted hemicellulose. For a DA pretreatment of 1.1 min, the hemicellulose had a dramatic decrease in both the number-average molecular weight (∼83% reduction) and weigh-average molecular weight (∼73% reduction). As the pretreatment time was extended longer, the decrease in hemicellulose molecular weight slowed and only slightly further reduction was observed (∼87% of Mn and 86% of Mw reduction at 26.8 min, respectively).
 | ||
| Fig. 6 The weight-average (Mw), number-average (Mn) molecular weights and weigh-average degree of polymerization (DPw) of hemicelluloses extracted from the starting and dilute acid pretreated poplar. | ||
The molar mass molecular weights for the extracted hemicellulose corresponded to an estimated degree of polymerization (calculated as the average number of xylose units per polysaccharides molecule) of DPn being 167 and DPw being 223 for the unpretreated poplar. The pretreatment over the range of 1.1 to 26.8 min led to a significant reduction of DP to ∼29–21 (DPn) and ∼62–32 (DPw) for the hemicelluloses extracted from pretreated poplar. The GPC analysis also revealed that the polydispersity index of hemicellulose extracted from poplar appeared to have no major difference during the pretreatment process with small changes in the range of 0.2–0.8. Unlike cellulose, the hemicellulose had a similar pattern of reduction for both the number-average molecular weight and weigh-average molecular weight over the pretreatment time, which could be attributed to its distinct structural features such as no crystalline allomorphs and a magnitude lower starting DP.
3.4 Solid state CPMAS 13C NMR of cellulose
Solid state CPMAS 13C NMR experiments were conducted to determine the crystallinity index (CrI) of cellulose and how the CrI changed over a range of pretreatment time for dilute acid pretreated poplar. The cellulose from the poplar was isolated following literature procedures26,27 and Fig. 7 provides representative 13C CPMAS NMR spectra of isolated cellulose samples and the crystallinity index results. Each of the six carbon atoms in the monomeric unit (i.e., glucose) of cellulose backbone were denoted C1 through C6 and labeled accordingly on the corresponding carbon signal in the spectrum. The C4 region, which extends over a chemical shift range of δ ∼ 80–92 ppm, consists of a crystalline domain which appeared as a fairly sharper signal peaked at δ ∼ 89 ppm and an amorphous domain that produced broader upfield resonance from δ ∼ 80–86 ppm.26,27,33 The ratio of the area in the δ ∼ 86–92 ppm region to the total C4 peak area in these two regions is designated as the crystallinity index (CrI).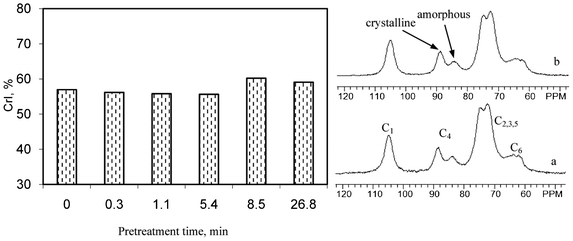 | ||
| Fig. 7 Representative CPMAS 13C NMR spectra and crystallinity index (CrI) of isolated cellulose prepared from untreated and dilute acid pretreated poplar. a: untreated; b: 26.8 min pretreated. | ||
It could be seen from Fig. 7 that the poplar cellulose showed no apparent change in the relative intensities of signals from crystalline and amorphous regions before and after DA pretreatment. While amorphous cellulose is generally believed to be more susceptible to hydrolysis, the DA pretreatment appeared to have no noteworthy preference of acidic hydrolyzation to cellulose amorphous regions, particularly within the short time range of pretreatments examined in this study. The CPMAS 13C NMR analysis demonstrated that the crystalline index of poplar cellulose remained almost unchanged during the pretreatment time of 0.3–5.4 min. As the pretreatment time extended to 8.5 and 26.8 min, the cellulose isolated from poplar had a slight increase of CrI (increase by ∼3 units). Sannigrahi et al.20 compared the crystalline index of loblolly pine cellulose before and after two-stage dilute acid pretreatment and observed an increase of 7.4 units of CrI. The small increase of crystallinity index of poplar cellulose after dilute acid pretreatment was consistent with previous reports that low pH pretreatment usually enhanced biomass crystallinity.19,24
3.5 Lignin structural analysis using NMR
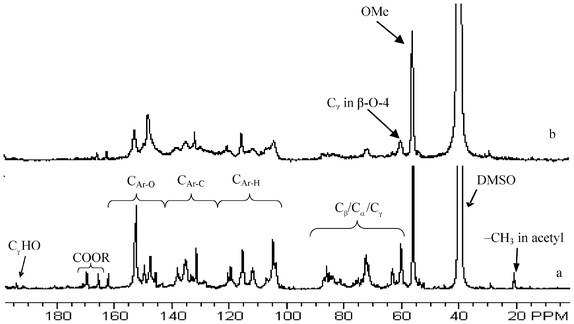 | ||
| Fig. 8 Representative quantitative 13C NMR spectra of lignin samples isolated from untreated and dilute acid pretreated poplar. a: untreated; b: 26.8 min pretreatment; Ar: aromatic; OMe: methoxyl; DMSO: dimethyl sulfoxide. | ||
As can be seen from comparison of Fig. 8a and 8b, the 13C NMR spectra of lignin isolated from the untreated and DA pretreated poplars exhibited a remarkable difference in resolution and intensities of signals originated from various lignin moieties within both aromatic and aliphatic (∼50–90 ppm) regions. Generally, the lignin from pretreated poplar had a lower signal resolution for structural moieties in comparison to that from unpretreated poplar, which was attributed to its more condensed structural features due to repolymerization during DA pretreatment. The 13C NMR spectra (Fig. 8) demonstrated that the lignin from pretreated poplar had a noteworthy decrease in the relative signal intensity of Cγ in β-O-4 moieties (peaked at ∼59.8 ppm) in the aliphatic range when compared to that from the unpretreated poplar. This was consistent with the previous reports that β-O-4 linkages were susceptible to acidic hydrolysis and their acid catalyzed cleavage was proposed as the major depolymerization mechanism of lignin molecular during acidic pretreatment conditions.40 In the aromatic range (δ ∼ 162–103 ppm), the signal peaked around 152 ppm attributing to the C3/5 in etherified syringyl unit was significantly decreased after DA pretreatment compared to the lignin in unpretreated poplar, which implied that the etherified syringyl units were largely removed upon dilute acid pretreatment process. The signals (methyl C around 20.1 ppm and carbonyl C ∼ 169.4 ppm) of acetyl group were diminished in intensity within the pretreatment time of 0.3–8.4 min and almost completely depleted at 26.8 min, suggesting it susceptible to degradation during DA pretreatment. A significant loss in cinnamaldehyde signal (Cγ at ∼194 ppm) in poplar lignin was also observed after the DA pretreatment, reflecting its acidic degradation under the conditions examined in this study.
The quantitative results from 13C NMR analysis are summarized in Fig. 9 and 10. When compared to unpretreated poplar, the relative amount of β-O-4 linkages in lignin isolated from pretreated poplars clearly decreased and this decrease was augmented as the pretreatment time extended. Under acidic conditions with elevated temperature, the β-O-4 linkage in lignin structure was very prone to acidolysis.20,41 As could be seen in Fig. 9, the poplar lignin had a decrease in β-O-4 content (by ∼19%) at the start of the DA pretreatment (0.3 min). With the extension of the pretreatment time, the lignin had a further decrease in β-O-4 content while the reduction became slower. Pretreatment at 5.4 min and 26.8 min resulted in a reduction of β-O-4 content in lignin by ∼29% and 53%, respectively. The S/G monolignol ratio versus the pretreatment time is depicted in Fig. 9. It could be seen that the poplar lignin had a decrease in S/G ratio after pretreatment and the reduction was enhanced with a longer pretreatment time. The poplar lignin had a rapid decrease by ∼18% in S/G ratio at the start of the DA pretreatment (0.3 min), with the reduction further extending to be ∼30% and ∼47% with the longer pretreatment time at 5.4 min and 26.8 min, respectively. One explanation of the observed decrease in S/G ratio could be that the syringyl units (i.e., etherified) were more readily removed as a result of β-O-4 aryl ether linkage cleavage, leading to a lower proportion of syringyl units remaining after pretreatment.
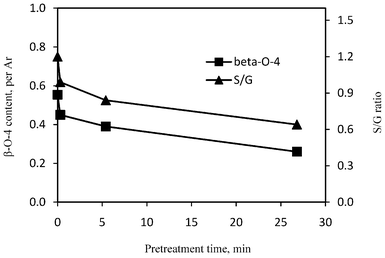 | ||
| Fig. 9 β-O-4 linkage content and monolignol S/G ratio in lignin isolated from the untreated and dilute acid pretreated poplars. | ||
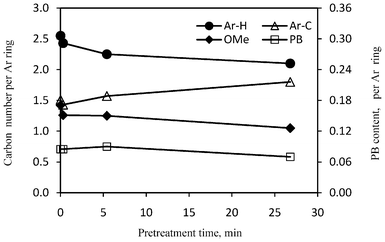 | ||
| Fig. 10 The relative contents of aromatic carbons, methoxyl group (OMe) and phenyl benzoate (PB) group in lignin isolated from the untreated and dilute acid pretreated poplars. Ar–H: protonated aromatic carbons; Ar–C: carbon substituted aromatic carbons. | ||
13C NMR analysis demonstrated that the condensation occurred during the DA pretreatment in this study, as evidenced by an increase in the content of aromatic carbon–carbon structures attributing to the formation of more C–C lignin linkages and a decrease in the number of protonated aromatics in the pretreated poplar (Fig. 10), which translated to an increase in the degree of condensation. Under acidic conditions with elevated temperature, the lignin has been reported to subject to acid-catalyzed condensation between the aromatic C6/C2 and a carbonium ion located at Cα of the side chain, giving rise to a new carbon–carbon linkage between two lignin units.41 The enriched guaiacyl structure units in lignin after pretreatment suggested that the condensation might take place preferably among guaiacyl units. Indeed, Li et al.41 observed a complete absence of protonated aromatic C2 and C6 in guaiacyl units of aspen lignin after 210 min auto hydrolysis at 177 °C.
The 13C NMR analysis showed that the poplar lignin had a decrease in methoxyl content after dilute acid pretreatment (Fig. 10). The unpretreated poplar lignin had a methoxyl content of 1.42 per aromatic ring which was comparable to values reported for lignin in two clonal aspen (P. tremuloides)23 and this content decreased by ∼11% after pretreatment at 0.3 min. Pretreatment at 26.8 min resulted in a decrease in methoxyl content by ∼26% in the pretreated poplar. The observed decrease in methoxyl content was attributed, in part, to the preferable removal of syringyl unit during DA pretreatment. The p-hydroxybenzoate structure in unpretreated poplar lignin was ∼0.09 per aromatic ring which was closely in agreement with previous research that reported approximately 10% content in clonal aspen lignin.23,42 The 13C NMR results showed that the relative content of p-hydroxyphenyl benzoate remained nearly unchanged within the DA pretreatment time range of 0.3–5.4 min, and then slightly decreased to 0.07 per aromatic ring at a longer pretreatment time of 26.8 min.
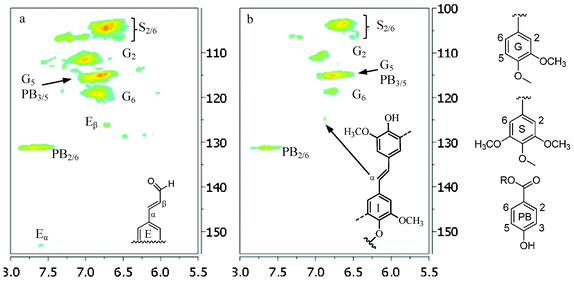 | ||
| Fig. 11 Aromatic regions of 13C/1H HSQC NMR spectra of lignin samples isolated from untreated (a) and dilute acid pretreated poplar (b: 26.8 pretreatment time). G: guaiacyl; S: syringyl; PB: p-hydroxyphenyl benzoate; E: cinnamaldehyde; I: stilbene; R: H or lignin moiety. | ||
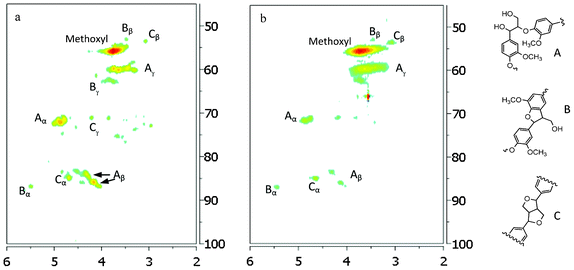 | ||
| Fig. 12 Aliphatic regions of 13C/1H HSQC NMR spectra of lignin samples isolated from untreated (a) and dilute acid pretreated poplar (b: 26.8 pretreatment time). A: β-O-4 ether; B: β-5/α-O-4 phenylcoumaran; C: resinol. | ||
| δ C/δH (ppm) | Assignmenta |
|---|---|
| a A: β-O-4 ether linkage; B: β-5/α-O-4 phenylcoumaran; C: resinol; E: cinnamaldehyde. | |
| 53.1/3.44 | Cβ/Hβ in phenylcoumaran substructure (B) |
| 53.6/3.07 | Cβ/Hβ in resinol substructure (C) |
| 55.6/3.72 | C/H in methoxyl group |
| 59.8/3.63 | Cγ/Hγ in β-O-4 ether linkage (A) |
| 61.6/4.11 | Cγ/Hγ in cinnamyl alcohol |
| 62.8/3.76 | Cγ/Hγ in phenylcoumaran substructure (B) |
| 71.1/4.18, 3.82 | Cγ/Hγ in resinol substructure (C) |
| 71.3/4.77 | Cα/Hα in β-O-4 (A) linked to a G unit |
| 71.9/4.86 | Cα/Hα in β-O-4 (A) linked to a S unit |
| 83.7/4.31 | Cβ/Hβ in β-O-4 (A) linked to a G unit |
| 84.9/4.66 | Cα/Hα in resinol substructure (C) |
| 86.0/4.13 | Cβ/Hβ in β-O-4 (A) linked to a S unit |
| 86.8/5.48 | Cα/Hα in phenylcoumaran substructure (B) |
| 103.8/6.75 | C2,6/H2,6 in syringyl unit |
| 106.4/7.23 | C2,6/H2,6 in oxidized syringyl (S') units with Cα = O |
| 110.9/7.02 | C2/H2 in guaiacyl unit |
| 114.8/6.73 | C3,5/H3,5 in p-hydroxyphenyl benzoate unit |
| 115.1/6.82 | C5/H5 in guaiacyl unit |
| 119.1/6.81 | C6/H6 in guaiacyl unit |
| 126.2/6.79 | Cβ/Hβ in cinnamaldehyde unit (E) |
| 131.3/7.68 | C2,6/H2,6 in p-hydroxyphenyl benzoate unit |
| 153.4/7.61 | Cα/Hα in cinnamaldehyde unit (E) |
In the side chain region of HSQC spectra, the cross signals for methoxyl (δC/δH 55.6/3.72 ppm) and β-O-4 substructures in lignin were the most prominent ones. The C–H correlations in β-O-4 substructure (A in Fig. 12) were well resolved for Cα/Hα, Cβ/Hβ and Cγ/Hγ. The presence of phenylcoumaran substructure (B in Fig. 12) was confirmed by C–H correlations for α-, β- and γ-C positions centered at δC/δH 86.8/5.48, 53.1/3.44 and 62.8/3.76 ppm, respectively. Lignin resinol subunit (C in Fig. 12) was also evidenced by its C/H correlations around δC/δH 84.9/4.66 (Cα/Hα), 53.6/3.07 (Cβ/Hβ), and 71.1/3.82,4.18 (Cγ/Hγ) ppm. The HSQC analysis showed that the intensity of correlation signals for Cα–H, Cβ–H and Cγ–H in β-O-4 was significantly diminished in poplar lignin after pretreatment, further confirming the decrease in relative β-O-4 linkage content resulting from its hydrolytic degradation; while the correlation signal intensity for resinol and phenylcoumaran subunits was observed to increase suggesting these substructures were fairly stable during the DA pretreatment. One of degradation pathways for β-O-4 units under acidic conditions is to form stilbene substructures.47 The HSQC spectra observed the stilbene unit (I in Fig. 11) in poplar lignin after DA pretreatment at 26.4 min, giving rise to the Cα/Hα signal around 125/6.9 ppm. Such structure was also previously identified in Buddleja daviddi lignin during ethanol organosolv pretreatment with sulfuric acid as the catalyst.32 It has been proposed that the hemolytic cleavage of β-O-4 via quinone methide intermediate resulted in the formation of β-1 interlinkage through radical coupling, which then in turn lost the γ–methylol group as formaldehyde under acidic medium to produce stilbene structure.32,47
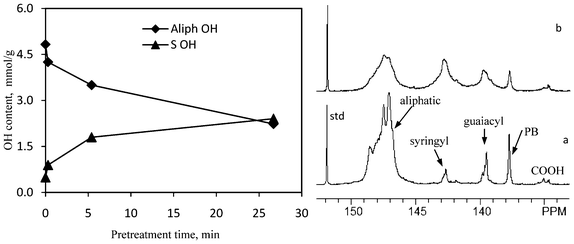 | ||
| Fig. 13 Representative 31P NMR spectra of lignin samples and hydroxyl group content in lignin samples isolated from untreated and dilute acid pretreated poplar as determined by 31P NMR analysis. a: untreated; b: 26.8 min pretreatment; std: internal standard; PB: p-hydroxyphenyl benzoate. | ||
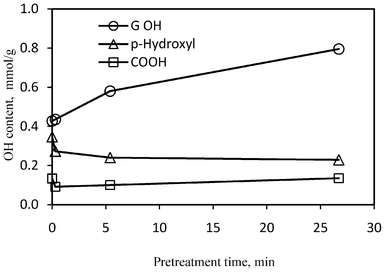 | ||
| Fig. 14 Hydroxyl group content in lignin samples isolated from untreated and dilute acid pretreated poplar as determined by 31P NMR analysis. | ||
As evidenced from the 13C NMR data, the cleavage of the β-O-4 aryl ether bond was facile and increased with increasing pretreatment times yielding to the formation of new phenolic groups in lignin. This was supported with 31P NMR data since the amount of phenolic OH groups, both from guaiacyl and syringyl units, increased as a result of pretreatment (Fig. 13 and 14). The lignin extracted from the unpretreated poplar wood gave a guaiacyl phenolic OH group of 0.43 mmol g−1 and syringyl phenolic OH of 0.49 mmol g−1. At the short DA pretreatment time (0.3 min), the syringyl phenolic OH content in poplar lignin increased by ∼45% while the guaiacyl phenolic OH group showed no apparent increase. This implied that the syringyl unit in lignin was more reactive and underwent a greater extent of inter-linkage cleavage at the early stage of pretreatment, which confirmed the results from 13C NMR analysis. The 31P NMR analysis showed a well resolved signal for the p-hydroxyl phenolic OH in poplar lignin with the amount being 0.35 mmol g−1. Fig. 14 showed that the poplar lignin had a slight decrease of p-hydroxyl phenolic OH content after dilute acid pretreatment whereas the carboxylic OH content showed no apparent change. Coupled with the 13C and HSQC NMR analysis, the p-hydroxyl phenolic OH group was mainly attributed to the p-hydroxyphenyl benzoate structure in poplar lignin. 13C NMR analysis showed a small decrease of p-hydroxyphenyl benzoate structure only at the extended pretreatment time of 26.8 min. This might be due to the fact that 31 NMR only detected the p-hydroxyphenyl benzoate structure with free phenolic OH group.
3.6 GPC characterization of lignin
GPC is a frequently employed tool to study the changes in the molecular weight distribution of lignin which can provide important insight into its depolymerization/repolymerization reactions. To understand the effect of dilute acid pretreatment on the lignin structure, GPC analysis was used to determine the changes in its molecular weights that took place as a result of the dilute acid pretreatment of poplar. Fig. 15 provided representative GPC chromatograms of lignin isolated from poplars at various pretreatment times and the resulted molar mass data and polydispersity index (PDI = Mw/Mn) were summarized in Fig. 16. NMR analysis demonstrated that the lignin underwent cleavage of β-O-4 linkages during acidic thermal treatment conditions. As a result of the substantial cleavage of β-O-4 linkages, the molecular weight of lignin would be expected to decrease sharply as a result of the dilute acid pretreatment. This was not the case, however, the dilute acid pretreatment under the conditions in this study appeared to have no significant impact on the molecular weight distribution of lignin as revealed by GPC analysis. Fig. 15 showed that all the lignin samples demonstrated a similar shape of molecular weight distribution curve with a maximum peak unchanged around 6500 g mol−1. Although more β-O-4 linkages were cleaved as the pretreatment severity increased, the MW of lignin did not change accordingly. Over the range of pretreatment times employed, the number-average molecular weight was observed to remain relatively unchanged while the weight-average molecular weight exhibited a minor reduction. Samuel et al.22 also reported a similar observation that switchgrass lignin had nearly unchanged molecular weights after a dilute sulfuric acid treatment.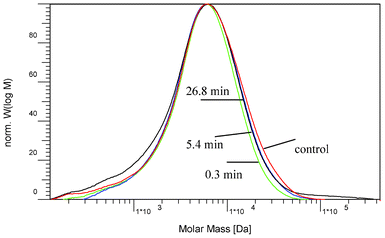 | ||
| Fig. 15 Molecular weight distribution curves of acetylated lignin isolated from the starting and dilute-acid pretreated poplar. | ||
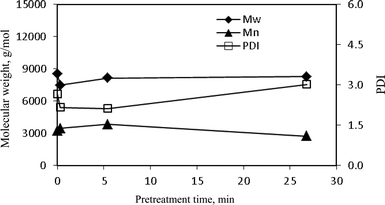 | ||
| Fig. 16 The weight-average (Mw), number-average (Mn) molecular weights and polydispersity index (PDI) of lignin isolated from the starting and dilute acid pretreated poplar. | ||
As demonstrated with NMR data, the predominant reactions in lignin were fragmentation by acidolysis of β-O-4 linkages and repolymerization by acid catalyzed condensation. The GPC data clearly revealed that the cleavage of β-O-4 linkages in the lignin during the dilute acid pretreatment was accompanied by a repolymerization reaction resulting in an increase in its molecular size. Li et al.40 reported that both the fragmentation and repolymerization reactions took place more or less simultaneously during steam explosion. The extent of occurring repolymerization reactions in lignin during dilute acid pretreatment was investigated from the GPC analysis. The lignin extracted from the unpretreated poplar wood gave a weight-average molecular weight (Mw) of 8550 g mol−1, which then decreased by ∼12% to 7500 g mol−1 at a short time (0.3 min) pretreatment. As the pretreatment time extended, the lignin Mw started to increase to 8140 g mol−1 (∼5% reduction) at 5 min pretreatment and to 8280 (∼3% decrease) at 26.8 min. This implied that at the early stage of pretreatment lignin underwent a greater extent of inter-linkage cleavage than repolymerization permitting a small decrease in weight-average molecular weight. With an increasing pretreatment time, the repolymerization became more dominant and an increased Mw and more heterogeneous structure was resulted. The GPC results also demonstrated that the poplar lignin had a slightly lower polydispersity index (PDI ∼ 2.2) within the pretreatment of 0.3–5.4 min when compared to the lignin from unpretreated poplar (PDI ∼ 2.7); and the polydispersity became slighter higher (PDI ∼ 3.0) at pretreatment of 26.8 min. The change in polydispersity index of lignin over the pretreatment process might be attributed to the competition between depolymerization and repolymerization.32,40
Conclusions
GPC and NMR techniques were used to study the structural characteristics of poplar as a result of dilute acid pretreatment over a range of various pretreatment times in order to understand the chemical transformation of poplar lignocellulosics. DA pretreatment was capable of dissolving hemicelluloses and disrupting structural features of lignin and polysaccharides. The analysis results demonstrated that the poplar lignin had a significant decrease of aryl-O-ether linkage (β-O-4) and repolymerization of lignin fragments occurred almost simultaneously during pretreatment. The lignin was also observed to have a decrease in S/G ratio during dilute acid pretreatment with the condensation preferably taking place on guaiacyl unit. The lignin was also observed to have a decrease in methoxyl group content and an increase in phenolic group. While the dilute acid pretreatment resulted in a reduction in molecular weight of cellulose and hemicellulose, no prominent change of molecular weight was observed for lignin. The DA pretreatment demonstrated no significant impact on the crystalline index (CrI) of cellulose particularly within the short time range of pretreatments examined in this study.Acknowledgements
This work was supported and performed as part of the BioEnergy Science Center (BESC). The BioEnergy Science Center is a U.S. Department of Energy Bioenergy Research Center supported by the Office of Biological and Environmental Research in the DOE Office of Science. The authors would like to gratefully acknowledge the financial support from DOE Office of Biological and Environmental Research through the BioEnergy Science Center (DE-AC05-00OR22725).References
- A. J. Ragauskas, C. K. Williams, B. H. Davison, G. Britovsek, J. Cairney, C. A. Eckert, W. J. Frederick, J. P. Hallett, D. J. Leak, C. L. Liotta, J. R. Mielenz, R. Murphy, R. Templer and T. Tschaplinski, Science, 2006, 311, 484–489 CrossRef CAS.
- R. C. Saxena, D. K. Adhikari and H. B. Goyal, Renewable Sustainable Energy Rev., 2009, 13, 167–178 CrossRef.
- M. E. Himmel, S. Y. Ding, D. K. Johnson, W. S. Adney, M. R. Nimlos, J. W. Brady and T. D. Foust, Science, 2007, 315, 804–807 CrossRef CAS.
- Y. Pu, M. Kosa, U. C. Kalluri, G. A. Tuskan and A. J. Ragauskas, Appl. Microbiol. Biotechnol., 2011, 91, 1525–1536 CrossRef CAS.
- K. Radotić, M. Mićić and M. Jeremić, Ann. N. Y. Acad. Sci., 2005, 1048, 215–229 CrossRef.
- Y. Pu, D. Zhang, P. M. Singh and A. J. Ragauskas, Biofuels, Bioprod. Biorefin., 2008, 2, 58–73 CrossRef CAS.
- B. Yang and C. E. Wyman, Biofuels, Bioprod. Biorefin., 2008, 2, 26–40 CrossRef CAS.
- R. P. Chandra, R. Bura, W. E. Mabee, A. Berlin, X. J. Pan and J. N. Saddler, Adv. Biochem. Eng./Biotechnol., 2007, 108, 67–93 CrossRef CAS.
- N. Mosier, C. E. Wyman, B. Dale, R. Elander, Y. Y. Lee, M. Holtzapple and M. Ladisch, Bioresour. Technol., 2005, 96, 673–686 CrossRef CAS.
- B. Yang and C. E. Wyman, Biotechnol. Bioeng., 2004, 86, 88–95 CrossRef CAS.
- Y. Sun and J. J. Cheng, Bioresour. Technol., 2002, 83, 165–171 CrossRef.
- Y. Sun and J. J. Cheng, Bioresour. Technol., 2005, 96, 1599–606 CrossRef CAS.
- D. J. Schell, J. Farmer, M. Newman and J. D. McMillan, Appl. Biochem. Biotechnol., 2003, 105, 69–85 CrossRef.
- M. Foston and A. J. Ragauskas, Energy Fuels, 2010, 24, 5677–5685 CrossRef CAS.
- H. E. Grethlein, Nat. Biotechnol., 1985, 3, 155–160 CrossRef CAS.
- J. A. Rollin, Z. Zhu, N. Sathitsuksanoh and Y.-H. P. Zhang, Biotechnol. Bioeng., 2011, 108, 22–30 CrossRef CAS.
- M. J. Selig, S. Viamajala, S. R. Decker, M. P. Tucker, M. E. Himmel and T. B.Vinzant, Biotechnol. Prog., 2007, 23, 1333–1339 CrossRef CAS.
- R. Kumar and C. E. Wyman, Biotechnol. Prog., 2009, 25, 807–819 CrossRef CAS.
- R. Kumar, G. Mago, V. Balan and C. E. Wyman, Bioresour. Technol., 2009, 100, 3948–3962 CrossRef CAS.
- P. Sannigrahi, A. J. Ragauskas and S. J. Miller, BioEnergy Res., 2008, 1, 205–214 CrossRef.
- L. Shuai, Q. Yang, J.-Y. Zhu, F.-C. Lu, P. J. Weimer, J. Ralph and X.-J. Pan, Bioresour. Technol., 2010, 101, 3106–3114 CrossRef CAS.
- R. Samuel, Y. Q. Pu, B. Raman and A. J. Ragauskas, Appl. Biochem. Biotechnol., 2010, 162, 62–74 CrossRef CAS.
- P. Sannigrahi, A. J. Ragauskas and G. A. Tuskan, Biofuels, Bioprod. Biorefin., 2010, 4, 209–226 CrossRef CAS.
- M. Foston and A. J. Ragauskas, Biomass Bioenergy, 2010, 34, 1885–1898 CrossRef CAS.
- M. Davis, J. Wood Chem. Technol., 1998, 18, 235–252 CrossRef CAS.
- P. Sannigrahi, D. H. Kim, S. Jung and A. J. Ragauskas, Energy Environ. Sci., 2011, 4, 1306–1310 CAS.
- B. B. Hallac, P. Sannigrahi, Y. Q. Pu, M. Ray, R. J. Murphy and A. J. Ragauskas, J. Agric. Food Chem., 2009, 57, 1275–1281 CrossRef CAS.
- A. Jacobs and O. Dahlman, Biomacromolecules, 2001, 2, 894–905 CrossRef CAS.
- H.M. Chang, E. B. Cowling, W. Brown, E. Adler and G. Miksche, Holzforschung, 1975, 29, 153–159 CrossRef CAS.
- K. M. Holtman, H. M. Chang and J. F. Kadla, J. Agric. Food Chem., 2004, 52, 720–726 CrossRef CAS.
- C.A. Hubbell and A. J. Ragauskas, Bioresour. Technol., 2010, 101, 7410–7415 CrossRef CAS.
- B.B. Hallac, Y. Pu and A. J. Ragauskas, Energy Fuels, 2010, 24, 2723–2732 CrossRef CAS.
- Y. Pu, C. Ziemer and A. J. Ragauskas, Carbohydr. Res., 2006, 341, 591–597 CrossRef CAS.
- Y. Pu, F. Chen, A. Ziebell, B. H. Davison and A. J. Ragauskas, BioEnergy Res., 2009, 2, 198–208 CrossRef.
- Y. Pu, S. Cao and A. J. Ragauskas, Energy Environ. Sci., 2011, 4, 3154–3166 CAS.
- B. B. Hallac and A. J. Ragauskas, Biofuels, Bioprod. Biorefin., 2011, 5, 215–225 CrossRef CAS.
- C. H. Stephens, P. M. Whitmore, H. R. Morris and M. E. Bier, Biomacromolecules, 2008, 9, 1093–1099 CrossRef CAS.
- A. M. Emsley, R. J. Heywood, M. Ali and C. M. Eley, Cellulose, 1997, 4, 1–5 CrossRef CAS.
- D. Robert, In: Methods in lignin chemistry. S. Y. Lin and C. W. Dence, editors. Springer-Verlag: New York, NY, 1992. pp. 250-273 Search PubMed.
- J. Li, G. Henriksson and G. Gellerstedt, Bioresour. Technol., 2007, 98, 3061–3068 CrossRef CAS.
- J. Li, G. Henriksson and G. Gellerstedt, Ind. Crops Prod., 2008, 27, 175–181 CrossRef CAS.
- J. J. Stewart, J. F. Kadla and S. D. Mansfield, Holzforschung, 2006, 60, 111–122 CrossRef CAS.
- J. Ralph and L. L. Landucci, In: Lignin and Lignans. C. Heitner, D. R. Dimmel and J. A. Schmidt, editors. CRC Press: Boca Raton, Fla, 2010. pp. 137-244 Search PubMed.
- J. Rencoret, G. Marques, A. Gutiérrez, D. Ibarra, J. B. Li, G. Gellerstedt, J. I. Santos, J. Jiménez-Barbero, Á. T. Martínez and J. C. del Río, Holzforschung, 2008, 62, 514–526 CrossRef CAS.
- J. J. Stewart, T. Akiyama, C. Chapple, J. Ralph and S. D. Mansfield, Plant Physiol., 2009, 150, 621–635 CrossRef CAS.
- J. C. del Río, J. Rencoret, G. Marques, A. Gutiérrez, D. Ibarra, J. I. Santos, J. Jiménez-Barbero, L. M. Zhang and Á. T. Martínez, J. Agric. Food Chem., 2008, 56, 9525–9534 CrossRef.
- S. Li and K. Lundquist, Nord. Pulp Pap. Res. J., 2000, 15, 292–299 CAS.
Footnotes |
| † S. Cao is currently at College of Material Engineering, Fujian Agriculture and Forestry University, Fuzhou, P. R. China |
| ‡ M. Studer is currently at Institute of Process Engineering, Swiss Federal Institute of Technology, Sonneggstrasse, Zurich, Switzerland |
| This journal is © The Royal Society of Chemistry 2012 |
