DOI:
10.1039/C2RA21596A
(Communication)
RSC Adv., 2012,
2, 12122-12128
Visible light assisted photocatalytic hydrogen generation and organic dye degradation by CdS–metal oxide hybrids in presence of graphene oxide†
Received
27th July 2012
, Accepted 9th October 2012
First published on 11th October 2012
Abstract
Single step hydrothermal synthesis of CdS/Oxide (Oxide = ZnO, Al2O3) was demonstrated and examines their photocatalytic activity in presence of graphene oxide (GO). CdS/Al2O3/GO and CdS/ZnO/GO both exhibits enhanced photocatalytic activity for hydrogen generation with apparent quantum yields (AQY) of 14% and 30% respectively. Moreover, CdS/Oxide/GO displayed efficient photodegradation of an organic dye; ∼90% for CdS/Al2O3/GO and ∼99% for CdS/ZnO/GO within 60 min of time interval. Superior photocatalytic properties are attributed to the enhanced surface area and effective separation of photoinduced charge carriers due to the presence of GO. The present study highlights the potential application of graphene based materials in the field of energy conversion and environment remediation.
Introduction
Energy and environmental issues are the biggest challenge of 21st century at a global level.1–3 Many photocatalysts have been reported for hydrogen production as a clean energy source and for the degradation of organic pollutants.4–8 Since the discovery of the photocatalytic activity of TiO2 for hydrogen production and organic dye degradation, photocatalysis has been considered to be a promising technique for solving energy and environmental issues using abundant sunlight.9,10 Although TiO2 has been extensively studied and widely used for water splitting and environment treatment, it has practical limitations in its use due to the requirement of near ultraviolet (UV) irradiation (∼4% in the solar spectrum) for effective photocatalysis. Therefore, the development of efficient visible-light-responsive photocatalysts is a highly challenging but desirable goal for renewable energy resource and environment remediation which can effectively use a maximum of the solar spectrum.11
CdS (2.4 eV) is the most extensively used photocatalyst due to its activity under visible-light and its suitable negative conduction band (CB) edge compared to the reduction potential of hydrogen.12,13 However, the photocatalytic activity of CdS is low due to the low surface area and high recombination rate of photo induced charge carriers owing to its band energies.14,15 Most of the studies concerning CdS are focused on the improvement of photocatalytic activities by synthesizing various CdS based nanostructured materials such as nanorods, nanowires, nanotubes etc.16–19 Recent reports on CdS based photocatalysts show that the photocatalytic efficiency can be further enhanced via coupling with the wide band gap semiconductors such as TiO2, ZnO, NiO; thereby reducing the recombination rate of photoinduced charge carriers.20–22 On the other hand, the efficiency of the catalyst can be further improved by the use of a noble metal such as Pt, Pd, Ru, Rh etc. as a co-catalyst, however use of these metals makes the photocatalytic process expensive. Latest studies have revealed that carbon nanomaterials; specifically carbon nanotubes (CNTs) are promising cost effective co-catalysts.23–25 It is anticipated that CNTs are capable of accepting, transporting and storing electrons, and thus reducing the recombination of the photoinduced electrons and holes.23,25 For example, Peng et al. has demonstrated the effect of MWCNTs on the photocatalytic activity of CdS.26 Analogous to CNTs, graphene related materials can also act as an outstanding source of acceptors and transport of electron because of its conductivity, high electron mobility and large theoretical specific surface area.27–31 In addition, graphene related compounds have great adsorption abilities and are expected to be a good choice for adsorbent materials with photocatalyst.29 Due to the electron-acceptor/transport and adsorption properties, graphene related materials can be used as co-catalysts in photocatalytic processes.7,27 Therefore, lots of efforts have been carried out to use graphene related materials as a co-catalyst with semiconductor based hybrid materials for superior photocatalytic activity.
Herein, our work presents the synthesis of CdS based metal oxides hybrids and their application to photocatalytic hydrogen generation by water reduction and the degradation of an organic dye under visible light irradiation in the presence of graphene oxide (GO). Selection of GO is based on the fact that its work function has a close match with that of the CB position of CdS which can make GO a good electron acceptor generated by CdS/Oxide. The efficient separation of photoinduced electrons and holes makes the photocatalysis process more effective.
Experimental section
Cadmium acetate dihydrate, sodium sulfide, aluminium nitrate nonahydrate, zinc chloride, thioglycolic acid, sodium nitrate, hydrogen peroxide and potassium permanganate were purchased from Merck, while graphite was purchased from Loba Chemie, India, and both were used as received without any further purification.
A typical procedure for the CdS nanoparticles (NPs) synthesis; 0.5 g of Cd(OOCCH3)2·2H2O was dissolved in 25 mL of water in a flask at room temperature. A clear solution was formed which was heated to 100 °C, followed by the addition of thioglycolic acid under vigorous stirring and kept this reaction mixture in Teflon-lined stainless steel autoclave at 70 °C for 4 h. The final product was then collected, washed with distilled water and ethanol and dried in vacuum.
Synthesis of ZnO NPs
ZnO NPs were synthesized by adopting the procedure reported by Becheri et al.32 Zinc chloride (5.5 g, 40 mmol) was dissolved in 200 mL of distilled water at 90 °C, and 16 mL of 5 M NaOH aqueous solution was then added drop-wise with gentle stirring over a time period of 10 min. ZnO NPs were separated from the supernatant dispersion by sedimentation method (the supernatant solution was discarded) and the remaining suspension was washed with distilled water. The purified particles were treated with 2-propanol in an ultrasonic bath for 10 min at room temperature, collected by centrifugation, and finally maintained at 250 °C for 5 h in a Teflon-lined stainless steel autoclave to obtain the ZnO nanoparticles.
Synthesis of graphene oxide (GO)
Graphene oxide was prepared through oxidation of graphite reported by Hummers et al.33 Graphite powder (0.5 g) and NaNO3 (0.5 g) were mixed in 30 mL of H2SO4 (95%) at temperature (0–5 °C). The reaction mixture was stirred for 30 min at this ice temperature followed by the slow addition of KMnO4 (1.5 g) to the suspension. The addition rate of KMnO4 was controlled cautiously to keep the reaction temperature lower than 15 °C. Then, after ice bath was removed, and reaction mixture was stirred at 35 °C for 7 h until it became pasty brownish and then diluted with 50 mL of water. The reaction temperature was rapidly increased to 98 °C and it was stirred for 6 h, and the colour then changed to a brown colour. This solution was diluted by adding 50 mL water and finally treated with 1 mL H2O2 (30 wt%) to remove excess KMnO4, if any. For purification, the mixture was washed by rinsing and centrifugation with 10% HCl and then deionized (DI) water several times. After filtration and drying under vacuum at room temperature, the GO was obtained as a powder. Further ultrasonic treatment of obtained GO powder leads to the formation of GO nano-sheets.
Synthesis of CdS/ZnO heterostructure
CdS/ZnO heterostructure was prepared by modified one pot hydrothermal method.34 In a typical synthesis, ZnCl2 (4 mmol) was dissolved in 20 mL water at 90 °C, followed by the addition 5 M NaOH solution dropwise with gentle stirring. When the pH of solution reached 7, a white precipitate of Zn(OH)2 appeared. Cd(OOCCH3)2·2H2O (4.0 mmol) was dissolved into 15 mL aqueous solution containing Zn(OH)2 precipitate followed by the addition of 4.0 mmol thioglycolic acid and the reaction mixture was stirred for 30 min. The resulting suspension was transferred to a Teflon-lined stainless steel autoclave in an electronic oven at 140 °C for 48 h. After cooling down to room temperature, the obtained solution was centrifuged and the solid product was washed with water and ethanol. The final product was dried at 70 °C for 5 h in air, resulting in pure CdS/ZnO.
Synthesis of CdS/Al2O3 heterostructure
CdS/Al2O3 binary heterostructure was also synthesized by the single pot hydrothermal method.34 In a typical synthesis, Al(NO3)3·9H2O (4.0 mmol) was dissolved in 20 mL distilled water followed by the addition of aqueous NH3 (to maintain pH 7) and Cd(OOCCH3)2·2H2O (4.0 mmol) under vigorous stirring. After the addition of thioglycolic acid (4.0 mmol), the reaction mixture was stirred at room temperature for 30 min. The resulting suspension was transferred to a Teflon-lined stainless steel autoclave in an electronic oven at 140 °C for 48 h. After cooling down to room temperature, the obtained solution was centrifuged and solid product was washed with water and ethanol. The final product was dried at 70 °C for 5 h in air, resulting in pure CdS/Al2O3.
Loading of GO as co-catalyst with CdS/Oxide photocatalyst
Loading of GO as co-catalyst with CdS/Oxide (CdS/Oxide/GO) can be done by solid state route. Briefly, 0.2 g of as prepared CdS/Oxide was thoroughly ground with 1 wt% of as prepared GO using a mortar and pestle for 30 min. The rationale behind the grinding of CdS/Oxide and GO is to make uniform contact between them. The obtained powder was used to examine the effect of GO on the photocatalytic activity of CdS/Oxide.
Photocatalytic water reduction experiment
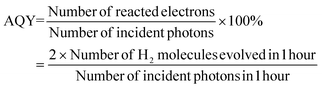
Photocatalytic hydrogen production experiments for CdS NPs, GO, CdS/ZnO/GO and CdS/Al2O3/GO were performed separately in 100 mL double walled quartz round-bottom flasks having a water inlet and outlet to maintain the temperature of the photoreactor and sealed with a silicone rubber septum. The photocatalytic reaction was carried out at room temperature and atmospheric pressure. A 500 W Phoenix tungsten halogen lamp was used as a light source to initiate the photocatalytic reaction. The photocatalyst sample was placed 15 cm away from the lamp. In a typical photocatalytic experiment, 0.2 g of sample was dispersed in 50 mL water containing Na2SO3 (0.25 mol L−1) and Na2S (0.35 mol L−1) as sacrificial reagents. CdS has intrinsic photocorrosion property, therefore, to avoid the photocorrosion reaction the whole experiment was performed under N2 atmosphere in the presence of the sacrificial reagents. The solution containing the photocatalyst was degassed for 30 min and irradiated with visible light accompanied by proper stirring to ensure uniform exposure of the suspension throughout the process. The gas produced was analysed by gas chromatography (Varian CP 3800 GC, Carbosieve S II column), using a thermal conductivity detector (TCD), after passing through moisture and oxygen traps. A schematic presentation of the photochemical reactor setup is shown in Scheme 1. In the absence of either light or the photocatalyst, no hydrogen was detected, suggesting the role of CdS NPs, CdS/ZnO/GO and CdS/Al2O3/GO as a photocatalyst in hydrogen production. The apparent quantum yield (AQY) of the photocatalyst was measured under the same reaction condition and it was calculated using the following equation.35
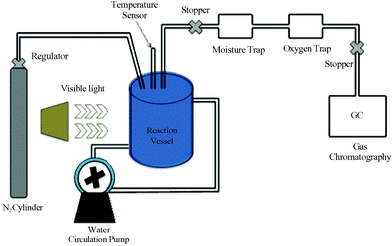 |
| | Scheme 1 Schematic demonstration of photocatalytic hydrogen generation by water reduction. | |
Materials characterization
Powder X-ray diffraction (XRD) measurements were performed to analyse the crystal structure of the material with Brucker D8 X-ray diffractometer having Cu-Kα radiation (λ = 0.15418 nm) source. The data were collected in the 2θ scanning range of 20°–60° with 0.02° steps and counting time of 1 s per step. The size and morphology of photocatalyst samples were studied on a scanning electron microscope (SEM) on an LEO 1430vp instrument operated at 10–15 kV. The EDX analysis was done by INCA, Oxford Instruments, attached to the SEM. Transmission electron microscopy (TEM) observations were performed with a JEOL JEM 2100, using an accelerating voltage of 200 kV. UV-Visible diffuse reflectance spectra (DRS) of the sample were recorded on Jasco V-650 spectrophotometer with an integrating sphere of 150 mm in a range of 200 to 800 nm. The BET surface areas for the samples were analysed by Micromeritics Chemisorb 2720 apparatus.
Result and discussion
Powder X-ray diffraction
Powder X-ray analysis was performed for graphite and GO, in order to confirm the formation of GO (Fig. 1). Raw graphite showed a very strong peak at 2θ = 26.8° (d = 0.33 nm). However, after oxidation this peak of graphite became diminished and a new broad peak appeared at 2θ = 11.5° (d = 0.76 nm), which confirms the formation of GO. The purity and crystalline phase of the hydrothermally synthesized CdS NPs, ZnO NPs, CdS/ZnO and CdS/Al2O3 were analysed by powder X-ray diffraction. The XRD patterns for all these samples are shown in Fig. 2. It is evident from the X-ray diffraction that the as prepared CdS NPs are crystallized in hexagonal structure (JCPDS 06-0314) and ZnO NPs crystallizes in hexagonal wurtzite phase (JCPDS 05-0664). Interestingly, the same diffraction peaks for CdS can also be seen in the diffractograms for CdS/ZnO and CdS/Al2O3, revealing that the crystalline phase of CdS is retained. After the introduction of metal oxide, the XRD peaks of the sample become narrower due to the improved crystallite size of CdS particles and CdS/Oxide nano-hybrid. For further support of our claim, the average crystallite size of CdS NPs, CdS/ZnO and CdS/Al2O3 were calculated by using Debye Scherrer formula for the (101) plane. The average crystallite sizes was found to be 3.98, 3.99 nm and 4.06 nm for CdS NPs, CdS/ZnO and CdS/Al2O3 respectively.
 |
| | Fig. 2 Powder X-ray diffraction pattern for CdS NPs, ZnO NPs, CdS/ZnO and CdS/Al2O3 heterostructure hybrid materials. PXRD confirms the formation of hexagonal phase of CdS in CdS/ZnO and CdS/Al2O3. | |
Materials morphology
In order to investigate the influence of GO on the morphology of CdS/Oxide nanoparticles, Scanning Electron Microscopy (SEM) experiments were performed for all the samples. SEM images of CdS/Oxide and GO loaded CdS/Oxide are shown Fig. S6 and Fig. S7, ESI.† SEM images at different magnifications reveal significant aggregation of the CdS/Oxide nanoparticles which is consistent with the load of GO on CdS/Oxide.
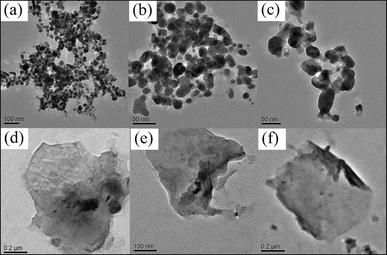
Transmission Electron Microscope (TEM) images of CdS/ZnO and CdS/Al2O3 particles are shown in Fig. 4a and 4d, respectively, which suggest that the nanoparticles are mostly spherical in shape and the size of particles are in the range of 100 nm for both the samples. The high resolution TEM (HR-TEM) image of CdS/ZnO (Fig. 4b) reveals that the crystallized CdS NPs, with the lattice spacing of 0.309 nm corresponding to the (101) plane of hexagonal CdS (JCPDS 06-0314), is directly connected with the (102) plane of the hexagonal ZnO (JCPDS 05-0664) which confirms the formation of a nano-composite. The TEM image of CdS/Oxide/GO (Fig. 4c and 4f) shows that CdS/ZnO nanoparticles are present on the GO sheet which has a characteristic wrinkle on the edge (Fig. 4f).
 |
| | Fig. 4 TEM images of (a) CdS/ZnO, (b) HR-TEM of CdS/ZnO, (c) CdS/ZnO/GO, (d) CdS/Al2O3, (e) HR-TEM of CdS/Al2O3 and (f) CdS/Al2O3/GO. | |
TEM analysis for CdS nanoparticles and GO nano-sheets were also performed (Fig. 5). The TEM images of as-prepared CdS nanoparticles have the particle size of ca. 30 nm (Fig. 5c). TEM analysis of graphene oxide confirms the formation of a two-dimensional sheet-like structure (Fig. 5e) which is wrinkled on the edge.
 |
| | Fig. 5 TEM images of (a–c) as-prepared CdS nanoparticles (d–f) as-prepared graphene oxide. | |
Photocatalytic water reduction for hydrogen production
The hydrogen generation ability of as-synthesized CdS/Oxide/GO was determined by performing photocatalytic water reduction experiment (experimental set up shown in Scheme 1). For comparative study of hydrogen generation with CdS/Oxide/GO, the water reduction experiments for CdS NPs and GO were also performed. The H2 evolution rates under visible light illumination and the surface area of CdS NPs, CdS/ZnO/GO and CdS/Al2O3/GO are shown in Fig. 6. No appreciable hydrogen was detected by GO under visible light radiation. From Fig. 6, the enhanced hydrogen production for CdS/Al2O3/GO was due to the increased surface area; however, for CdS/ZnO/GO the high hydrogen production efficiency is ascribed to the enhanced surface to volume ratio and efficient intersystem charge transfer in comparison with that of the CdS NPs. It should be noted that CdS/Al2O3/GO has high surface area (40 m2 g−1) than CdS/ZnO/GO (28 m2 g−1), but it is the effective charge separation in CdS/ZnO/GO which makes it a more efficient catalyst for photocatalytic hydrogen production.
 |
| | Fig. 6 Amount of hydrogen produced along with the surface area of CdS NPs, CdS/Al2O3/GO and CdS/ZnO/GO photocatalyst under visible light illumination. | |
Based on the reports present in the literature12,37,38 we have proposed a mechanism for enhanced photocatalytic hydrogen production in the case of CdS/ZnO/GO. To elucidate the mechanism of photocatalytic H2 generation by the CdS/ZnO/GO, a schematic illustration of the efficient transfer of electrons along with the band positions of CdS and ZnO, was shown in Scheme 2. Under visible light irradiation, the electrons (e−) get excited from the valance band (VB) to the CB of CdS; nevertheless, no charge formation takes place in the CB of ZnO due to its inactivity under visible light. The CB of CdS (−0.88 eV)4,35 is in close proximity with the CB of ZnO (−0.22 eV)4,37 which facilitates efficient transfer of reductive electrons form the CB of CdS to the CB of ZnO. The reductive electrons in ZnO CB further transfers to the GO because of its high charge carrier mobility, thereby leading to the mobilization of these reductive electrons onto the GO sheet which reduces the recombination rate of photoinduced electrons and holes. Additionally, the unique feature of GO permits the photocatalytic reaction to take place not only on the surface of semiconductor photocatalyst, but also on the GO sheet causing enhanced reaction space. Eventually, these reductive electrons react with the adsorbed H+ ions to produce H2. Meanwhile, the remaining holes are scavenged by the sacrificial reagents (mixture of 0.35 M Na2S and 0.25 M Na2SO3) present in the solution.
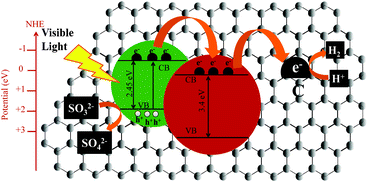 |
| | Scheme 2 Schematic illustration of the charge separation and the transfer of photo-induced charge carriers in CdS/ZnO/GO system under visible light irradiation; the photo-excited electrons transfer from the CB of CdS to the CB of ZnO and from the CB of ZnO to the carbon atoms on the graphene oxide sheets, which are easily reacted with H+ to produce H2. | |
The apparent quantum yield (AQY) for hydrogen generation using CdS/ZnO/GO, CdS/Al2O3/GO and CdS NPs was calculated to be around 30%, 14% and 4%. The AQY for CdS/ZnO/GO was almost two times higher than that of hierarchical CdS@ZnO reported by our group earlier.35 Enhanced hydrogen production rate for CdS/ZnO/GO is mainly attributed to the effective charge separation and extended photo-response in the visible region due to the presence of GO sheet. The advantage of CdS/Oxide/GO photocatalyst is the enhanced hydrogen production rate without addition of any noble metal co-catalyst such as Pt, Pd, Ru, Rh etc., which makes the photocatalytic process inexpensive. The co-catalyst has low band positions due to which the addition of any co-catalyst assists effectual charge separation of electron and holes thereby making the photocatalytic process more efficient. Based on this conviction, CdS/Oxide/GO has been synthesized which has been proven as an efficient photocatalyst by providing large surface area for effective charge transfer and a lower recombination rate of photoinduced charge carriers due to the presence of the GO sheet.
Photocatalytic dye degradation
Along with hydrogen production, CdS/Oxide/GO exhibits excellent photocatalytic activity for the degradation of organic dye. The dye degradation experiments were performed by using CdS NPs, GO and CdS/Oxide/GO photocatalysts with methyl orange as a reference dye. The degradation of dye with these photocatalysts was studied by measuring the concentration of the dye after irradiation with visible light for varying time periods. The concentrations of the active species were measured by monitoring the absorption peak at 464 nm. The absorption spectra of the dye with CdS/Al2O3 and CdS/ZnO in the presence of GO at different time intervals are shown in Fig. 7. The concentration of un-degraded dye relative to its initial concentration (C/C0) after visible irradiation in presence of GO, CdS NPs and CdS/Oxide/GO at different time intervals is shown in Fig. 8. From Fig. 8, the highest degradation of dye was achieved by CdS/ZnO/GO with respect to CdS/Al2O3/GO, CdS NPs and GO. It was observed that the photodegradation of dye follows first order decay kinetics with the photocatalyst, as seen from the apparent first order linear transform ln(C/C0) = −kappt,39 shown in Fig. 8, where C0 and C represent the concentration of dye before and after irradiation respectively, kapp is the apparent first-order reaction rate constant representing the reaction rate and could be calculated from the slope of the plot (Fig. 8).
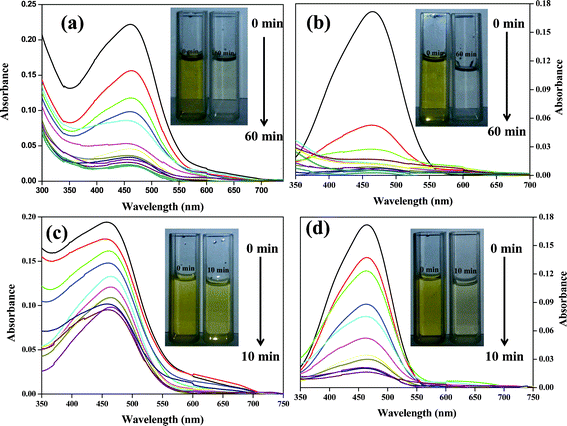 |
| | Fig. 7 UV-Vis absorption spectra of methyl orange with (a) CdS/Al2O3/GO and (b) CdS/ZnO/GO in 60 min interval while (c) CdS/Al2O3/GO and (d) CdS/ZnO/GO in 10 min interval. | |
 |
| | Fig. 8 Evolution of apparent rate versus irradiation time in the presence of GO, CdS/Al2O3/GO and CdS/ZnO/GO photocatalyst within 60 min. | |
The degradation efficiencies (Eff) for GO, CdS/ZnO/GO and CdS/Al2O3/GO were calculated based on the initial and final concentration of the dye.40 It was found that within 10 min of irradiation, 85% and 51% of dye degradation was achieved (Fig. S8, ESI†) whereas, 99% and 90% degradation occurred within 60 min in presence of CdS/ZnO/GO and CdS/Al2O3/GO respectively. The improved efficiency of dye degradation could be mainly attributed to the enhanced surface area for mass transfer and facile charge transfer due to the presence of the GO sheet which is also responsible for the increased hydrogen production rate. The proposed schematic of the mechanism for the degradation of methyl orange by CdS/ZnO/GO is shown in Scheme 3. An additional photochemical reduction of Cr(VI) has been demonstrated to show the versatility of the presented photocatalyst (see ESI†).
 |
| | Scheme 3 Schematic illustration of the charge separation, transfer of electron to graphene oxide sheet and dye degradation mechanism in CdS/ZnO/GO photocatalyst under visible light irradiation. | |
Proposed mechanism for methyl orange dye degradation
The proposed mechanism of dye degradation is shown in Scheme 4 and involves several steps. Irradiation of visible light leads to the formation of electrons in the CB and holes in the VB of semiconductor. The photoinduced electrons in the CB of CdS can get transferred to the CB of ZnO (step 1). The reductive electrons in ZnO CB further transfer to the GO (step 2) which induces the reduction of the molecular oxygen O2 to superoxide radical anion O2˙− (step 3). In aqueous medium, the hole in the VB of CdS oxidizes the water molecule to generate a hydroxyl radical (step 4). The hydroxyl radicals can recombine to form H2O2 (step 5). H2O2 can react with reactive superoxide radical anion to regenerate hydroxyl radical (step 6) which causes the decomposition of the organic dye to carbon dioxide and water (step 7).41
 |
| | Scheme 4 Proposed mechanism for organic dye degradation by CdS/ZnO/GO under visible light irradiation. | |
Conclusions
In summary, we have demonstrated improved photocatalytic activity of CdS/Oxide in the presence of 1 wt% of graphene oxide. CdS/Oxide/GO exhibited enhanced hydrogen production and efficient degradation of organic dye in contrast to CdS/Oxide and CdS NPs itself. The high photocatalytic activity of CdS/Oxide/GO is attributed to the sheet like structure of graphene oxide which provides a large surface area for effective mass transfer and facile charge transfer that reduces the recombination rate of photoinduced charge carriers. Therefore, these results demonstrate the unique feature of graphene oxide which is an excellent material for electron collector and transporter to separate the photogenerated electron hole pairs. The present study opens up new possibilities for the development of highly efficient visible light driven catalyst which can be used for the photocatalytic hydrogen generation and photo degradation of organic dye.
Acknowledgements
The research was supported by Department of Science and Technology (DST), India (SR/S1/IC-25/2009) and Department of Atomic energy, BRNS (2010/37P/11/BRNS). We also thank Dr M. De and Dr G. Krishnamoorthy for providing photocatalytic experimentation facility and Mr. Vinoth for helping with H2 production experiment. Assistance from CIF, IIT Guwahati is acknowledged.
References
- N. Z. Muradov and T. N. Veziroglu, Int. J. Hydrogen Energy, 2008, 33, 6804 CrossRef CAS.
- J. Nowotny and T. N. Veziroglu, Int. J. Hydrogen Energy, 2011, 36, 13218 CrossRef CAS.
- M. R. Hoffmann, S. T. Martin, W. Choi and D. W. Bahnemann, Chem. Rev., 1995, 95, 69 CrossRef CAS.
- A. Kudo and Y. Miseki, Chem. Soc. Rev., 2009, 38, 253 RSC.
- F. E. Osterloh, Chem. Mater., 2008, 20, 35 CrossRef CAS.
- R. M. N. Yerga, M. C. Á. Galván, F. Del Valle, J. A. V. De la Mano and J. L. G. Fierro, ChemSusChem, 2009, 2, 471 CrossRef.
- Q. Xiang, J. Yu and M. Jaroniec, Chem. Soc. Rev., 2012, 41, 782 RSC.
- X. Chen, S. Shen, J. Guo and S. S. Mao, Chem. Rev., 2010, 110, 6503 CrossRef CAS.
- A. Fujishima and K. Honda, Nature, 1972, 238, 37 CrossRef CAS.
- J. H. Carey, J. Lawrence and H. M. Tosine, Bull. Environ. Contam. Toxicol., 1976, 16, 697 CrossRef CAS.
- R. Abe, J. Photochem. Photobiol., C, 2010, 11, 179 CrossRef CAS.
- S. Hotchandani and P. V. Kamat, J. Phys. Chem., 1992, 96, 6834 CrossRef CAS.
- X. Zong, H. J. Yan, G. P. Wu, G. J. Ma, F. Y. Wen, L. Wang and C. Li, J. Am. Chem. Soc., 2008, 130, 7176 CrossRef CAS.
- M. Ashokkumar, Int. J. Hydrogen Energy, 1998, 23, 427 CrossRef CAS.
- P. V. Kamat, J. Phys. Chem. C, 2007, 111, 2834 CAS.
- M. Berr, A. Vaneski, A. S. Susha, J. Rodríguez-Fernández, M. Döblinger, F. Jäckel, A. L. Rogach and J. Feldmann, Appl. Phys. Lett., 2010, 97, 093108 CrossRef.
- Y. Li, J. Du, S. Peng, D. Xie, Go. Lu and S. Li, Int. J. Hydrogen Energy, 2008, 33, 2007 CrossRef CAS.
- L. Amirav and A. P. Alivisatos, J. Phys. Chem. Lett., 2010, 1, 1051 CrossRef CAS.
- Y. Chen, L. Wang, G. (Max) Lu, X. Yao and L. Guo, J. Mater. Chem., 2011, 21, 5134 RSC.
- H. Park, W. Choi and M. R. Hoffmann, J. Mater. Chem., 2008, 18, 2379 RSC.
- Y. B. Wang, J. C. Wu, J. W. Zheng and R. Xu, Catal. Sci. Technol., 2011, 1, 940 CAS.
- Z. Khan, M. Khannam, N. Vinothkumar, M. De and M. Qureshi, J. Mater. Chem., 2012, 22, 12090 RSC.
- K. Woan, G. Pyrgiotakis and W. Sigmund, Adv. Mater., 2009, 21, 2233 CrossRef CAS.
- C. G. Silva and J. L. Faria, ChemSusChem, 2010, 3, 609 CrossRef CAS.
- R. Leary and A. Westwood, Carbon, 2011, 49, 741 CrossRef CAS.
- T. Peng, P. Zeng, D. Ke, X. Liu and X. Zhang, Energy Fuels, 2011, 25, 2203 CrossRef CAS.
- X. An and J. C. Yu, RSC Adv., 2011, 1, 1426 RSC.
- P. Wang, Y. Zhai, D. Wang and S. Dong, Nanoscale, 2011, 3, 1640 RSC.
- X. Zhang, X. Quan, S. Chen and H. Yu, Appl. Catal., B, 2011, 105, 237 CrossRef CAS.
- O. Akhavan, ACS Nano, 2010, 4, 4174 CrossRef CAS.
- E. Gao, W. Wang, M. Shang and J. Xu, Phys. Chem. Chem. Phys., 2011, 13, 2887 RSC.
- A. Becheri, M. Dürr, P. L. Nostro and P. Baglioni, J. Nanopart. Res., 2008, 10, 679 CrossRef CAS.
- W. Hummers and R. Offeman, J. Am. Chem. Soc., 1958, 80, 1339 CrossRef CAS.
- Z. Khan, D. Barpuzary, O. Baswant, S. Sutradhar and M. Qureshi, Mater. Lett., 2011, 65, 1168 CrossRef CAS.
- D. Barpuzary, Z. Khan, N. Vinothkumar, M. De and M. Qureshi, J. Phys. Chem. C, 2012, 116, 150 CAS.
- H. Zhang, X. J. Lv, Y. M. Li, Y. Wang and J. H. Li, ACS Nano, 2010, 4, 380 CrossRef CAS.
- Y. Tak, H. Kim, D. Lee and K. Yong, Chem. Commun., 2008, 4585 RSC.
- J. Hou, Z. Wang, W. Kan, S. Jiao, H. Zhu and R. V. Kumar, J. Mater. Chem., 2012, 22, 7291 RSC.
- X. Li, D. Wang, G. Cheng, Q. Luo, J. An and Y. Wang, Appl. Catal., B, 2008, 81, 267 CrossRef CAS.
- H. Zhang, P. Wu, Y. Li, L. Liao, Z. Fang and X. Zhong, ChemCatChem, 2010, 2, 1115 CrossRef CAS.
- I. K. Konstantinou and T. A. Albanis, Appl. Catal., B, 2004, 49, 1 CrossRef CAS.
|
| This journal is © The Royal Society of Chemistry 2012 |
Click here to see how this site uses Cookies. View our privacy policy here.