DOI:
10.1039/C2RA21413J
(Paper)
RSC Adv., 2012,
2, 11295-11305
Polythiophene-g-poly(dimethylaminoethyl methacrylate) stabilized Au nanoparticles and its morphology tuning by RNA with variation of electronic properties†
Received
11th July 2012
, Accepted 19th September 2012
First published on 20th September 2012
Abstract
The reducing ability of polythiophene-g-poly(dimethylaminoethyl methacrylate) (P) is used to produce Au nanoparticles (NPs), both in pure P and in different P–RNA (R) hybrids. The Au NPs have different morphologies, depending on the composition of P and R in the PRAu composites. The EDXS spectrum indicates the presence of RNA, P, and Au NPs in the composite. The CD spectra indicate a small distortion in the RNA conformation from A helix towards B helix and the FTIR data indicate the existence of π–π and ionic interactions between P and RNA. The Au plasmon band of the PAu composite shows a gradual red shift with increasing RNA concentration and the photoluminescence (PL) intensity of P decreases in the PAu composites. With increasing RNA concentration in the composite, there is more PL-quenching, and the quenching capacity of RNA is higher than that of DNA (D) and bovine serum albumin (BSA, B). The dc-conductivity of the PAu system is ∼6 times higher than that of P and it increases in the PRAu composites by 1–3 orders of magnitude depending on its composition. In the current–voltage (I–V) curve the PR13 hybrid exhibits rectification properties while the PAu nanocomposite exhibits an interesting feature of symmetric negative differential resistance (NDR). The PRAu31 composite (numbers indicate wt ratio of P and R) shows a small degree of NDR behavior, but the PRAu11 and PRAu13 systems do not show such a property. The rectification and NDR properties of the composites are discussed from the band diagram and the density of the state model, respectively.
Introduction
The highly controlled optoelectronic properties of metal nanoparticles (NPs) have created widespread interest for their use in biosensors and biotechnology e.g. diagnostic applications, biological imaging etc.1–3 The unique surface plasmon properties and fluorescence properties4,5 of metal NPs are very much sensitive to the biomolecules such as DNA, RNA, enzymes etc.6,7 Also, the electronic properties of the nanoparticles in the composites with a conducting polymer are encouraging for device fabrication.8,9 Presently, the Au NPs are used in the specific detection of oncogene transcript and are also used to quantify RNA.10 The Au NPs are biocompatible,11 so nanocomposites of Au NPs with RNA would be helpful for the advancement of biotechnology.
Polythiophene and its derivatives are important conjugated polymers due to their semi-conducting nature and have tunable photoluminescence (PL) properties, which promotes their application s in the field of sensors, and optical and electronic devices.12–14 Grafting of a biocompatible hydrophilic monomer, poly(dimethyl aminoethyl methacrylate) (PDMA), on a polythiophene (PT) backbone makes the graft copolymer (PT-g-PDMA) (P) very soluble in water.14 The substituted amino groups are reported to be capable of oxidizing metal ions into nanoparticles,15,16 hence the PT-g-PDMA would have the property of in situ generation and stabilization of metal NPs, facilitating the formation of metal nanocomposites of the conducting polymer. Furthermore, this conducting nanocomposite may exhibit interesting optoelectronic properties due to the presence of a conjugated polymer chain in conjunction with the plasmons of metal nanoparticles.
Negative differential resistance (NDR) is an important phenomenon, found in some physical systems,17–25 and it occurs mostly due to the trapped space-charges reducing the current flow on increasing the voltage. It has many applications, including high frequency oscillators, photo-electric devices, analog to digital converters, logic gate fabrication etc.18–22 This unique NDR property has been observed in the self assembled monolayer (SAM) of a redox molecule,18 monoatomic carbon wires,20 and in some metallic nanoparticles embedded in organic layers.23–25 Different reasons for NDR are attributed to the above cases, e.g. the single electron reduction of the redox molecule causes an increase of charge transfer but the second electron reduction blocks the flow of current in the first system.18 In the second case the current is carried by resonance among the odd carbon atoms in the frame, while for the even carbon atoms it is propagated by electron tunneling,20 showing a higher current. In metal nanoparticles, if charge is trapped on it, the space-charge field inhibits further charge injection, causing NDR.17,21 From our laboratory we have reported the NDR property for Au NPs embedded within polyaniline sulfonic acid (PSA)/RNA hybrid and also for Ag NPs decorated on a graphene oxide sheet using riboflavin.26,27
Here we report a new nanocomposite of PT-g-PDMA (P)/Au NPs showing symmetrical NDR properties. On addition of RNA(R) in the formation of a P/Au nanocomposite, the shape of Au NP has changed and only the P rich nanocomposite exhibits NDR. The PR hybrids with increasing R concentration show good rectification properties. Possible explanations of the NDR and rectification properties are proposed using a density of state model and band diagram, respectively. The photoluminescence intensity of P becomes somewhat quenched in the nanocomposites and the dc-conductivity values of the composites increase in comparison to that of components.
Experimental
Sample
The RNA sample (Sigma Chemicals, USA, product no. R3629-5g, diethyl amino ethanol salt, type IX from Torula Yeast) and HAuCl4·3H2O (Sigma Chemicals, USA) were used as received. The monomer dimethyl aminoethyl methacrylate (DMAEMA) was purified by passing it through a basic alumina column. CuCl was purified by washing with 10% HCl in water followed by methanol and diethyl ether in a Schlenk tube under a nitrogen atmosphere. Dichloromethane (DCM) and chloroform (Loba Chemicals, Mumbai, India) were dried by refluxing over CaH2 followed by distillation. Polythiophene-g-poly(dimethylaminoethyl methacrylate) (P) was prepared in the laboratory following a method reported earlier.14
Preparation of Au NPs on P-RNA hybrid surface
RNA solution (0.02% w/v) was made by dissolving the required amount of RNA in triple distilled water (pH 6.9). An aqueous solution of P (0.05% w/v) was made by dissolving it in the distilled water for an hour to obtain a transparent yellow solution. 0.5 ml of 10−3 M HAuCl4 solution was slowly added to 3 ml of 0.05% P solution, and was allowed to mix for 30 min. The color of the polymer solution slowly changed from yellow to greenish yellow due to in situ formation of Au NPs, using the reducing ability of the –NMe2 group of the polymer. Then the above RNA solution was added in different amounts (Table 1) so that the weight ratios (w/w) of P and RNA are 1![[thin space (1/6-em)]](https://www.rsc.org/images/entities/char_2009.gif) :
:![[thin space (1/6-em)]](https://www.rsc.org/images/entities/char_2009.gif) 3, 1
3, 1![[thin space (1/6-em)]](https://www.rsc.org/images/entities/char_2009.gif) :
:![[thin space (1/6-em)]](https://www.rsc.org/images/entities/char_2009.gif) 1 and 3
1 and 3![[thin space (1/6-em)]](https://www.rsc.org/images/entities/char_2009.gif) :
:![[thin space (1/6-em)]](https://www.rsc.org/images/entities/char_2009.gif) 1, respectively. The resulting solutions were aged for 7 days under a dark cover (pH = 6.7) and were freeze-dried. For morphological and spectroscopic studies these aged solutions were used, and for other studies the freeze-dried samples were used. The samples are designated as PRAu13, PRAu11 and PRAu31; the number indicates the weight ratios of P and RNA, respectively.
1, respectively. The resulting solutions were aged for 7 days under a dark cover (pH = 6.7) and were freeze-dried. For morphological and spectroscopic studies these aged solutions were used, and for other studies the freeze-dried samples were used. The samples are designated as PRAu13, PRAu11 and PRAu31; the number indicates the weight ratios of P and RNA, respectively.
Table 1 Preparation of PRAu nanobiocomposites used in the work
Composition (number indicates P![[thin space (1/6-em)]](https://www.rsc.org/images/entities/char_2009.gif) : :![[thin space (1/6-em)]](https://www.rsc.org/images/entities/char_2009.gif) R (w/w)) R (w/w)) |
Volume (ml) of the component solutions mixed |
| |
P 0.05% (w/w) |
HAuCl4 (M/1000) |
R 0.02% (w/w) |
| PRAu13 |
3.0 |
0.5 |
22.5 |
| PRAu11 |
3.0 |
0.5 |
7.5 |
| PAu31 |
3.0 |
0.5 |
2.5 |
Morphology
The shape and size of the Au NPs were monitored by transmission electron microscopy (TEM JEOL, 2010EX) fitted with a CCD camera. It was operated at an acceleration voltage of 200 kV. A specimen for TEM study was made by spreading a small drop of the above solution on carbon-coated copper grids and allowing the drops to dry in air and finally in vacuum at 30 °C for about 3 days. The electron diffraction experiment was carried out on a nanoparticle and the crystal spacing (dhkl) values were calculated directly by measuring the distance between the opposite spots on the same circumference of the diffraction pattern using Image J software.
Spectroscopy
The CD spectra of the aqueous RNA solution, P solution and 7 days aged P-Au-RNA hybrid solutions were made using a spectro-polarimeter (JASCO, model J-815) in a quartz cuvette (path length 1cm) at 30 °C. The UV-vis spectra were taken in aqueous solutions of the hybrids for different aging times from 190 to 1100 nm, using a UV-vis spectrophotometer (Hewlett-Packard, model 8453) at 30 °C. The FT-IR spectra of the freeze-dried samples were obtained using a Perkin Elmer FT-IR (spectrum 100) instrument. KBr pellets of the solid samples were made to run the scan. Photoluminescence (PL) study of the above solutions was made using a quartz cell of 1 cm path length with a Horiba Jobin Yvon Fluoromax-3 instrument. The solutions were excited at 417 nm and the emission scans were recorded from 440 to 800 nm using a slit width of 2 nm with increments of 2 nm in wavelength for an integration time of 0.1 s.
Conductivity measurement
The dc-conductivities of the above freeze-dried samples were measured by a two-probe method. The sample was placed between two indium-tin oxide (ITO) conducting strips of 1 mm in width placed perpendicularly. The detailed procedure was discussed in our earlier publication.28 The area of the sample was 0.01 cm2 and the thickness of the samples was measured by a screw gauge. The conductivity of the sandwiched samples was measured by an electrometer (Keithley, model 617) at 30 °C using the equation: | |  |
(1)
|
, where ‘l’ is the thickness, ‘a’ is the area and ‘R’ is the resistance.
The current–voltage (I–V) studies were performed using the same samples by varying the voltage from −5 to +5 V and measuring the current at each applied voltage.
Results and discussion
Morphology
The TEM morphology of Au NPs produced in the P and PR hybrids by the reduction of Au3+ on the –NMe2 group of P are presented in Fig. 1. The PAu nanocomposite exhibits a mostly spherical morphology (Fig. 1a) but there is a variation in morphology of Au NPs with PR hybrid composition. The PRAu31 system exhibits a star shaped multipod morphology (Fig. 1b); The PRAu11 system has almost spherical Au NPs (Fig. 1c) and the PRAu13 system exhibits an interconnected morphology of mostly spherical shaped Au NPs (Fig. 1d). The histograms of Au NP sizes are presented in SI Fig. 1† and the average sizes of Au NPs for PAu, PRAu31, PRAu11, PRAu13 are 33 ± 9, 84 ± 16, 32 ± 8, 72 ± 22 nm, respectively. There is no regular trend of Au NP size and size distribution with increase of RNA concentration. The variation of size of Au NPs is usually related to Ostwald ripening or inverse Ostwald ripening;29 but if it is coupled with morphology change due to change in composition of the reaction mixture, the variation in NP size may be primarily related to the cause of variation of morphology; an attempt is made to understand it below.
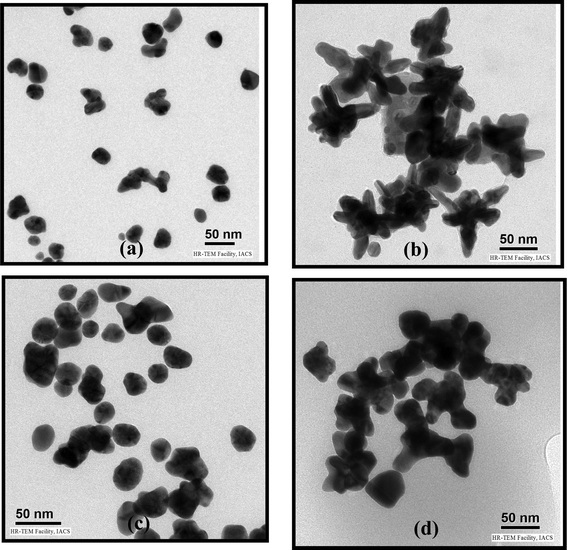 |
| | Fig. 1 TEM images of (a) PAu, (b) PRAu31, (c) PRAu11 and (d) PRAu13 systems. | |
The probable cause of a variation in morphology of Au NPs with PR hybrid composition may be explained as follows. Spherical Au NPs are produced on the P surface, indicating that P is acting both as a reducing agent of Au3+ and also as a stabilizer of Au NPs (Scheme 1). Here Au3+ oxidizes P to cationic P and itself become reduced to Au0, which self assembles to produce Au nanocrystals. The polymer being adsorbed on the Au NP surface through the sulphur–gold interaction30 stabilizes it against agglomeration. In the preparation of nanobiocomposites, P is first mixed with Au3+ solution, producing Au seeds, and then RNA is mixed. The RNA anion interacts with the cationic P, producing the PR hybrid with an excess of either P or R, depending on the composition used. In the PR11 hybrid, presumably the hybrid as a whole acts as a stabilizer, producing the spherical shaped Au NPs. In PR31 the polymer is in excess, producing more Au0 nuclei which cannot grow spherically as the excess P then acts as an impurity at the growth front. Impurities include the excess starting materials that by surface adsorption inhibit the growth of the Au crystals in two ways. (i) The high molecular weight and high viscosity of the polymer are responsible for the large hindrance to the Au-crystal growth for a high thickness of impurities (i.e. large depletion layer) due to its difficulty of diffusion and it may influence the formation of the almost star shape morphology of Au NPs (dendritic).31–34 (ii) The Au seed is protected by the polymer chain preferentially in particular facets causing faster growth in another plane.35 The HRTEM image (SI Fig. 2a†) shows the fringe pattern for the (200) Miller plane (2.08 Å) of the PRAu13 system and it may be argued that the crystal growth occurs preferentially through the (200) plane. This anisotropic growth may be attributed to the strong intrinsic crystalline anisotropy of the Au single crystals.35
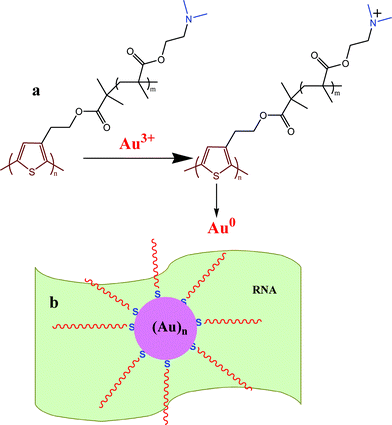 |
| | Scheme 1 (a) Formation of Au NPs by reduction with the –NMe2 group of P and (b) stabilization of Au NPs on the RNA template. | |
When there is excess RNA, it acts as an impurity, but the thickness of the depletion layer is not large compared to that of excess P, causing less protuberance. This is for the ionic nature of RNA, making it better attracted by the water dipole, causing easier depletion. But this is not possible for P because its grafted part (PDMAEMA) has some affinity to water, but the thiophene main chain has a strong hydrophobic nature, causing a brush-like structure.36 Hence, it experiences great difficulty in depleting from the crystal growth front due to both the unfavorable interaction from the water dipole and its bulkier morphology. Thus the variation in RNA concentration causes different Au nanocrystal morphologies in the composites, due to the variation in size of the depletion layer. The structure of Au NPs is investigated from the electron diffraction pattern (SI Fig. 2b†), and from the concentric circular diffraction ring of SI Fig. 2b† the Miller planes of Au NPs for (311) (1.25 Å), (220) (1.45 Å), (111) (2.38 Å) and (200) (2.08 Å) are observed. The EDXS spectrum of PRAu11 composites measured by a TEM instrument is shown in Fig. 2. Here the peaks for gold, carbon, nitrogen, oxygen, phosphorus, chlorine and sulfur are clearly observed, indicating the presence of RNA, chloride (from HAuCl4) and PT-g-PDMA, along with the Au NPs in the composite.
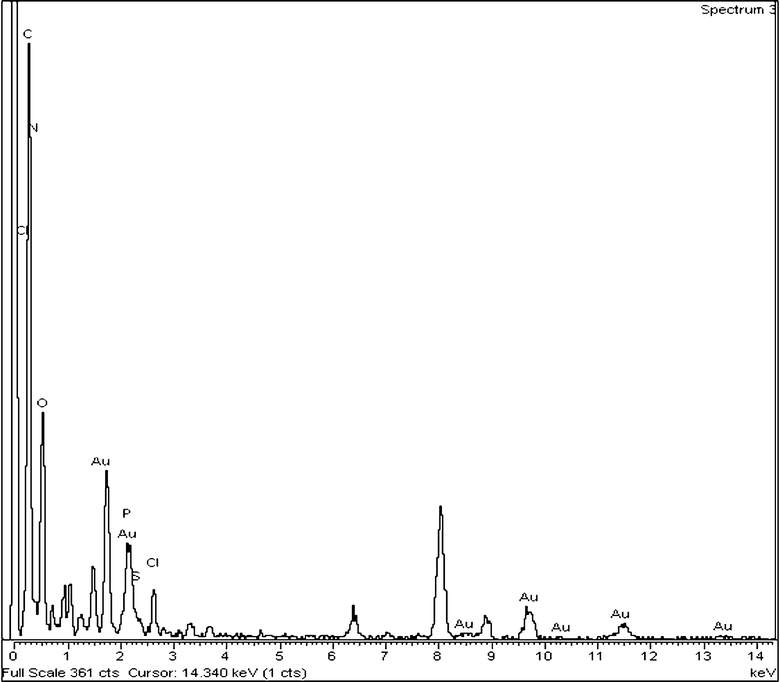 |
| | Fig. 2 EDXS pattern of the PRAu11 composite showing the presence of Au, P and RNA in the composite. | |
CD-spectra
The normalized CD spectra of 7 days aged hybrid solutions are presented in SI Fig. 3.† RNA has a small positive peak at 221nm, a large negative peak at 239 nm and a strong positive peak at 271 nm, characterizing the RNA used as A-RNA.37 The intensity of the 271 nm peak of RNA is somewhat reduced in the nanobiocomposites and the peak position is also shifted to 277 nm with increasing P concentration. These results indicate a small distortion in the RNA conformation from A helix towards B helix and may imply that the narrow major groove of the regular A helix may be widened on binding with P in the nanobicomposites.37–40
FTIR spectra
The molecular interaction between polymer (P) and RNA are investigated from the P subtracted FTIR spectra (SI Fig. 4a†). Pure RNA has peaks at 813 and 861 cm−1 corresponding to the ribose phosphate vibration of A-RNA.41–45 The 1240 cm−1 peak corresponds to the asymmetric stretching frequency of the P![[double bond, length as m-dash]](https://www.rsc.org/images/entities/char_e001.gif) O group of RNA, and in the PR hybrids the 813 cm−1 peak has shifted to 800 cm−1 and the 861 cm−1 peak is shifted to 871cm−1. The 1240 cm−1 peak has shifted to 1224 and 1219 cm−1 for the PR13 and PR11 hybrids. This result indicates a transfer of a lone pair of electrons from the nitrogen atom of the dimethyl amino group of P to the phosphorous atom of the phosphate group, developing an ionic interaction between them. But in the nanobiocomposites (SI Fig. 4b†) the 813 cm−1 peak of ribose phosphate remains unchanged, the 861 cm−1 peak shows a blue shift to 871 cm−1 and the 1240 cm−1 peak has shifted to 1222 cm−1, indicating ionic bond formation between the phosphate anion of RNA and the cationic amino group of P. The in-plane vibration of cytosine at 1480 cm−1 is shifted to the lower frequency (1422 cm−1), due to the π–π interaction of P with the cytosine base of RNA. The peaks at 1600–1700 cm−1 are also due to the in plane vibration of uracil (U), guanine (G), adenine (A) and cytosine (C) bases of RNA and the peaks are shifted to the lower frequency (e.g. 1638 cm−1), indicating that the π clouds of the U, G, A, and C bases are somewhat delocalized by the π–π interaction through the π clouds of the P rings. So, from the FTIR data the existence of ionic interactions between cations of P and the phosphate anions of RNA and also the π–π interactions are evident (Scheme 2). In SI Fig. 4c† the RNA subtracted FTIR spectra of the composite is presented. P has peaks at 1400–1200 cm−1 due to the C–N bond vibration, but in the hybrids these peaks shift from 1400 to 1380 cm−1 and 1271 to 1234 cm−1. Due to the formation of the Au NPs, the cationic amine group of P formed on oxidation produces an ionic complex with the RNA molecule.
O group of RNA, and in the PR hybrids the 813 cm−1 peak has shifted to 800 cm−1 and the 861 cm−1 peak is shifted to 871cm−1. The 1240 cm−1 peak has shifted to 1224 and 1219 cm−1 for the PR13 and PR11 hybrids. This result indicates a transfer of a lone pair of electrons from the nitrogen atom of the dimethyl amino group of P to the phosphorous atom of the phosphate group, developing an ionic interaction between them. But in the nanobiocomposites (SI Fig. 4b†) the 813 cm−1 peak of ribose phosphate remains unchanged, the 861 cm−1 peak shows a blue shift to 871 cm−1 and the 1240 cm−1 peak has shifted to 1222 cm−1, indicating ionic bond formation between the phosphate anion of RNA and the cationic amino group of P. The in-plane vibration of cytosine at 1480 cm−1 is shifted to the lower frequency (1422 cm−1), due to the π–π interaction of P with the cytosine base of RNA. The peaks at 1600–1700 cm−1 are also due to the in plane vibration of uracil (U), guanine (G), adenine (A) and cytosine (C) bases of RNA and the peaks are shifted to the lower frequency (e.g. 1638 cm−1), indicating that the π clouds of the U, G, A, and C bases are somewhat delocalized by the π–π interaction through the π clouds of the P rings. So, from the FTIR data the existence of ionic interactions between cations of P and the phosphate anions of RNA and also the π–π interactions are evident (Scheme 2). In SI Fig. 4c† the RNA subtracted FTIR spectra of the composite is presented. P has peaks at 1400–1200 cm−1 due to the C–N bond vibration, but in the hybrids these peaks shift from 1400 to 1380 cm−1 and 1271 to 1234 cm−1. Due to the formation of the Au NPs, the cationic amine group of P formed on oxidation produces an ionic complex with the RNA molecule.
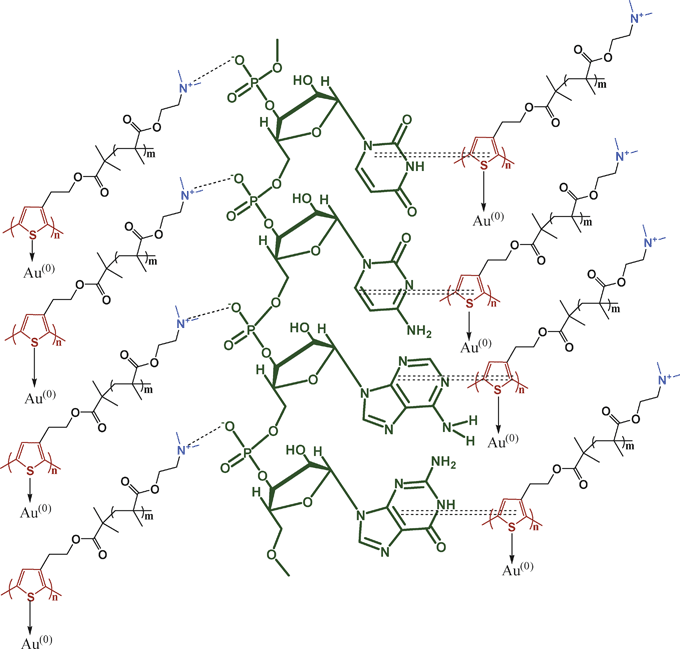 |
| | Scheme 2 Schematic illustration of interactions in PRAu composites ionic and π–π interactions (ionic interaction: dashed lines; π–π interaction: double dashed lines). | |
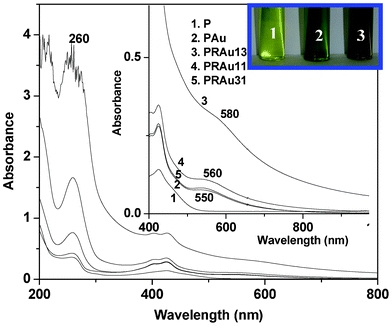 |
| | Fig. 3 UV-vis spectra of P, PAu, PRAu13, PRAu11 and PRAu31 (inset: enlarged spectra and color change of the indicated solutions). | |
Photoluminescence (PL) spectra
The synthesized P graft copolymer is fluorescent and is soluble in water, extending its applications in aqueous based sensing systems. In aqueous solution this graft copolymer forms a micellar type structure with a polythiophene chain at the core and PDMA chains at the surface.36 It is also known that cationic polythiophene is fluorescent, and leads to efficient energy transfer to the neighboring acceptor.14,47–49Fig. 4a shows the PL spectra of different hybrid solutions and the normalized PL intensity shows a gradual decrease with the formation of Au NPs and also with increasing RNA concentration in the composite. It is well known from the theoretical and experimental results that Au NPs are a kind of “super quencher” quenching the fluorescence of a range of dyes primarily arising from nonradiative energy transfer from the dye to the metal.7,50–52 From the figure it is evident that the PL intensity of the PAu solution decreases from that of the P solution because of energy transfer from P to Au NPs. P generates a cation on the dimethyl amino nitrogen due to oxidation by Au3+ ions, so the PAu system easily interacts with the negatively charged RNA to form the PRAu complex, causing a further decrease in PL intensity for the exciton energy transfer to the RNA molecule. It is also evident from the figure that on increasing the RNA concentration the quenching of the PL intensity and red shifting of the emission peak are more pronounced because the exciton is more stabilized by the RNA bases. The thiophene chain may also become more extended due to the presence of increased numbers of RNA templates causing the red shift. It is to be noted that this observation is quite different from that of PSA/RNA/Au nanobiocomposites where an increase of PL intensity from that of the PAu composite has been observed for all compositions of the nanobiocomposites, due to stabilization of excitons in different benzonoid–quinonoid energy states of PSA.26
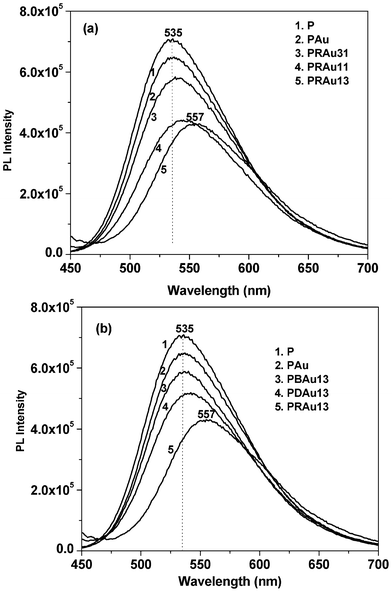 |
| | Fig. 4 Photoluminescence spectra of (a) P, PAu and different PRAu composite solutions, (b) P, PAu and PBAu13, PDAu13, PRAu13 composite solutions at 30 °C for the same P content in each solution. | |
Fig. 4b shows the fluorescence spectra of the PAu complex with different biomolecules (e.g. bovine serum albumin (BSA), DNA and RNA) at identical concentrations. It is important to note that in every case there is a PL-quenching, and the fluorescence-quenching capability of RNA is greater than those of DNA and BSA. The main reason for the highest decrease occurring with RNA is for the single stranded nature of RNA with a larger surface area providing a greater number of interacting sites to bind with P than those in DNA or BSA.
Dc-conductivity
In Table 2 the dc-conductivity values of P, R, PAu, PR hybrids and PRAu nanocomposites measured at 30 °C are presented. P and R have very low conductivity (1.0 × 10⁻⁹ and 1.6 × 10⁻⁹ S cm−1) due to their large band gap and the localized π-electrons, respectively, but the conductivity of the PAu system is ∼6 times higher than that of P because the Au NPs help in the hopping process for charge conduction in the composite. In PRAu nanobiocomposites the conductivity values are higher from PR hybrids and also from the PAu nanocomposite. The same conductivity of different PR hybrids and also the same value with those of components suggests that PR hybrid formation does not cause doping of P. The higher conductivity values of PRAu nanocomposites compared to PR hybrids and the PAu nanocomposite suggest doping of P helps RNA to bind more tightly through ionic interactions. Amongst the nanobiocomposites PRAu31 has the highest conductivity value because of the star like morphology of Au NPs, as charge hopping is easier here than for other morphologies of Au NPs (cf.Fig. 1) due to the larger surface area.
Table 2 Dc-conductivity at 30 °C of R, P, PAu and different hybrids and composites
| Sample |
S cm−1 |
Sample |
S cm−1 |
Sample |
S cm−1 |
| P |
1.0 × 10⁻⁹ |
PR13 |
1.4 × 10⁻⁹ |
PRAu13 |
4.2 × 10⁻⁸ |
| R |
1.6 × 10⁻⁹ |
PR11 |
1.0 × 10⁻⁹ |
PRAu11 |
2.1 × 10⁻⁷ |
| PAu |
6.7 × 10⁻⁹ |
PR31 |
1.0 × 10⁻⁹ |
PRAu31 |
1.4 × 10⁻⁶ |
Current (I)–voltage (V) characteristics
The I–V characteristic curves of RNA and P (Fig. 5) exhibit a negative hysteresis behavior, probably because of the existence of some trapped charges in the above molecules. The hysteresis is greater in RNA than in P because of its diethyl ammonium ethanol salt, and the smaller hysteresis arising in P is probably due to charge trapping by the conjugated thiophene units. The PR hybrids indicate interesting I–V plots having rectification properties, which changes with PR composition. PR13 shows an asymmetric plot and exhibits rectification behavior with a maximum rectification ratio of 2.8 at 4.5 V. PR11 and PR31 show maximum rectification ratios 1.8 and 1.3 at 4.2 and 2 V, respectively (SI Fig. 5†). A probable reason for the rectification behavior is due to the charge transfer from the –NMe2 group of P to the phosphorous atom of the phosphate group, making the polymer a p-type semiconductor; and RNA, by accepting the electron, transforms into an n-type semiconductor. This causes a good distribution of p–n junctions in the system, causing the rectification property.
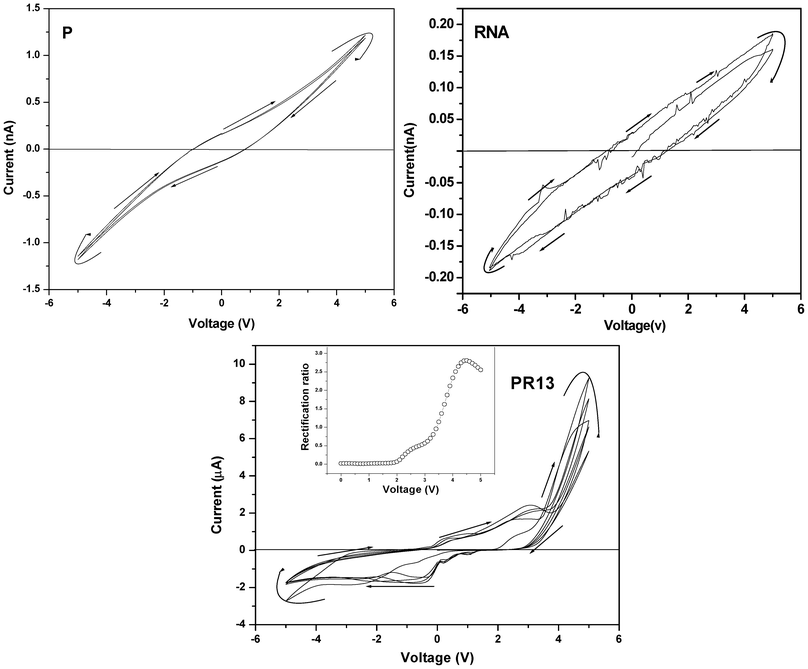 |
| | Fig. 5 Current–voltage (I–V) characteristic curves of P, RNA and PR13 hybrids (inset: plot for rectification ratio vs. voltage (V) of the respective samples). | |
The rectification property of the PR13 system may be understood from the band diagram (Fig. 6). The work function of ITO is 4.9 eV and the optical band gap of P is 2.9 eV, obtained from the UV-vis spectra (Fig. 3). The lowest unoccupied molecular orbital (LUMO) and highest occupied molecular orbital (HOMO) of double stranded RNA are reported to be 3.11 and 3.75 eV.53 Approximating the same values of LUMO and HOMO for single stranded RNA, the band diagram of the PR mixture is drawn (Fig. 6). At a positive bias (Fig. 6a), the Fermi level of ITO moves to resonate with the LUMO of P at (4.9–4.5) = 0.4 V, as the maximum rectification ratio occurs at 4.5 V. The energy of the HOMO of P is (2.9 + 0.4) = 3.3 eV. The HOMO level of RNA is higher than that of ITO so electrons flow easily from the RNA to the right ITO electrode. Hence, the electron flows from the left ITO electrode (Fig. 6a) to the HOMO of P and then it transits through the p–n junctions of the PR hybrid and finally reaches the right ITO electrode, showing a very high current. In negative bias an electron can move easily from P to the left ITO (Fig. 6b), but electrons from the right ITO face a large barrier to reach the LUMO of RNA. Hence the current is much lower in the negative bias. The decrease of the rectification ratio with decrease in RNA concentration in the PR hybrids is probably due to the decreased concentrations of p–n junctions produced at these compositions.
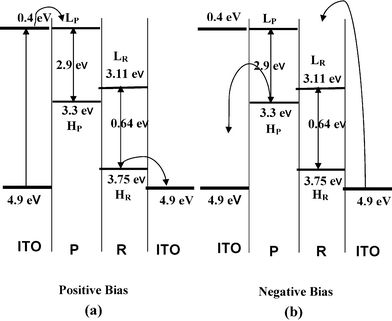 |
| | Fig. 6 Energy band diagram of the P/R junction for two different bias directions. Bias is applied with respect to the left ITO electrode (in both positive and negative bias, H and L indicate HOMO and LUMO of respective components). Curved arrows represent electron transfer. All energy levels are drawn with respect to vacuum level (E = 0). | |
The PAu nanocomposite exhibits an interesting feature of symmetric negative differential resistance (NDR), showing a peak around 2.8 V for the PAu system (Fig. 7). This may be due to the fact that during the preparation of Au NPs a large amount of charge is adsorbed on Au NPs and at a higher voltage it releases the charges completely, giving almost zero current. In the subsequent runs the accumulation of charge in the forward bias on the Au surface increases, causing higher NDR ratios (the ratio of peak and valley current) e.g. at the first run it is 26 which increases to 64 at the third run where it becomes constant. Probably at the third run the Au NPs attain a saturation in absorption of charge being stabilized by the polythiophene conjugated chain.
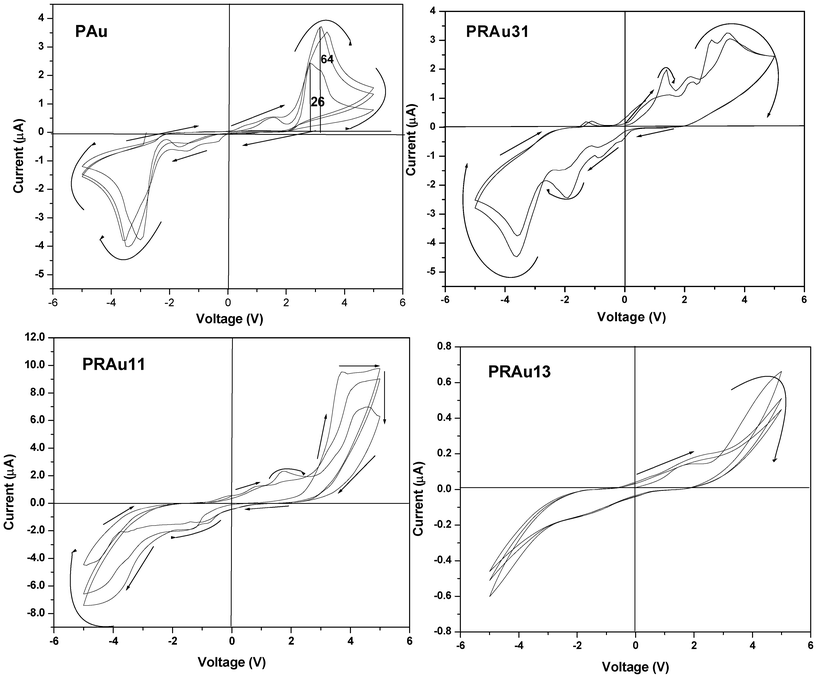 |
| | Fig. 7 Current–voltage (I–V) characteristic curves of PAu and PRAu nanocomposites of different compositions. | |
To understand the NDR property a schematic model of density of states (DOS) of the two electrodes and the PAu nanocomposites under different bias voltages is illustrated in Fig. 8a–c.54,55 The green and blue rectangles represent the valence and conduction bands of the two ITO electrodes, respectively, and the two red lines between them indicate the positions of the LUMO and HOMO for the PAu composite. For simplicity, here we just consider the two orbitals of the PAu system. The DOS of these three parts (two electrodes and PAu) are the same as shown in Fig. 8a at zero applied voltage (denoted by dotted lines). The rectangles represented as DOS of the electrodes shift up and down with applied bias for left and right electrodes, respectively. Here, we assume that the positions of the HOMO and LUMO in the composite do not change with the applied bias voltages, and at the non-zero bias voltage the HOMO and LUMO of the PAu composite match the valence and conduction bands of the left and right electrodes, respectively (Fig. 8b). Thus, at this moment the LUMO of the composite just catches the upper edge of the conduction band of the right electrode, causing the transport of both hole and electron. On further increase of bias voltage (Fig. 8c), the current cannot increase as there is no overlap between the conduction band of the right electrode and the LUMO of the scattering region, so here current decreases with an increase in bias voltage showing the NDR.
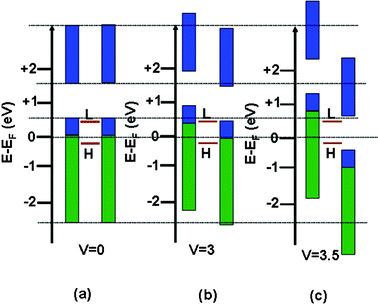 |
| | Fig. 8 (a)–(c) Schematic illustration for the NDR phenomenon using the density of state (DOS) approach. The blue and green rectangles represent the DOS of the two electrodes (left and right), and the two brown lines in between indicate the positions of the HOMO and LUMO of the PAu nanocomposite with different bias voltages (Fermi energy is set to zero in all cases). | |
The PRAu nanobiocomposites show different I–V properties (Fig. 7) at different compositions, e.g. the PRAu31 system shows semiconducting behavior with small NDR behavior at a bias voltage of ∼3.5 V. But the PRAu11 and PRAu13 systems do not exhibit NDR behavior, rather they exhibit only semiconducting behavior with a larger hysteresis compared to that of the PRAu13 system. A probable cause of the NDR property in the PRAu31 system may be the higher polymer, concentration where the charge is trapped in the conjugated polythiophene chain through the Au NPs, which exhibit a typical star like morphology facilitating the accumulation of space charge. The band diagram of this system would be of a similar type (Fig. 8), explaining the NDR property. It is necessary to mention here that the PSA/Au nanocomposite did not exhibit the NDR property, but its composites with RNA exhibit NDR properties at polymer rich compositions.26 The reasons in the two systems are different, in the present system the charges of AuNPs are stabilized through the polythiophene conjugated chain, while in the PSA/RNA/Au system the charges of AuNPs are stabilized through the RNA bases, hindering the flow of current with increase in voltage.
Conclusion
Au NPs are produced in the P and PR hybrids due to reduction of Au3+ by the –NMe2 group of P and have different morphologies depending on the composition of the PR hybrid. The EDXS spectrum and HRTEM image of nanobiocomposites indicate the presence of RNA, P, Cl and Au NPs in the composite. The CD spectra indicate a small distortion in the RNA conformation from A helix towards B helix and the FTIR data indicates the existence of π–π interactions and ionic interactions between the cations of P and the phosphate anions of RNA. The Au plasmon band at 550 nm for PAu shows a gradual red shift with increasing RNA concentration, due to the stabilization of Au plasmons with the π-clouds of RNA bases. The polymer P has good PL properties but its intensity decreases in the PAu composite. With increasing RNA concentration in the composite, there is PL-quenching, and the PL-quenching capability of RNA is greater than that of DNA and BSA. The dc-conductivity of the PAu system is ∼6 times higher than that of P because the Au NPs help in the hopping process for charge conduction in the composite. This is also true for the PRAu nanobiocomposites, where the conductivity values are 1–3 orders of magnitude higher than those of PR hybrids, depending on their composition. PR13 shows an asymmetric I–V plot and exhibits rectification behavior with a maximum rectification ratio of 2.8 at 4.5 V. The PAu nanocomposite exhibits an interesting feature of symmetric negative differential resistance (NDR), showing a peak around 2.8 V for the PAu system. The PRAu nanobiocomposites show different I–V properties at different compositions, e.g. the PRAu31 system shows semiconducting behavior with small NDR behavior at a bias voltage of ∼3.5 V, but the PRAu11 and PRAu13 systems do not show NDR behavior. The rectification and NDR properties of the hybrids and the composites have been interpreted from the band diagram and the density of state models, respectively.
Acknowledgements
We acknowledge the DST Unit of Nanoscience at IACS for financial support and S. D. acknowledges the DST Inspire program for providing the fellowship.
References
- W. T. Al-Jamal, K. T. Al-Jamal, P. H. Bomans, P. M. Frederik and K. Kostarelos, Small, 2008, 4, 1406 CrossRef CAS.
- P. Alivisatos, Nat. Biotechnol., 2004, 22, 47 CrossRef CAS.
- I. H. El-Sayed, X. Huang and M. A. El-Sayed, Nano Lett., 2005, 5, 829 CrossRef CAS.
- M. Bruchez Jr, M. Moronne, P. Gin, S. Weiss and A. P. Alivisatos, Science, 1998, 281, 2013 CrossRef CAS.
- W. C. W. Chan and S. Nie, Science, 1998, 281, 2016 CrossRef CAS.
- P. Routh, P. Mukherjee and A. K. Nandi, J. Mater. Chem., 2010, 20, 7214 RSC.
-
(a) J. Zhang, L. Wang, H. Zhang, F. Boey, S. Song and C. Fan, Small, 2010, 6, 201 CrossRef CAS;
(b) H. Pei, F. Li, Y. Wan, M. Wei, H. Liu, Y. Su, N. Chen, Q. Huangand and C. Fan, J. Am. Chem. Soc., 2012, 134, 11876 CrossRef CAS.
- P. Mukherjee and A. K. Nandi, J. Mater. Chem., 2009, 19, 781 CAS.
- B. K. Kuila, A. Garai and A. K. Nandi, Chem. Mater., 2007, 19, 5443 CrossRef CAS.
- S. I. Dworetzky and C. M. Feldherr, J. Cell Biol., 1988, 106, 575 CrossRef CAS.
- J. Conde, J. M. de la Fuente and P. V. Baptista, J. Nanobiotechnol., 2010, 8, 1 CrossRef.
- A. Okamoto, K. Tanaka and I. Saito, J. Am. Chem. Soc., 2004, 126, 9458 CrossRef CAS.
- T. Gupta and M. E. van der Boom, Angew. Chem., Int. Ed., 2008, 47, 5322 CrossRef CAS.
- S. Samanta, S. Das, R. K. Layek, D. P. Chatterjee and A. K. Nandi, Soft Matter, 2012, 8, 6066 RSC.
-
(a) S. Manna, S. K. Batabyal and A. K. Nandi, J. Phys. Chem. B, 2006, 110, 12318 CrossRef CAS;
(b) J. D. S. Newman and G. J. Blanchard, Langmuir, 2006, 22, 5882 CrossRef CAS;
(c) J. D. S. Newman and G. J. Blanchard, J. Nanopart. Res., 2007, 9, 861 CrossRef CAS.
- S. Samanta, D. P. Chatterjee, S. Manna, A. Mandal, A. Garai and A. K. Nandi, Macromolecules, 2009, 42, 3112 CrossRef CAS.
-
(a) Y. Du, H. Pan, S. Wang, T. Wu, Y. P. Feng, J. Pan and A. T. S. Wee, ACS Nano, 2012, 6, 2517 CrossRef CAS;
(b) H. Xia, H. J. Chung, C.-H. Sow and H. S.-O. Chan, J. Nanosci. Nanotechnol., 2010, 10, 4 CrossRef.
- J. Chen, M. A. Reed, A. M. Rawlett and J. M. Tour, Science, 1999, 286, 1550 CrossRef CAS.
- J. Chen, W. Wang, M. A. Reed, A. M. Rawlett, D. W. Price and J. M. Tour, Appl. Phys. Lett., 2000, 77, 1224 CrossRef CAS.
- J. C. Scott and L. D. Bozano, Adv. Mater., 2007, 19, 1452 CrossRef CAS.
- K. H. Khoo, J. B. Neaton, Y. W. Son, M. L. Cohen and S. G. Louie, Nano Lett., 2008, 8, 2900 CrossRef CAS.
- S. W. Lee, A. Kornblit, D. Lopez, S. V. Rotkin, A. A. Sirenko and H. Grebel, Nano Lett., 2009, 9, 1369 CrossRef CAS.
- L. Ma, S. Pyo, J. Ouyang, Q. Xu and Y. Yang, Appl. Phys. Lett., 2003, 82, 1419 CrossRef CAS.
-
(a) L. D. Bozano, B. W. Kean, V. R. Deline, J. R. Salem and J. C. Scott, Appl. Phys. Lett., 2004, 84, 607 CrossRef CAS;
(b) L. D. Bozano, B. W. Kean, M. Beinhoff, K. R. Carter, P. M. Rice and J. C. Scott, Adv. Funct. Mater., 2005, 15, 1933 CrossRef CAS.
- E. D. Mentovich, I. Kalifa, A. Tsukernik, A. Caster, N. Rosenberg-Shraga, H. Marom, M. Gozin and S. Richter, Small, 2008, 4, 55 CrossRef CAS.
- P. Routh, A. Garai and A. K. Nandi, Phys. Chem. Chem. Phys., 2011, 13, 13670 RSC.
- P. Routh, R. K. Layek and A. K. Nandi, Carbon, 2012, 50, 3422 CrossRef CAS.
- A. Dawn and A. K Nandi, J. Phys. Chem. B, 2006, 110, 18291 CrossRef CAS.
-
(a) M. A. Uppal, A. Kafizas, T. H. Lim and I. P. Parkin, New J. Chem., 2010, 34, 1401 RSC;
(b) D. Lee, S. Park, J. K. Lee and N. Hwang, Acta Mater., 2007, 55, 5281 CrossRef CAS;
(c) S. I. Stoeva, A. B. Smetana, C. M. Sorensen and K. J. Klabunde, J. Colloid Interface Sci., 2007, 309, 94 CrossRef CAS;
(d) B. L. V. Prasad, S. I. Stoeva, C. M. Sorensen and K. J. Klabunde, Chem. Mater., 2003, 15, 935 CrossRef CAS;
(e) B. L. V. Prasad, S. I. Stoeva, C. M. Sorensen and K. J. Klabunde, Langmuir, 2002, 18, 7515 CrossRef CAS.
-
(a) Y. J. Jung, P. Govindaiah, T.-J. Park, S. J.Lee, D. Y. Ryu, J.H. Kim and I. W.Cheong, J. Mater. Chem., 2010, 20, 9770 RSC;
(b) C. Lu, N. Wu, X. Jiao, C. Luo and W. Cao, Chem. Commun., 2003, 1056 RSC.
-
(a) H. D. Keith and F. J. Padden, J. Appl. Phys., 1963, 34, 2409 CrossRef CAS;
(b)
D. C. Bassett, Principles of Polymer Morphology, Cambridge University Press, London, 1981 Search PubMed.
- S. Chen, Z. L. Wang, J. Ballato, S. H. Foulger and D. L. Carroll, J. Am. Chem. Soc., 2003, 125, 16186 CrossRef CAS.
- E. Hao, R. C. Bailey, G. C. Schatz, J. T. Hupp and S. Li, Nano Lett., 2004, 4, 327 CrossRef CAS.
-
(a) C. L. Nehl, H. Liao and J. H. Hafner, Nano Lett., 2006, 6, 683 CrossRef CAS;
(b) P. Mukherjee and A. K. Nandi, J. Colloid Interface Sci., 2011, 356, 145 CrossRef CAS.
-
(a) X. K. Meng, S. C. Tang and S. Vongehr, J. Mater. Sci. Technol., 2010, 26, 487 CrossRef CAS;
(b) M. Pan, H. Sun, J. W. Lim, S. R. Bakaul, Y. Zeng, S. Xing, T. Wu, Q. Yanc and H. Chen, Chem. Commun., 2012, 48, 1440 RSC.
- M. Wang, S. Zou, G. Guerin, L. Shen, K. Deng, M. Jones, G. C. Walker, G. D. Scholes and M. A. Winnik, Macromolecules, 2008, 41, 6993 CrossRef CAS.
- P. Routh, P. Mukherjee, A. Dawn and A. K. Nandi, Biophys. Chem., 2009, 143, 145 CrossRef CAS.
- H. Arakawa, J. F. Neault and H. A. Tajmir-Riahi, Biophys. J., 2001, 81, 1580 CrossRef CAS.
- A. U. Metzger, T. Schindler, D. Willbold, M. Kraft, C. Steegborn, A. Volkmann, R. W. Frank and P. Rosch, FEBS Lett., 1996, 384, 255 CrossRef CAS.
- R. Tan and A. D. Frankel, Biochemistry, 1992, 31, 10288 CrossRef CAS.
-
T. G. Spiroeditor, Biological Application of Raman Spectroscopy, John Wiley and Sons, New York, 1987 Search PubMed.
- D. M. Loprete and K. A. Hartman, Biochemistry, 1993, 32, 4077 CrossRef CAS.
- E. B. Starikov, M. A. Semenov, V. Y. Maleev and A. I. Gasan, Biopolymers, 1991, 31, 255 CrossRef CAS.
- L. E. Prevette, T. E. Kodger, T. M. Reineke and M. L. Lynch, Langmuir, 2007, 23, 9773 CrossRef CAS.
- H. Arakawa, R. Ahmad, M. Naoui and H.-A. Tajmir-Riahi, J. Biol. Chem., 2000, 275, 10150 CrossRef CAS.
-
(a) R. C. Jin, Y. W. Cao, C. A. Mirkin, K. L. Kelly, G. C. Schatz and J. G. Zheng, Science, 2001, 294, 1901 CrossRef CAS;
(b) P. V. Kamat, J. Phys. Chem. B, 2002, 106, 7729 CrossRef CAS;
(c) I. Pastoriza-Santos and L. M. Liz-Marzan, Nano Lett., 2002, 2, 903 CrossRef CAS;
(d) A. Henglein and D. Meisel, Langmuir, 1998, 14, 7392 CrossRef CAS;
(e) S. Link and M. A. El-Sayed, J. Phys. Chem. B, 1999, 103, 4212 CrossRef CAS.
- H.-A. Ho, M. Boissinot, M. G. Bergeron, G. Corbeil, K. Dore, D. Boudreau and M. Leclerc, Angew. Chem., Int. Ed., 2002, 41, 1548 CrossRef CAS.
- H. Guan, M. Cai, L. Chen, Y. Wang and Z. He, Luminescence, 2010, 25, 311 CrossRef CAS.
- M. B. Abérem, A. Najari, H.-A. Ho, J.-F. Gravel, P. Nobert, D. Boudreau and M. Leclerc, Adv. Mater., 2006, 18, 2703 CrossRef.
- C. S. Yun, A. Javier, T. Jennings, M. Fisher, S. Hira, S. Peterson, B. Hopkins, N. O. Reich and G. F. Strouse, J. Am. Chem. Soc., 2005, 127, 3115 CrossRef CAS.
- E. Dulkeith, M. Ringler, T. A. Klar, J. Feldmann, A. M. Javier and W. J. Parak, Nano Lett., 2005, 5, 585 CrossRef CAS.
- R. R. Chance, A. Prock and R. Silbey, Adv. Chem. Phys., 1978, 37, 1 CrossRef CAS.
- T. Natsume, Y. Ishikawa, K. Dedachi, T. Tsukamoto and N. Kurita, Chem. Phys. Lett., 2007, 434, 133 CrossRef CAS.
- M. Wang and C. M. Li, Phys. Chem. Chem. Phys., 2011, 13, 1413 RSC.
- H. Ren, Q.-X. Li, Y. Luo and J. Yang, Appl. Phys. Lett., 2009, 94, 173110 CrossRef.
Footnote |
| † Electronic Supplementary Information (ESI) available. See DOI: 10.1039/c2ra21413j |
|
| This journal is © The Royal Society of Chemistry 2012 |
Click here to see how this site uses Cookies. View our privacy policy here. ![[thin space (1/6-em)]](https://www.rsc.org/images/entities/char_2009.gif) :
:![[thin space (1/6-em)]](https://www.rsc.org/images/entities/char_2009.gif) 3, 1
3, 1![[thin space (1/6-em)]](https://www.rsc.org/images/entities/char_2009.gif) :
:![[thin space (1/6-em)]](https://www.rsc.org/images/entities/char_2009.gif) 1 and 3
1 and 3![[thin space (1/6-em)]](https://www.rsc.org/images/entities/char_2009.gif) :
:![[thin space (1/6-em)]](https://www.rsc.org/images/entities/char_2009.gif) 1, respectively. The resulting solutions were aged for 7 days under a dark cover (pH = 6.7) and were freeze-dried. For morphological and spectroscopic studies these aged solutions were used, and for other studies the freeze-dried samples were used. The samples are designated as PRAu13, PRAu11 and PRAu31; the number indicates the weight ratios of P and RNA, respectively.
1, respectively. The resulting solutions were aged for 7 days under a dark cover (pH = 6.7) and were freeze-dried. For morphological and spectroscopic studies these aged solutions were used, and for other studies the freeze-dried samples were used. The samples are designated as PRAu13, PRAu11 and PRAu31; the number indicates the weight ratios of P and RNA, respectively.
![[thin space (1/6-em)]](https://www.rsc.org/images/entities/char_2009.gif) :
:![[thin space (1/6-em)]](https://www.rsc.org/images/entities/char_2009.gif) R (w/w))
R (w/w))


![[double bond, length as m-dash]](https://www.rsc.org/images/entities/char_e001.gif) O group of RNA, and in the PR hybrids the 813 cm−1 peak has shifted to 800 cm−1 and the 861 cm−1 peak is shifted to 871cm−1. The 1240 cm−1 peak has shifted to 1224 and 1219 cm−1 for the PR13 and PR11 hybrids. This result indicates a transfer of a lone pair of electrons from the nitrogen atom of the dimethyl amino group of P to the phosphorous atom of the phosphate group, developing an ionic interaction between them. But in the nanobiocomposites (SI Fig. 4b†) the 813 cm−1 peak of ribose phosphate remains unchanged, the 861 cm−1 peak shows a blue shift to 871 cm−1 and the 1240 cm−1 peak has shifted to 1222 cm−1, indicating ionic bond formation between the phosphate anion of RNA and the cationic amino group of P. The in-plane vibration of cytosine at 1480 cm−1 is shifted to the lower frequency (1422 cm−1), due to the π–π interaction of P with the cytosine base of RNA. The peaks at 1600–1700 cm−1 are also due to the in plane vibration of uracil (U), guanine (G), adenine (A) and cytosine (C) bases of RNA and the peaks are shifted to the lower frequency (e.g. 1638 cm−1), indicating that the π clouds of the U, G, A, and C bases are somewhat delocalized by the π–π interaction through the π clouds of the P rings. So, from the FTIR data the existence of ionic interactions between cations of P and the phosphate anions of RNA and also the π–π interactions are evident (Scheme 2). In SI Fig. 4c† the RNA subtracted FTIR spectra of the composite is presented. P has peaks at 1400–1200 cm−1 due to the C–N bond vibration, but in the hybrids these peaks shift from 1400 to 1380 cm−1 and 1271 to 1234 cm−1. Due to the formation of the Au NPs, the cationic amine group of P formed on oxidation produces an ionic complex with the RNA molecule.
O group of RNA, and in the PR hybrids the 813 cm−1 peak has shifted to 800 cm−1 and the 861 cm−1 peak is shifted to 871cm−1. The 1240 cm−1 peak has shifted to 1224 and 1219 cm−1 for the PR13 and PR11 hybrids. This result indicates a transfer of a lone pair of electrons from the nitrogen atom of the dimethyl amino group of P to the phosphorous atom of the phosphate group, developing an ionic interaction between them. But in the nanobiocomposites (SI Fig. 4b†) the 813 cm−1 peak of ribose phosphate remains unchanged, the 861 cm−1 peak shows a blue shift to 871 cm−1 and the 1240 cm−1 peak has shifted to 1222 cm−1, indicating ionic bond formation between the phosphate anion of RNA and the cationic amino group of P. The in-plane vibration of cytosine at 1480 cm−1 is shifted to the lower frequency (1422 cm−1), due to the π–π interaction of P with the cytosine base of RNA. The peaks at 1600–1700 cm−1 are also due to the in plane vibration of uracil (U), guanine (G), adenine (A) and cytosine (C) bases of RNA and the peaks are shifted to the lower frequency (e.g. 1638 cm−1), indicating that the π clouds of the U, G, A, and C bases are somewhat delocalized by the π–π interaction through the π clouds of the P rings. So, from the FTIR data the existence of ionic interactions between cations of P and the phosphate anions of RNA and also the π–π interactions are evident (Scheme 2). In SI Fig. 4c† the RNA subtracted FTIR spectra of the composite is presented. P has peaks at 1400–1200 cm−1 due to the C–N bond vibration, but in the hybrids these peaks shift from 1400 to 1380 cm−1 and 1271 to 1234 cm−1. Due to the formation of the Au NPs, the cationic amine group of P formed on oxidation produces an ionic complex with the RNA molecule.


