Batch and bulk removal of hazardous colouring agent Rose Bengal by adsorption techniques using bottom ash as adsorbent
Vinod Kumar
Gupta
*ab,
Alok
Mittal
c,
Damodar
Jhare
c and
Jyoti
Mittal
c
aDepartment of Chemistry, Indian Institute of Technology Roorkee, Roorkee - 247 667, India. E-mail: vinodfcy@gmail.com; Fax: 00911332286202; Tel: 00911332285918
bKing Fahd University of Petroleum and Minerals, Dhahran 31261, Saudi Arabia
cDepartment of Chemistry, Maulana Azad National Institute of Technology, Bhopal, 462051, India
First published on 13th July 2012
Abstract
Rose Bengal is a halogen-containing fluorescein water soluble dye, which is widely used for medical purposes. The dye, however, is highly toxic and can cause irritation, itching etc. to the human skin and eyes. It is therefore considered worthwhile to develop a systematic method for the removal of Rose Bengal by adsorption processes. The present investigation is devoted to batch as well as bulk removal of Rose Bengal. Under preliminary batch studies, adsorption isotherm measurements and kinetic studies were carried out, while for the bulk removal, a glass column was used as a fixed bed adsorber made up of Bottom Ash. Attempts were also made for the recovery of the dye from the exhausted Bottom Ash column by eluting dilute NaOH. The paper also presents a detailed procedure for activating Bottom Ash and its chemical and physical analysis. Rose Bengal showed a decrease in adsorption with increasing pH and conversely, increases in concentration, temperature, amount of adsorbent and sieve size increased the adsorption. Langmuir, Freundlich, Tempkin and D–R adsorption isotherm models were also verified, and on the basis of Langmuir constants thermodynamic parameters such as the Gibb's free energy, enthalpy and entropy of the adsorption were also calculated. A pseudo-second order process was found to operate during the adsorption. During column operations various parameters like fractional capacity of the column, mass flow rate, percentage saturation of column etc. were calculated. Desorption from the exhausted column gave almost 91% of dye recovery.
1. Introduction
Rose Bengal (Fig. 1), also known as Acid Red 94 [IUPAC name 4,5,6,7-tetrachloro-3′,6′-dihydroxy-2′,4′,5′,7′-tetraiodospiro(isobenzofuran-1(3H),9′-(9H)xanthen)-3-one], is a well known fluorescein class of halogen-containing dye. It is a water soluble dye and exhibits a pink colour. It has several medical diagnostic applications, e.g., liver function testing, staining of necrotic tissue in the eyes, devitalized cells of the cornea in conjunctivitis etc..1 The low concentration dosage of Rose Bengal is also used in the treatment of eczema and psoriasis. Apart from various clinical uses, Rose Bengal also has severe toxic effects on the human corneal epithelium.2,3 The dye is extremely hazardous when it comes in contact with skin and creates irritation, itching, scaling, reddening and even blistering. It also causes inflammation, redness, watering and itching in the eyes. On ingestion by inhalation it damages mucous membranes, which leads to respiratory irritations in humans.4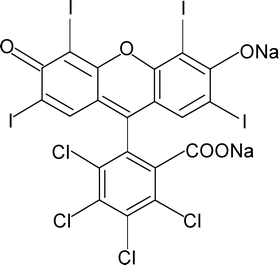 | ||
| Fig. 1 Chemical structure of the dye Rose Bengal. | ||
For the past few years economic and eco-friendly methods have been developed for the eradication of highly toxic and hazardous dyes from their aqueous solutions by adsorption using waste materials as adsorbents.5,6 It is now established that adsorption technique is one of the most powerful tools for the removal of pollutants from the water 7–10 and the technique has several advantages over other physico-chemical methods like electrochemical treatment 11 photochemical treatment,12 biodegradation,13 froth flotation 14 and reverse osmosis 15etc. The abilities of the adsorption process to remove and recover the larger organic molecules, without their decomposition, have also popularized it over other modern analytical, electrochemical and photochemical methods.16 Use of waste materials as potential adsorbents influences the economics of the developed process and recently, selection of cheap and convenient waste materials has become a main focus of research. Reports are available that the degradation products of the bulky dye Rose Bengal are much more toxic than the original molecule.17 Therefore employing an adsorption process for the removal and recovery of a costly dye like Rose Bengal is advantageous and necessary, while the cost reduction of the developed process can be achieved by selecting a waste material as adsorbent.
Bottom ash is a waste material collected at the bottom of the furnace in the thermal power plants. It is always produced in huge quantity and disposed in nearby land. Discarding of bottom ash has always been a matter of great concern to the plant authorities as the dumped ash is highly unsuitable for agricultural uses; it makes the agricultural land barren, infertile and unproductive.18 To date there is no evidence of the presence of any toxic element in the bottom ash 19,20 and therefore its use as an adsorbent for the removal of water soluble molecules is extremely safe. This research article presents the attempt of our laboratory to utilize bottom ash as a potent adsorbent for the efficient removal and necessitous recovery of toxic Rose Bengal dye. The developed method is easy, cheap, fast and versatile.
2. Experimental
2.1. Material and methods
Rose Bengal (C20H2Cl4I4Na2O5, Mr: 1017.65) was procured from M/S Merck and the 0.01 M stock solution was the dye was prepared in doubly distilled water. All other reagents used were of analytical reagent grade and purchased through M/s Advance Scientific, Bhopal. Bottom ash was obtained from the Thermal Power Station (T. P. S.) of M/s Bharat Heavy Electrical Limited (B. H. E. L), Bhopal (India). The T. P. S. of B. H. E. L, Bhopal purchases sub-bituminous coal from M/s South Eastern Coal Field Limited, Chirmiri, Sarguja (India).During adsorption experimentation all pH measurements were monitored by microprocessor based pH meter model number HI 8424, M/s Henna Instruments, Italy. The dye uptake was measured by recording the absorbance of the dye solution on a UV/VIS spectrophotometer model 117 (M/s Systronics, Ahmedabad, India) over wide wavelength range of 200 to 700 nm.
In order to measure various physical properties of activated bottom ash, different instruments were used. The surface area was determined by using Quantasorb Model QS-7, porosity by a Mercury porosimeter and density by specific gravity bottles. To characterize bottom ash, the IR spectrum was recorded on an Infra-red spectrophotometer (HP FT-IR), scanning electron microscopy was performed on a Philips SEM 501 electron microscope, while X-ray measurements were carried out on a Philips X-ray diffractophotometer employing Nickel filtered Cu-α-radiation.
For the bulk removal and recovery of Rose Bengal, adsorption and desorption were carried out through column operations. The main component in column studies was a long tubular glass column of 30 cm length and 1 cm internal diameter filled with the bed of adsorbent, through which the dye solution is percolated to absorb the dye material. On exhaustion of column dilute NaOH was slowly percolated for the recovery of the dye.
2.2. Material development
Activation of the adsorbent material plays a very significant role in the adsorption process, since it increases the number of surface active sites of the adsorbent, thereby providing it with a wider surface available for the adsorption. To activate bottom ash, it was first ground into very small granules and then thoroughly washed with doubly distilled water. To oxidize all undesired organic impurities from it, small sized granules of bottom ash were dipped into a hydrogen peroxide solution (30% w/v) for about 24 h. The solution is then filtered and washed again several times by doubly distilled water. From the material thus obtained moisture is first removed by keeping it in an oven at 100 °C for about 15 min. Further activation of bottom ash was achieved by keeping the dried material in a furnace at 500 °C for about 30 min. Bottom ash granules were then sieved to obtain the desired particle sizes such as 0.425–0.150 mm (36 BSS Mesh), 0.150–0.088 mm (100 BSS Mesh) and ≤ 0.088 mm (170 BSS Mesh) (BSS: British Standard Size), stored in vacuum desiccators.To determine the nature of bottom ash, its weighed amount was added to 25mL of distilled water, pH = 7.0, and stirred thoroughly. The solution was kept undisturbed for 24 h in the 100 mL airtight measuring flasks and then filtered to measure the pH. The pH value was found to decrease, confirming thereby the acidic nature of bottom ash.
Different magnifications of scanning electron microscopic photographs of the activated granules of bottom ash reveal that its particles are almost spherical and porous in nature. Differential Thermogravimetric Analysis (DTA) curves indicate that the activated bottom ash is thermally stable and a very negligible weight loss occurred at high temperature. The X–ray diffraction indicates the presence of alumina (Al2O3), gypsum (CaSO4·2H2O), beaverite [Pb(Cu,Fe,Al)3(SO4)2(OH)6], borax (Na2B4O7·10H2O) and kaolinite [2{Al2Si2O5(OH)4}] in the activated bottom ash. The infrared spectra of activated bottom ash give peaks in 790 cm−1 region, corresponding to kaolinite [2{Al2Si2O5(OH)4}]. The bands at 3467, 2930, 2676, 1502, 1097, 470.2 and 790 cm−1 confirm the presence of laumonite [4CaAl42Si4O12·4H2O], amber, mulite [3Al2O3·2SiO2], azurite [Cu3(CO3)2(OH)2], bavenite [4Ca4(BeAl)4Si9(O.OH)29(OH)2], gypsum [3(CaSO4·2H2O)] and corundum [2(α-Al2O3)] respectively (Fig. 2).
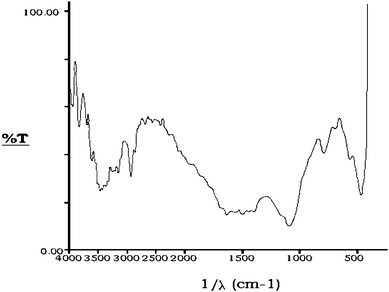 | ||
| Fig. 2 Infra-red spectrum of activated bottom ash. | ||
2.3. Adsorption studies
Adsorption of the halogen containing dye Rose Bengal was first achieved via a batch technique at temperatures 30, 40 and 50 °C; batch experiments were performed to observe the effects of pH, adsorbate concentration, amount of adsorbent, sieve size of adsorbent, temperature and time of contact.In an airtight 100 mL volumetric flask, 25 mL of the dye solution of desired concentration was taken and a fixed amount of bottom ash of a particular sieve size was added into it. The conical flask kept in a water bath was then agitated by a mechanical shaker and then kept for 24 h for saturation. When the equilibrium was thought to have been established, the supernatant was then filtered through Whattman filter paper (No. 41) and the amount of dye up taken was monitored spectrophotometrically at the absorption maxima of Rose Bengal, viz., λmax = 544 nm. It is pertinent to note that the pHs of the dye solutions were maintained by using NaOH and HCl.
2.4. Kinetic studies
Kinetic measurements were carried out by taking 25 mL of the dye solutions in 100 mL volumetric flasks and adding suitable amount of bottom ash. The solutions were shaken at regular intervals and after filtration, spectrophotometeric analysis was performed at λmax = 544 nm. The change in the concentration of the dye before and after adsorption gave the dye uptake.2.5. Column studies
The main objective of flow-through column experiments is to provide a more sensible simulation of how the bottom ash adsorbs the colour contaminant. The column was prepared by making a slurry of the bottom ash of desired size in doubly distilled water. The slurry was then slowly fed into the glass column over a glass wool support leading to the formation of adsorbent beds. In order to avoid air entrapment in the column the water of the slurry was continuously expelled through the column outlet. When the stable beds are formed, a dye solution of 6 × 10⁻⁵ M concentration was then eluted through the column with an appropriate flow rate of 0.5 mL min−1 and absorbance of the received dye solution were monitored by UV/Vis spectrophotometrically.2.6. Column regeneration
Once the concentration of received dye solution equalised to that of the fed dye solution, the column was considered to be exhausted and at this stage column operation was stopped. In order to recover the adsorbed dye from the exhausted column, aliquots of dilute NaOH were passed with a constant flow rate of 0.5 mL min−1 and the dye material was recovered at the outlet of the column. When complete dye was drained out of the adsorbent bed of the column, column was properly washed with hot water and made ready for next cycle of operation.3. Results and discussion
3.1. Adsorption studies
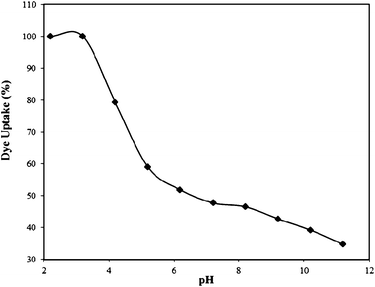 | ||
| Fig. 3 Effect of pH on the Rose Bengal (concentration = 1 × 10⁻⁴ M)–bottom ash (amount = 0.50 g; mesh size = 100 BSS) system. | ||
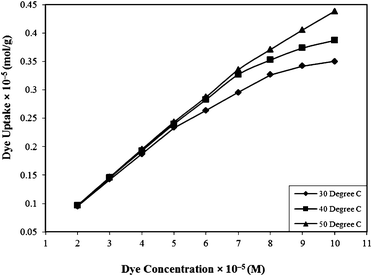 | ||
| Fig. 4 Effect of concentration on the Rose Bengal (pH = 7.2)–bottom ash (amount = 0.50 g; mesh size = 100 BSS) system at different temperatures. | ||
| Amount of bottom ash (g) | Amount of Rose Bengal Adsorbed (× 10−6 g) | ||
|---|---|---|---|
| 30 °C | 40 °C | 50 °C | |
| 0.1 | 0.140 | 0.487 | 0.698 |
| 0.2 | 0.565 | 1.150 | 0.146 |
| 0.3 | 1.278 | 1.855 | 2.015 |
| 0.4 | 1.838 | 2.220 | 2.243 |
| 0.5 | 2.120 | 2.347 | 2.380 |
| 0.6 | 2.312 | 2.358 | 2.390 |
| 0.7 | 2.393 | 2.400 | 2.412 |
| 0.8 | 2.403 | 2.410 | 2.425 |
The adsorbent material bottom ash used in the present research was sieved into three different mesh sizes viz. 36, 100 and 170 BSS Mesh. In the batch studies, 0.50 g of bottom ash of all the three mesh sizes is brought into contact with 1 × 10⁻⁴ M dye solution for about 24 h. It was also examined that with the decrease in the size of the particles of bottom ash, the percentage uptake of Rose Bengal increases. The amount of adsorption achieved for 36, 100 and 170 BSS mesh were 0.333 × 10⁻⁵, 0.431 × 10⁻⁵ and 0.442 × 10⁻⁵ mol g−1. This may be due to an increase in the surface area of the adsorbents.
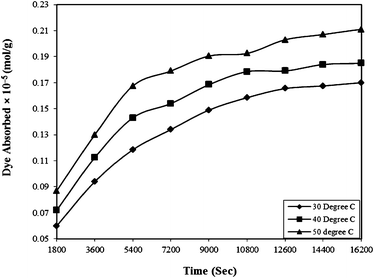 | ||
| Fig. 5 Effect of contact time on the Rose Bengal (pH = 7.2, concentration = 5 × 10⁻⁵ M)–bottom ash (0.50 g and mesh size = 100 BSS) system at different temperatures. | ||
3.2. Kinetic studies
 | (1) |
Where qe and qt are adsorption capacities (mol g−1) at equilibrium (e) and time t (sec), respectively, and k2 is the rate constant of the pseudo-second order rate expression (sec g mol−1). The kinetic measurements were carried out in 5 × 10⁻⁵ M of the dye using 0.5 g of bottom ash in the solution. The plot of t/qt against time (Fig. 6) gives straight lines with regression coefficient values equivalent to almost unity, confirming thereby the pseudo-second order kinetics of the ongoing process at all the temperatures. The rate constant for the process was found almost 2 × 10⁻⁹ sec g mol−1 at all temperatures.
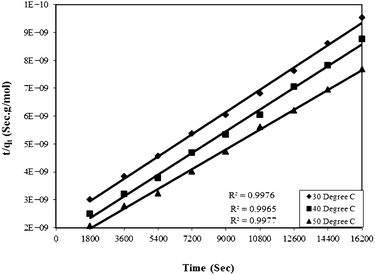 | ||
| Fig. 6 Plot of time versus t/qt for the Rose Bengal (pH = 7.2, concentration = 5 × 10⁻⁵ M)–bottom ash (0.50 g and mesh size = 100 BSS) system at different temperatures. | ||
 | (2) |
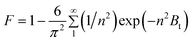
Where, n is the Freundlich constant and F is the fractional attainment of equilibrium at time t, and is obtained by using the following equation:
 | (3) |
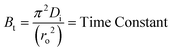
Where, Qt and Q∞ are amounts adsorbed after time t and after infinite time respectively. The other parameter ‘Bt’ is known as time constant and obtained by following expression:
 | (4) |
Where, Bt = time constant, Di = effective diffusion coefficient of adsorbate in the adsorbent phase and ro = radius of adsorbent particles assumed to be spherical.
For every observed value of F, corresponding values of Bt were derived from Reichenberg's table.23 The Btversus time plot for 5 × 10⁻⁵ M solution of dye (Fig. 7) was found to be linear and straight lines obtained at different temperature were found to pass almost through the origin. This suggests that the rate determining process governs through particle diffusion at all the temperatures 30, 40, 50 °C.
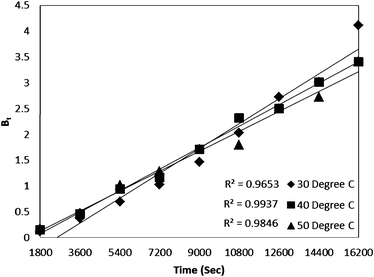 | ||
| Fig. 7 Time versus Bt plot for Rose Bengal (pH = 7.2, concentration = 5 × 10⁻⁵ M)–bottom ash (0.50 g, mesh size = 100 BSS) adsorption at different temperatures. | ||
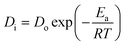
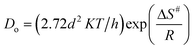
For the ongoing adsorption, the values of the effective diffusion coefficient Di were also calculated at 30, 40 and 50 °C temperatures using the time versus Bt graphs. The energy of activation (Ea), entropy (ΔS#) and pre-exponential constant (Do), values were calculated using the following equations:
 | (5) |
 | (6) |
In the equations given above, Do is the pre-exponential constant, ΔS# is the entropy, d gives the average distance between two successive sites of the adsorbent, h is the Planck constant, K the Boltzmann constant, Ea, the energy of activation, T is the temperature and R is the universal gas constant.
At 30, 40 and 50 °C the values of the effective diffusion coefficient (Di) have been found to be 1.4833 × 10⁻⁹, 1.3121 × 10⁻⁹ and 1.1980 × 10⁻⁹, respectively. The decreasing values of effective diffusion coefficient (Di) with respect to increasing temperature clearly indicate that the mobility of the ions decreases due to an increased retardation force acting on the diffusing particles of the dye. The values of the pre-exponential constant (Do), activation energy (Ea) and entropy of activation (ΔS#) for the diffusion of Rose Bengal adsorbing over bottom ash have also been calculated and found as 4.68 × 10⁻¹¹, 8.713 kJ mol −1 and 478.145 J K−1mol −1, respectively. The negative values of ΔS# obtained for both the systems reveal that the internal structure of the bottom ash do not go through any significant change during the adsorption of the dye.
3.3. Adsorption isotherm models
The preliminary investigations presented above determine various working conditions to achieve optimum adsorption of the dye. To develop efficient dye removal methodology the results obtained during preliminary investigations are now used to verify various isothermal models, because equilibrium sorption isotherms are fundamentally very significant for the designing of any sorption system. In the present research work, Langmuir, Freundlich, Tempkin and D–R isotherm models have been applied. The information gathered under various isothermal conditions, during the course of investigations, are utilized to evaluate useful thermodynamic parameters, which suggest the feasibility, favorability and spontaneity of the ongoing adsorption process in the dye–adsorbent system. Moreover, endothermic or exothermic nature and chemical or physical character of the adsorption have also been investigated in the present studies for the adsorption of Rose Bengal over bottom ash. | (7) |
Where, qe is the number of moles of solute adsorbed per unit weight at concentration C, Ce is the molar concentration in the bulk-fluid phase.
For the verification of the Langmuir isotherm model, 1/Ceversus 1/qe graphs were plotted for the data obtained during adsorption of Rose Bengal over bottom ash at temperatures of 30, 40 and 50 °C. Straight lines with appreciable R2 values were obtained at all the temperatures, confirming thereby the verification of Langmuir adsorption model and involvement of monolayer adsorption in each case. These straight lines are helpful in calculating the Langmuir constant b and the number of moles of the dye adsorbed per unit weight of the adsorbent (qo) through their slopes and intercepts, respectively (Table 2).
| Langmuir constants | |||||
| Q o (× 10−5 mol g−1) | b (× 104 L mol−1) | ||||
| 30 °C | 40 °C | 50 °C | 30 °C | 40 °C | 50 °C |
| 3.68 | 4.27 | 4.89 | 4.25 | 5.86 | 6.66 |
| Freundlich constants | |||||
| n | K F × 10−4 | ||||
| 30 °C | 40 °C | 30 °C | 40 °C | 30 °C | 40 °C |
| 3.636 | 3.521 | 3.636 | 3.521 | 3.636 | 3.521 |
| Tempkin constants | |||||
| k 1 × 10⁻⁷ (L mol−1) | k 2 × 10⁶ | ||||
| 30 °C | 40 °C | 30 °C | 40 °C | 30 °C | 40 °C |
| 7 | 8 | 7 | 8 | 7 | 8 |
| D–R constants | |||||
| –β (× 10−9 mol2 J−2) | X m (× 10−5 mol/g) | ||||
| 30 °C | 40 °C | 30 °C | 40 °C | 30 °C | 40 °C |
| 2.0 | 2.0 | 2.0 | 2.0 | 2.0 | 2.0 |
| ΔG° = −RTlnb | (8) |
 | (9) |
 | (10) |
Where, b, b1 and b2 are the equilibrium constants at 30, 40 and 50 °C, respectively.
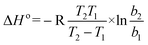
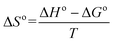
On the basis of eqn (8) the Gibb's free energy (ΔG°) of the ongoing adsorption process have been calculated as −32.647, −34.561and −36.008 kJ mol−1 at 30, 40 and 50 °C, respectively. The negative free energy values indicate that the ongoing adsorption process is spontaneous in nature and with increasing temperature, the adsorption capacity of the bottom ash increases. On the other hand, the average enthalpy (ΔH°) and entropy (ΔS°) of the process have been evaluated as 18.120 kJ mol−1 and 51.703 J K−1 mol−1, respectively. The positive value of change in enthalpy suggests the endothermic nature of the process, while the positive value for the change in entropy reveals the increased randomness during the adsorption process and indicates a specific affinity of bottom ash towards the Rose Bengal molecule.
A dimensionless separation factor r, introduced by Weber and Chakravorti53 was also calculated to determine the feasibility and favourability of the ongoing adsorption process, by using the following equation:
 | (11) |
Where, b is the Langmuir constant and C0 is the initial concentration. The values of r were found to be 0.19, 0.14 and 0.13 at 30, 40 and 50 °C respectively. Values of r that are < 1 at all the temperatures suggest highly favourable adsorption during the ongoing process.
| logqe = logKF + (1/n) logCe | (12) |
Here Ce denotes the equilibrium concentration (M) of the adsorbate and qe, the amount adsorbed (mol g−1) and KF and n are the Freundlich constants related to the adsorption capacity and adsorption intensity of the adsorbate–adsorbent system, respectively. Thus, the Freundlich adsorption isotherm plot was sketched by taking logCe on the abscissa and log qe on the ordinate. The experimental data obtained in terms of logCe and logqe, was found to fit straight lines with regression coefficients close to unity. Values of KF and n were derived from the intercepts and slope of these straight lines, respectively and are presented in Table 2.
| qe = k1lnk2 + k1lnCe | (13) |
Where, qe is the amount of adsorbate adsorbed per unit mass of adsorbent at equilibrium (mol g−1), Ce is the final concentration at equilibrium (mol L−1), k1 is the Tempkin isotherm energy constant (L mol−1) related to the heat of adsorption and k2 is the Tempkins isotherm constant. Thus, a plot of lnCe as a function of the amount adsorbed at equilibrium (qe) gave straight lines (Fig. 8) suggesting the uniform distribution of binding energy arising due to interaction of the adsorbate molecules. The straight lines obtained from the graphs were also helpful in determining the Tempkin isotherm constants presented in Table 2.
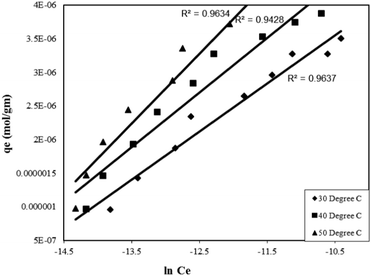 | ||
| Fig. 8 Tempkin adsorption isotherm for the Rose Bengal (pH = 7.2)–bottom ash (0.50 g, mesh size = 100 BSS) system at different temperatures. | ||
| lnCads = lnXm –βε2 | (14) |
Where, Xm is the maximum adsorption capacity, β is the activity coefficient related to mean sorption energy, and ε is the Polanyi potential, which is equal to:
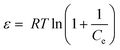 | (15) |
Where, R is the gas constant and T is temperature in Kelvin. The activity coefficient (β) and the adsorption capacities (lnXm) were evaluated from the slopes and intercepts of the plot lnCadsversus ε2 (Fig. 9) respectively at 30, 40 and 50 °C. The results are depicted in Table 2. The mean sorption energy was calculated from the values of β by following expression:
 | (16) |
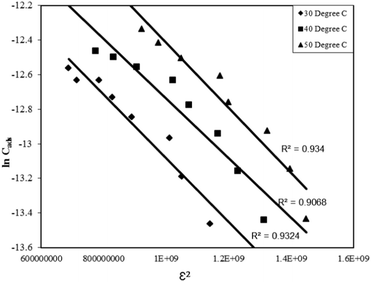 | ||
| Fig. 9 D–R adsorption isotherm for the Rose Bengal (pH = 7.2)–bottom ash (0.50 g, mesh size = 100 BSS) system at different temperatures. | ||
On the basis of values of β, obtained from the D–R isotherm graph, values of E are calculated. At all the temperatures the values have been found as 15.8 kJ indicating thereby involvement of chemisorption in the present adsorption process at all the temperatures.
3.4. Column studies
The practical utility of the developed method was assessed by carrying out bulk removal of the Rose Bengal by adsorbing it over bottom ash in a glass column. A literature survey reveals that various types of columns have been suggested by different workers.54,55 However, it is specified that in those cases where rate to establish equilibrium of adsorbate concentration between aqueous and adsorbed phase is known, it is advisable to use a fixed bed adsorber as this allows more efficient utilization of the adsorptive capacity than the batch process.56 Moreover, by fixed bed column studies both adsorption and desorption studies can be made easily. Thus fixed bed column studies were carried out for removal as well as recovery of the Rose Bengal.In the present studies, parameters like length of primary adsorption zone (δ), time involved in establishing the primary adsorption zone (tx), time required by primary adsorption zone to move down its length (tδ), time of initial formation of primary adsorption zone (tf), fractional capacity of the prepared column (f), mass rate of flow to the adsorbent (Fm) and percentage saturation of column at break point were calculated by using well-known equations.57
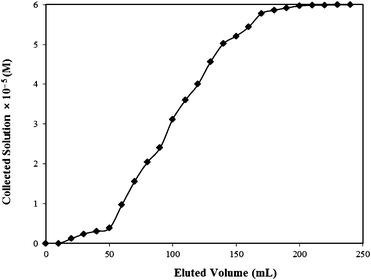 | ||
| Fig. 10 Breakthrough curve for Rose Bengal–bottom ash column. | ||
| C 0 (M) | C x (M) | C b (M) | V x (mL) | V b (mL) | (Vx−Vb) (mL) | F m (mg cm−2 min−1) | D (cm) |
|---|---|---|---|---|---|---|---|
| 6 × 10⁻⁵ | 0.38 × 10⁻⁵ | 5.78 × 10⁻⁵ | 170 | 50 | 120 | 0.0389 | 1.0 |
| t x (min) | t δ (min) | t f (min) | f | δ (cm) | Percentage Saturation |
|---|---|---|---|---|---|
| 4372.423 | 3086.416 | 100 | 0.968 | 0.722 | 97.65 |
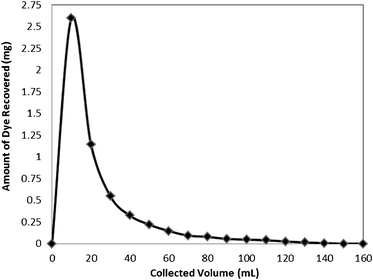 | ||
| Fig. 11 Recovery of the dye Rose Bengal from the bottom ash column. | ||
The adsorption efficiency was determined by reloading the column with dye solution of same concentration and breakthrough capacities were found as 85, 77, 66 and 54% during first, second, third, and fourth cycles, respectively.
4. Conclusions
The studies presented above clearly exhibit that the removal of Rose Bengal from its aqueous solutions can be very efficiently achieved through batch and column operations by activated bottom ash at all the temperatures. It was also found that the adsorption is very much dependent upon parameters like pH, contact time, amount of adsorbent, sieve size of adsorbent adsorbate concentration and temperature. The adsorption exhibit a pseudo second order rate kinetics and the value of rate constants at all the temperatures were found almost similar, viz. 2 × 10⁻⁹. The contact time studies also exhibit that the ongoing adsorption process follow particle diffusion mechanism and very promising results were obtained for the activation energy and entropy of the process. Other thermodynamic parameters like change in enthalpy, entropy and free energy were also calculated through Langmuir constants and it was found that the process is spontaneous and feasible. As exhibited by the straight lines obtained at different temperatures, it was also concluded that the adsorption of the Rose Bengal over bottom ash follows Langmuir, Freundlich, Tempkin and D–R adsorption isotherms. The excellent adsorption ability of bottom ash was also ascertained by the column operations and a percentage saturation of almost 97% was achieved. Desorption studies also gave 91% of adsorbed dye from the column after eluting with dilute NaOH.Acknowledgements
One of the authors, DJ, thanks MANIT for providing financial assistance to carry out this work.References
- Saunders Comprehensive Veterinary Dictionary (2007) 3rd Edition, Elsevier, Inc Search PubMed.
- H. M. Tabery, Acta Ophthalmol. Scand., 1998, 76(2), 142–145 CAS.
- Y. C. Lee, C. K. Park, M. S. Kim and J. H. Kim, Cornea, 1996, 15(4), 376–385 CrossRef CAS.
- http://www.sciencelab.com/msds.php?msdsId=9924832 .
- V. K. Gupta and Suhas, J. Environ. Manage., 2009, 90, 2313–2342 CrossRef CAS.
- I. Ali and V. K. Gupta, Nat. Protoc., 2007, 1(6), 2661–2667 CrossRef.
- S. Karthikeyan, V. K. Gupta, R. Boopathy, A. Titus and G. Sekaran, J. Mol. Liq., 2012, 173, 153–163 CrossRef.
- V. K. Gupta, I. Ali, T. A. Saleh, A. Nayak and S. Agarwal, RSC Adv., 2012, 2, 6380–6388 RSC.
- P. Nigam, G. Armour, I. Banat, M. D. Singh and R. Merchant, Bioresour. Technol., 2000, 72, 219–226 CrossRef CAS.
- T. A. Saleh and V. K. Gupta, Environ. Sci. Pollut. Res., 2012, 19, 1224–1228 CrossRef CAS.
- Z. M. Shen, D. Wu, J. Yang, T. Yuan, W. H. Wang and J. P. Jia, J. Hazard. Mater., 2006, 131, 90–97 CrossRef CAS.
- R. Jain and M. Shrivastava, J. Hazard. Mater., 2008, 152, 216–220 CrossRef CAS.
- N. C. G. Tan, F. X. Prenafeta-Boldu, J. L. Opsteeg, G. Lettinga and J. A. Field, Appl. Microbiol. Biotechnol., 1999, 51, 865–871 CrossRef CAS.
- W. J. Weber Jr, Physicochemical Processes for Water Quality Control. Wiley-Interscience, New York, 1972 Search PubMed.
- D. Li and H. Wang, J. Mater. Chem., 2010, 20, 4551–4566 RSC.
- P. Garu, Wat. Sc. Technol., 2005, 24, 97–103 Search PubMed.
- Millodot: Dictionary of Optometry and Visual Science, 7th Edition. Butterworth-Heinemann, 2009 Search PubMed.
- M. Ahmaruzzaman and V. K. Gupta, Ind. Eng. Chem. Res., 2011, 50, 13589–13613 CAS.
- C. Y. Lin and D. H. Yang, J. Environ. Sci. Health, Part A: Toxic/Hazard. Subst. Environ. Eng., 2002, 37, 1509–1522 CrossRef.
- F. Goodarzi and F. E. Huggins, J. Environ. Monit., 2001, 3, 1–6 RSC.
- Y. S. Ho and G. Mckay, Trans. Inst. Chem. Eng., 1998, 76, 313–318 CAS.
- G. E. Boyd, A. W. Adamson and L. S. Meyers, J. Am. Chem. Soc., 1947, 69, 2836–2848 CrossRef CAS.
- D. Reichenberg, J. Am. Chem. Soc., 1953, 75, 589–597 CrossRef CAS.
- V. K. Gupta, S. K. Srivastava and D. Mohan, Ind. Eng. Chem. Res., 1997, 36, 2207–2218 CrossRef CAS.
- V. K. Gupta, R. Prasad and A. Kumar, Talanta, 2003, 60, 149–160 CrossRef CAS.
- V. K. Gupta, R. Mangla, U. Khurana and P. Kumar, Electroanalysis, 1999, 11, 573–576 CrossRef CAS.
- A. K. Jain, V. K. Gupta, L. P. Singh and U. Khurana, Analyst, 1997, 122, 583–586 RSC.
- V. K. Gupta, S. K. Srivastava and R. Tyagi, Water Res., 2000, 34, 1543–1550 CrossRef CAS.
- V. K. Gupta, R. Mangla and S. Agarwal, Electroanalysis, 2002, 14, 1127–1132 CrossRef CAS.
- A. K. Jain, V. K. Gupta, U. Khurana and L. P. Singh, Electroanalysis, 1997, 9, 857–860 CrossRef CAS.
- A. K. Jain, V. K. Gupta and L. P. Singh, Anal. Proc., 1995, 32, 263–265 RSC.
- A. K. Jain, V. K. Gupta, B. B. Sahoo and L. P. Singh, Anal. Proc., 1995, 32, 99–101 RSC.
- S. K. Srivastava, V. K. Gupta, M. K. Dwivedi and S. Jain, Anal. Proc., 1995, 32, 21–23 RSC.
- V. K. Gupta and A. Rastogi, J. Colloid Interface Sci., 2010, 342, 135–141 CrossRef CAS.
- R. N. Goyal, V. K. Gupta, A. Sangal and N. Bachheti, Electroanalysis, 2005, 17, 2217–2223 CrossRef CAS.
- V. K. Gupta, A. Mittal and L. Krishnan, J. Hazard. Mater., 2005, 117, 171–178 CrossRef.
- V. K. Gupta, A. K. Jain, P. K. S. Agarwal and G. Maheshwari, Sens. Actuators, B, 2006, 113, 182–186 CrossRef.
- V. K. Gupta, A. Mittal, L. Kurup and J. Mittal, J. Colloid Interface Sci., 2006, 304, 52–57 CrossRef CAS.
- V. K. Gupta, A. Mittal, L. Krishnan and J. Mittal, J. Colloid Interface Sci., 2006, 293, 16–26 CrossRef CAS.
- V. K. Gupta, R. Jain, and S. Varshney, J. Hazard. Mater., 2007, 142, 443–448 CrossRef CAS.
- R. N. Goyal, V. K. Gupta, M. Oyama and N. Bachheti, Talanta, 2007, 72, 976–983 CrossRef CAS.
- V. K. Gupta, R. Jain, and S. Varshney, J. Colloid Interface Sci., 2007, 312, 292–296 CrossRef CAS.
- V.K. Gupta, I. Ali and V. K. Saini, Water Res., 2007, 41, 3307–3316 CrossRef CAS.
- V. K. Gupta, A. K. Singh and B. Gupta, Anal. Chim. Acta, 2007, 583, 340–348 CrossRef CAS.
- R. N. Goyal, V. K. Gupta and N. Bachheti, Talanta, 2007, 71, 1110–1117 CrossRef CAS.
- V. K. Gupta, A. Mittal, R. Jain, M. Mathur and S. Sikarwar, J. Colloid Interface Sci., 2009, 163, 396–402 CAS.
- V. K. Gupta, R. N. Goyal, and R. A. Sharma, Int. J. Electrochem. Sci., 2009, 4, 156–172 CAS.
- V. K. Gupta, A. Mittal, A. Malviya and J. Mittal, J. Colloid Interface Sci., 2009, 335, 24–33 CrossRef CAS.
- R. N. Goyal, V. K. Gupta and S. Chatterjee, Biosens. Bioelectron., 2009, 24, 1649–1654 CrossRef CAS.
- V. K. Gupta, M. Al Khayat, A.K. Singh and Manoj. K. Pal, Anal. Chim. Acta, 2009, 634, 36–43 CrossRef CAS.
- R. N. Goyal, V. K. Gupta, Neeta Bachheti and R. A. Sharma, Electroanalysis, 2008, 20, 757–764 CrossRef CAS.
- R. N. Goyal, M. Oyama, V. K. Gupta, S. P. Singh and S. Chatterjee, Sens. Actuators, B, 2008, 134, 816–821 CrossRef.
- T. W. Weber and R. K. Chakravorti, AIChE J., 1974, 20, 228–238 CrossRef CAS.
- H. J. Fornwalt and R. A. Hutchins, J. Chem. Eng., 1966, 73, 179–186 CAS.
- A. S. Michaels, Ind. Eng. Chem., 1952, 44, 1922–1930 CrossRef CAS.
- V. Sarin, T. S. Singh and K. K. Pant, Bioresour. Technol., 2006, 97(16), 1986–1993 CrossRef CAS.
- W. A. Johnston, Chem. Eng., 1972, 79, 87–92 CAS.
| This journal is © The Royal Society of Chemistry 2012 |