Highly sensitive terahertz spectroscopy in microsystem
Simon
Laurette
a,
Anthony
Treizebre
a,
Adil
Elagli
ad,
Basak
Hatirnaz
ab,
Renato
Froidevaux
d,
Frederic
Affouard
c,
Ludovic
Duponchel
b and
Bertrand
Bocquet
*a
aInstitute of Electronics Microelectronics and Nanotechnology (IEMN) - UMR CNRS 8520, University of Lille 1, Villeneuve d'Ascq, France. E-mail: bertrand.bocquet@univ-lille1.fr
bRaman and Infrared Spectroscopy Laboratory (LASIR) - UMR CNRS 8516, University of Lille 1, Villeneuve d'Ascq, France
cUnite Materiaux et Transformations (UMET) - UMR CNRS 8207 - UFR de Physique - Bat P5 - University of Lille 1, Villeneuve d'Ascq, France
dLaboratory of Biological Processes, Enzymatic and Microbial Engineering (ProBioGEM EA 1026), University of Lille 1, Villeneuve d'Ascq, France
First published on 24th August 2012
Abstract
We herein present a microfluidic system dedicated to THz spectroscopy of aqueous solutions. This device is able to reach a state of the art sensitivity of 5 mg mL−1, while requiring only small sample quantities and a low power source. Hydration of BSA, lysozyme and chymotrypsine proteins is studied inside microchannels and hydration numbers are computed, showing that the developed system is well suited for quantitative analysis. Moreover, coupled with advanced chemometrics algorithms, this system can become a tool for fundamental research and for the understanding of biochemical processes. Here, the hydration shell structure is discussed by chemometric analysis of the measured absorption spectra. Two spectral behaviours are observed and can be explained by Molecular Dynamics simulations. This methodology could be considered as a key element of a lab-on-a-chip for biological liquid metrology.
Introduction
Terahertz spectroscopy, which deals with electromagnetic waves in the 100 GHz–10 THz frequency band,1 is now known to be of great interest to the biological and chemical sciences.2,3 Numerous studies have shown that terahertz waves could detect molecular signatures in gases, distinguish healthy and cancerous tissues4 or probe DNA hybridization.5 Conformational changes in proteins can also be observed with this real-time, marker-free and non-ionizing technique.6,7However, studying liquids with THz waves is difficult due to the significant THz absorption by water, resulting from the excitation of both water dipolar moments and the hydrogen bond network. For instance, sending a 1 THz wave through a 1 mm-wide water sample divides its power by 109. To circumvent this problem it is possible to use more powerful THz sources,8 with however the risk of sample heating. Performing reflection spectroscopy is another way to overcome this issue but data extraction, based on the reflected signal phase analysis, is complex.9,10 Finally, a third way is to reduce the sample volume, which enables us to perform transmission measurements with the usual integrable and low-power sources.11–14 In this case, accurate volume control of the solutions is needed and this is why microfluidic systems have already been proposed to perform THz spectroscopy.15–17
Here, we demonstrate that integrating THz waveguides directly into the microfluidic system makes it possible to reach a higher sensitivity than previously developed microfluidic systems dedicated to THz spectroscopy, in which the spectroscopy and fluidic aspects are less intimately integrated. With this configuration, it is possible to get sensitivity in the state of the art conventional setups, with the added benefits brought by microfluidics : (i) to consume small sample quantities, (ii) to accurately control sample injection and measurement in a real-time way and (iii) to be integrated in a multiparametric, multiprobe and multifunctional microfluidic platform.
Previous studies have shown that protein hydration, which is the interaction between a protein and water, plays an important role in protein function.18,19 Moreover, intermolecular interactions of hydrated proteins with sugars could be involved in the fascinating biopreservation phenomenon.20,21 Studying hydration with THz spectroscopy has been done previously and has shown that the behaviour of water molecules changes in the vicinity of the protein.22,23 These water molecules are usually referred to as “bound water” or “hydration water”, whereas water molecules far from the proteins are designated as “bulk water”. The bound water properties depend on protein surface chemistry, as the water behaviour around the hydrophilic and hydrophobic sites is different. Furthermore, backbone and side-chain hydration regions are also expected to be distinguishable.24 From a THz spectroscopy point of view, the absorption of the hydration water decreases, compared to bulk water, due to the rigidity of the hydrogen bonds, which is increased between protein and water.9,25–29 However, some studies show that the hydration shell absorption around proteins seems to increase due to collective vibrations.30,31 A clear understanding of these phenomena requires more THz measurements, comparison with other spectroscopy techniques and the use of computational molecular dynamics simulations.
This paper deals with sub-THz measurements on aqueous solutions of lysozyme and Bovine Serum Albumin (BSA), which are commonly used in THz spectroscopy. First, the microsystem used will be presented. Then, measurement sensitivity will be discussed and the measured data will be used to characterize the hydration of the two proteins by computing their hydration number (number of water molecules in the hydration shell). In a third part, chemometrics algorithms will be introduced to improve hydration characterization. Lastly, the hurdles to overcome, should one wish to increase the measurement frequency in the microsystem, will be discussed.
1 THz microfluidic system
To perform liquid-absorption measurements, a two-function microsystem has been developed. On the one hand, a microfluidic circuit drives the samples toward the analysis area. On the other hand, an integrated electromagnetic circuit guides the THz waves through the sample to be analyzed. The whole system is presented in Fig. 1 (left) and each function is detailed in the following sections. This microsystem is based on a glass/silicon/glass technological process. Glass is used to ensure both the transparency of the microsystem and the wave propagation with low losses (tanδ ∼ 5 × 10⁻³ at 300 GHz). To fabricate the microchannels, silicon has been chosen for its rigidity and its low losses in the terahertz range (tanδ ∼ 10−4 at 400 GHz). In contrast with glass, silicon can be accurately deep-etched, resulting in well defined narrow channels. This is crucial, because power absorption depends exponentially on the microchannel width. The use of silicon will also be useful for future microelectronic component integration to get a fully autonomous lab-on-chip for biological metrology. All the technological parameters and steps used to manufacture the BioMEMS have previously been reported.32 The independence of microfluidic and electromagnetic design has to be emphasized. Indeed, these two circuits can be modified independently without changing the technological process parameters, leading to a strong versatility in function design. This is due to the process where the whole silicon wafer is reported on the glass wafer (with THz waveguides). Then, silicon deep-etching is performed and leads to a high-density microchannel network with thin walls (width = 200 μm), which is an important refinement to limit absorption of the empty microsystem. With this clean-room process, 23 microsystems can be realized on a 3-inch glass wafer.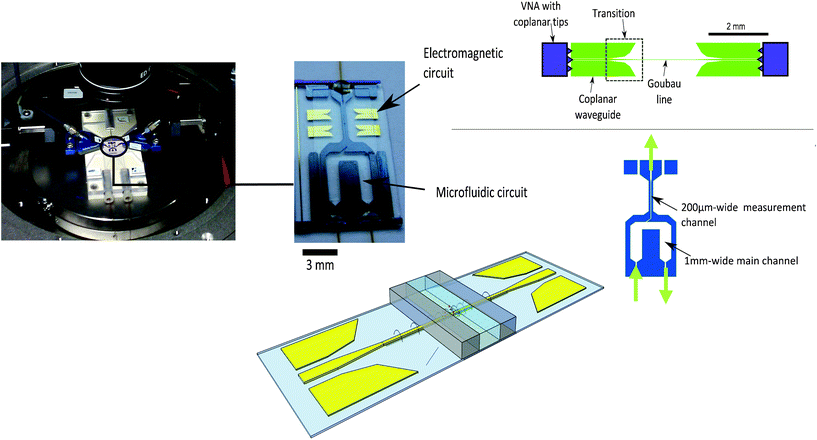 | ||
| Fig. 1 THz BioMEMS with electromagnetic and microfluidic circuits. | ||
The THz waveguide
To guide the electromagnetic wave, a single-wire propagation line has been used. This so-called “Planar Goubau Line” (PGL) enables the quasi-TEM propagation of the THz waves in a surface-wave configuration called “Goubau mode”. In this configuration, the electromagnetic fields are strongly confined around the metallic wire, whose width can be decreased down to the micrometer-scale.33 The confinement of THz waves can reach several micrometers, which corresponds to the energy exponential decay length perpendicular to the Goubau line. This confinement depends on the wire width and on the dielectric permittivity of the propagative medium (air/glass, silicon/glass or liquid/glass).Here, the Goubau mode is excited by an external Vector Network Analyzer (VNA), dedicated to coplanar waveguide excitations in the 0–110 GHz and 140–220 GHz frequency bands. This is the reason why a coplanar-waveguide/Goubau-line transition has previously been developed.34 The Goubau line and coplanar transitions are represented in Fig. 1 (upper right).
This electromagnetic circuit is made by gold deposition on a transparent glass wafer. The Goubau line width is 5 μm wide and 500 nm thick, and propagation losses are from 2 dB mm−1 to 3 dB mm−1 in the 50–220 GHz frequency band.33 Propagation on Goubau lines has been achieved for higher frequencies up to 800 GHz35 and measured losses at 0.63 THz were about 0.6 dB mm−1.36 Computations show that propagation on Goubau lines is possible in the 0.8–2 THz frequency band.37
The microfluidic circuit
To drive the sample, the 200 μm-deep microchannels are made with silicon walls sandwiched between two glass wafers.The microfluidic circuit is composed of a 1 mm-wide main channel and a 200 μm-wide measurement channel, where the THz probing will occur. Fig. 1 (bottom right) shows this two-channel configuration, which allows both a quick injection of the probed samples and a measurable transmitted signal through the 200 μm-wide sample.
The system technological process characterization has shown that pressures up to 37 bars can be applied inside the BioMEMS. Such a microsystem has already been used to probe enzymatic reactions in real-time38 and to characterize ethanol hydration layers.39 Measurements on proteins are presented in the next section. They will show that the BioMEMS is an adapted tool to perform quantitative physical analysis of the hydration phenomenon directly in a chip.
2 Protein hydration studies
Material and methods
Lyophilized powder of BSA (66, 43 kDa), α-chymotrypsine from bovine pancreas (EC 3.4.21.1; 24 kDa) and lysozyme from chicken egg white (EC 3.2.1.17; 14, 6 kDa) purchased from Sigma-Aldrich Chemical Co. have been solubilised in pure deionised Milli-Q water (Millipore, resistivity: 18 MΩ cm) at different concentrations and from independent weightings. All solutions were prepared with a total volume of 5 mL and were clear and without precipitates.Measurements have been carried out by an Agilent XF8510 VNA in the 0–110 GHz frequency band. The raw obtained parameters are the complex transmission parameter S21 and the complex reflection parameter S11. Transmitted and reflected powers can be deduced from the squared modulus of these parameters. The chronological order of sample injection has been randomly chosen in order to avoid any measurement bias. Between each measurement, water is injected as a reference sample in order to check measurement reproducibility.
Measured S21 parameters are shown in Fig. 2 for BSA solutions. The uncertainty concerning the S21 parameter measurement is δS21 ∼ 0.02 dB. The corresponding S11 parameters are not shown because they are below −10 dB on the whole frequency band and their dependence on BSA concentration is weak compared to S21.
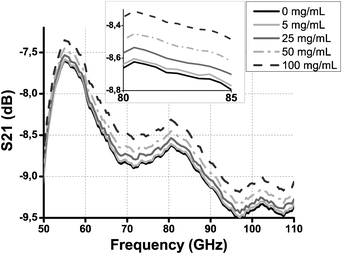 | ||
| Fig. 2 S 21 transmission parameter as a function of frequency for several BSA concentrations. Measurement uncertainty is δS21 ∼ 0.02 dB. Inset: zoom on the 80–85 GHz frequency band. | ||
Absorption extraction protocol
Since the electromagnetic propagation mode is a quasi-TEM mode, it can be assumed that the transmitted power Pt through the system is| Pt = Piexp(−K) | (1) |
| Pt = Piexp(−αL + k) | (2) |
 | (3) |
The sample absorption is thus given by
 | (4) |
This extraction protocol suffers from several assumptions, such as neglecting internal reflections and their dependence on the sample inside the microchannels. However, since sample absorption is high, these reflections are weak, as can be shown by numerical computations. Moreover, k is an unknown offset. This is the reason why the next results will be given in arbitrary units. However, the previous assumptions do not affect the quantitative differential analysis that will be done, and a calibration protocol of the system allows us to get the quantitative absorption values, as will be shown in Section 3.
Water/protein solution absorption
Fig. 3 shows the absorption of BSA and lysozyme solutions as a function of protein concentration for a frequency of 100 GHz. Increasing the protein concentration decreases the solution absorption. This is due to replacement of water molecules by proteins whose absorption is negligible in this frequency range. The absorption of a 5 mg mL−1 protein concentration can be detected and is the sensitivity of the microsystem for protein spectroscopy. This value has to be compared with previous sensitivities obtained in terahertz spectroscopy in microfluidic systems: a 100 mg mL−1 sensitivity was obtained by George et al.16 and a 50 mg mL−1 sensitivity by Kitagawa et al.27 For studies that do not use microfluidic systems, sensitivities are in the order of magnitude of 5 mg mL−1 when measuring absorption. The most significant literature studies give the following sensitivities with corresponding molar fractions xm :• 60 mg mL−1 (xm = 3.1 × 10⁻³) for sugar/water solutions by Arikawa et al.;9
• 30 mg mL−1 (xm = 11.6 × 10⁻³) for alcohol solutions by Jepsen et al.;10,40
• 10 mg mL−1 (xm = 12.6 × 10⁻³) for lysozyme solutions by Vinh et al.;23
• 2 mg mL−1 (xm = 0.93 × 10⁻⁶) for Subtilisin Carlsberg protein dissolved in dioxan organic and apolar solvent by Mickan et al.;26
• around 1 mg mL−1 (xm = 1.9 × 10⁻⁶) for λ*6–85 protein in water by Ebbinghaus et al.41
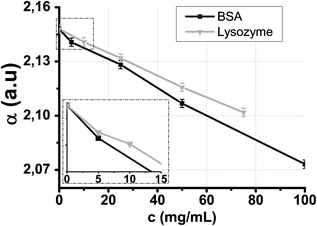 | ||
| Fig. 3 0.1 THz absorption of BSA/water and lysozyme/water solutions as a function of protein concentration. | ||
In comparison with these studies, one advantage of microfluidics is that the required sample volume decreases. Indeed, considering the 200 μm-deep and 200 μm-wide microchannel and considering that the field extent around the Goubau line is below 100 μm, the sample volume probed is below V = 200 μm × 200 μm × 200 μm = 8 nL. For BSA, the concentration sensitivity of 5 mg mL−1 (xm = 1.35 × 10⁻⁶) in the V volume leads to a 0.6 picomole detection threshold. A previously reported result for THz spectroscopy with microfluidics without integrated probes obtained a 10 picomole detection limit.16
The normalized absorption of each BSA/water and lysozyme/water solution is given as a function of concentration and of frequency in Fig. 4 in the 50–110 GHz frequency band. A very good agreement is found between these curves and the results from Kitagawa et al.,27 thus validating the absorption extraction protocol and enabling us to perform hydration quantitative analysis.
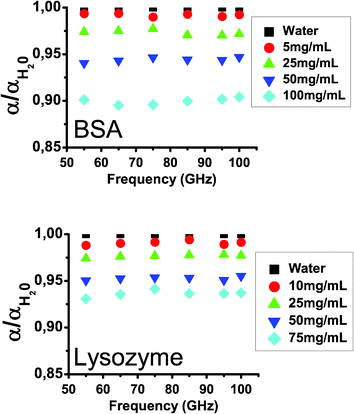 | ||
| Fig. 4 Normalized absorption of BSA/water and lysozyme/water solutions as a function of frequency and concentration. | ||
Hydration number of proteins
As previously stated, the decrease in solution absorption α when protein concentration c (mg mL−1) is increased is due to water molecule replacement by protein. The absorption decrease is called Δα = αH2O − α = αprot, where αH2O is the water solution absorption. With x as the protein volume fraction, it becomes Δα = xαH2O. Besides, x can be expressed as a function of the partial specific volume of the protein42Vs: x = cVs. However, experimentally, the measured absorption decrease is higher than the computed Δα using the previous expressions. This can be explained by assuming that water molecules in the vicinity of the protein (hydration water) no longer absorb the electromagnetic waves. This assumption13,39 will be discussed experimentally in the next section. In this case, for a solution volume V:| Δα = αprot + αhydr = xαH2O + xhydrαH2O | (5) |
 | (6) |
Thus, Nh uncertainties can be computed with the following formula :
 | (7) |
 | ||
| Fig. 5 Hydration number Nh for lysozyme, BSA and chymotrypsine as a function of frequency and protein concentration. N*h is the corrected hydration number, as defined in Section 3. | ||
It can be observed that Nh seems to depend on frequency. However, Nh uncertainty margins overlap on the entire frequency band and their intersection should give the best estimation for Nh. Besides, the computed Nh decreases when the protein concentration increases. Actually, this is due to hydration shells overlapping: when protein density increases, a hydration water molecule can be shared between several proteins and the Nhydr = NprotNh equation is no longer respected. Moreover, we will show in the next part that the model used is approximate and only quantifies the number of water molecules in the direct vicinity of the proteins (first hydration layer). However, it has been largely used in literature25–28 and gives a good approximation of the Nh order of magnitude from THz spectroscopy of proteins.
The hydration of proteins can thus be quantitatively probed in the microsystem. Moreover, due to the accuracy and sensitivity of the developed microsystem, it can also become a tool to increase our understanding of bio-chemical phenomena. Indeed, the next part will show that a combination of microsystem measurements and chemometrics algorithms leads to a better understanding of hydration processes.
3 Ethanol hydration insight
Several previous studies have focused on characterizing alcohol/water mixtures in the THz spectrum.10,25 Compared to proteins, which have a limited solubility, when working with alcohol one can produce a continuum of samples with concentrations spanning from pure water to pure alcohol. As a result, large datasets can be generated for further analysis. In this part, the sub-THz spectroscopy of alcohol/water mixtures is presented. First, the absorption of the mixtures will be given. Then, the full measurement dataset will be analyzed by chemometrics algorithms in order to extract maximum information from the measured broadband data. From that, an improved model of solvated molecule hydration will be postulated.Alcohol/water mixture absorption
Ethanol/water, isopropanol/water and propanol/water mixtures have been prepared with alcohol volume ratios x from 0 to 1 in steps of 0.05. Ethanol, propanol and isopropanol are from Carlo Erba Reagents. Pure deionised water is obtained from a Barnstead Easy-Pure RoDi purification system with a resistivity of 18.2 MΩ cm.By a calibration step, using absorption Debye models for alcohol and water from previous studies,46–48 the absorptions of the injected mixtures are obtained as shown in Fig. 6. As observed for the protein study, increasing the alcohol content decreases the solution absorption. Indeed, water molecules are progressively replaced by alcohol molecules, whose absorption is weaker. As already observed, pure isopropanol absorption is weaker than propanol absorption, which is weaker than ethanol absorption. It is possible to use the measured absorptions to characterize alcohol hydration number in quite a similar way as presented in the previous section. This study has already been reported for ethanol/water mixtures.39
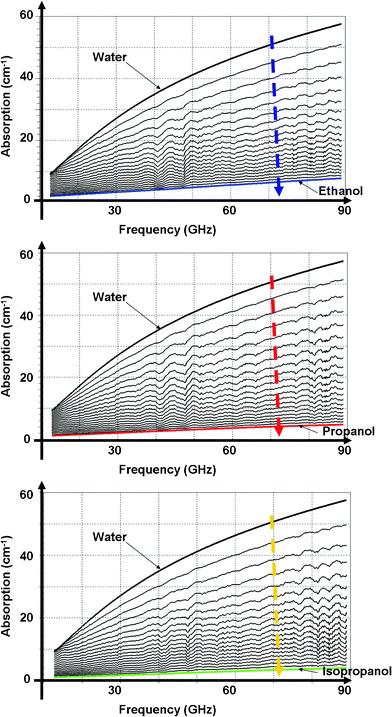 | ||
| Fig. 6 Ethanol/water, propanol/water and isopropanol/water mixture absorptions as a function of frequency for several ethanol volume ratios. The arrow indicates the increase of alcohol volume ratio in steps of 0.05. | ||
Here, the study goes further, using multivariate analysis i.e. exploiting simultaneously all frequencies in the spectral domain. Note that in the next section, the raw (non-calibrated) absorption dataset will be used.
Linear decomposition of the dataset
Measured absorption spectra are rather flat and do not show obvious features that can be considered as molecular signatures. However, it is possible to apply advanced algorithms to these spectra to better characterize the measured mixtures. These algorithms, coming from the field of chemometrics, are commonly used for vibrational spectroscopy.49–51 Their goal here is to decompose the solution spectra as a sum of the pure spectral contributions of each solution component, multiplied by the component volume ratio: | (8) |
The first step in the decomposition is to determine the number n of pure components observable in the spectral dataset. This is made by using a Principal Component Analysis (PCA) algorithm, based on singular value decomposition.52 Then, an iterative algorithm (MCR-ALS : Multivariate Curve Resolution – Alternating Least Squares53–55) is used to decompose the whole dataset to determine xi for each mixture and αi for each frequency. Methodology concerning this study has been reported elsewhere.56 Here we want to present the study results in the case of ethanol/water mixtures. They show that four species can be observed in the absorption spectrum of an ethanol/water mixture. The spectra of each component, and the corresponding volume fraction in each mixture are given in Fig. 7 (left). Note that the absorption spectra are non-calibrated. Indeed, they correspond to the convolution of the liquid calibrated absorption and the microsystem instrument function. However, the instrument function does not depend on the liquid inside the microchannels and so, the differences observed between the non-calibrated absorption spectra are directly correlated to the liquid calibrated absorption spectra.
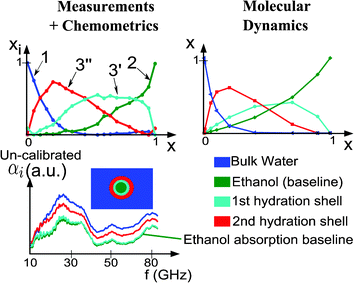 | ||
| Fig. 7 Decomposition of the measurement dataset by MCR-ALS. Concentration of the four species as a function of ethanol volume ratio. Non-calibrated absorption of the four species as a function of the frequency. | ||
Component 1 disappears when the ethanol volume ratio increases. The concentration of component 2 increases with ethanol volume ratio. The highest absorption in the whole frequency band is the component 1 absorption, whereas the lowest one is the component 2 absorption. As a consequence, component 1 is bulk water and component 2 is ethanol. Components 3′ and 3′′ show more complex behaviour. They correspond to the hydration shell of ethanol. 3′ is the first hydration layer, strongly linked to ethanol, and whose absorption is quite the same as ethanol (far below water) and 3′′ is the second hydration layer with an intermediate absorption. To validate this explanation, Molecular Dynamics (MD) simulations have been performed for the ethanol/water mixtures using the DL POLY program.57 The all-atom optimized potentials for liquid simulations (OPLS) force-field58 was used to model the intra and intermolecular interactions of ethanol molecules. Rigid water molecules were modeled using the TIP4P/2005 force-field.59 Results of MD are shown in Fig. 7 (right) and show a very good agreement with the chemometrics results. The whole methodology used for MD simulations has been reported elsewhere.60 Investigations on isopropanol/water and propanol/water give the same behaviours.
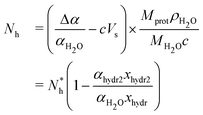
The conclusion of such a study is that two hydration layers can be probed in the investigated frequency band. The first layer absorption is very weak, whereas the second layer absorption is an intermediate between water and ethanol. Since the absorption of water molecules directly linked to the solvated molecule is negligible compared to bulk water, the computed Nh in the previous section appears to be an approximation of the number of water molecules in the first hydration layer. Extending the MCR-ALS results to solvated proteins (protein volume ratio is x), the number of water molecules in the whole hydration shell (first and second layer) can be estimated by writing the absorption of a diluted protein solution :
| α = xαprot + xhydr1αhydr1 + xhydr2αhydr2 + (1 − x − xhydr1 − xhydr2)αH2O | (9) |
 | (10) |
Further work will be dedicated to increasing the investigated frequencies. However, the transmitted signal decreases when frequency increases and will limit the use of the microsystem beyond 220 GHz. This can be explained by the substrate mode phenomenon: beyond a critical frequency (around 180 GHz in the microsystem), the whole electromagnetic wave is no more guided by the Goubau line but progressively by the substrate and thus it is no longer entirely detected in the transmitted signal. This drawback can be overcome by integrating corrugated Goubau lines in the microsystem.61 Since Vector Network Analyzers are now able to deliver frequencies of up to 1 THz, the described study has to be extended to 1 THz, in order to look at the frequency dependence of hydration probing in the microfluidic system.
Another perspective of this work is to study the influence of pH on protein hydration shells.62 Here, protein were dissolved in pure deionised water in order to avoid the presence of supplementary ions, which could interact with THz waves. However, the next work will be to modify the solution pH and to observe the variations in hydration properties, as a function of the iso-electric point of the protein, for instance. Hydration characterization could also lead to protein conformation monitoring by THz waves in the microsystem.
Conclusion
These studies have demonstrated that the developed microsystem is able to reach a sensitivity comparable to the sensitivity obtained with macroscale setups, with the added benefits of using small sample quantities. This sensitivity makes it possible to perform quantitative analysis of the protein hydration. The use of chemometrics algorithms on our measurements improves our understanding of the hydration bio-chemical phenomenon. They enable us to clarify the extraction model chosen for computing the hydration number. Indeed, we believe chemometrics is well suited to exploring and analyze high-throughput measurement data obtained by the “lab-on-a-chip” approach. This combination hints at a new way to develop liquid metrology platforms dedicated to biology, liquid physics or chemistry.References
- M. Tonouchi, Nat. Photonics, 2007, 1, 97–105 CrossRef CAS.
- P. H. Siegel, IEEE Trans. Microwave Theory Tech., 2004, 52, 2438–2447 Search PubMed.
- A. McIntosh, B. Yang, S. Goldup, M. Watkinson and R. Donnan, Chem. Soc. Rev., 2012, 41, 2072–2082 RSC.
- C. Yu, S. Fan and E. Pickwell-MacPherson, Quantitative Imaging in Medicine and Surgery, 2012, 2, 33–45 Search PubMed.
- M. Nagel, F. Richter, P. Haring-Bolivar and H. Kurz, Phys. Med. Biol., 2003, 48, 3625–3636 Search PubMed.
- A. Markelz, S. Whitmire, J. Hillebrecht and R. Birge, Phys. Med. Biol., 2002, 47, 3797–3805 CrossRef CAS.
- A. G. Markelz, IEEE J. Sel. Top. Quantum Electron., 2008, 14, 180–190 CrossRef CAS.
- D. M. Leitner, M. Gruebele and M. Havenith, HFSP J., 2008, 2, 314–323 Search PubMed.
- T. Arikawa, M. Nagai and K. Tanaka, Chem. Phys. Lett., 2008, 457, 12–17 Search PubMed.
- U. Moller, D. G. Cooke, K. Tanaka and P. U. Jepsen, J. Opt. Soc. Am. B, 2009, 26, A113–A125 Search PubMed.
- J. Kindt and C. Schmuttenmaer, J. Phys. Chem., 1996, 100, 10373–10379 CrossRef CAS.
- T. Globus, D. Woolard, T. Crowe, T. Khromova, B. Gelmont and J. Helser, J. Phys. D: Appl. Phys., 2006, 39, 3405–3413 Search PubMed.
- J. Xu, K. Plaxco and S. Allen, Protein Sci., 2006, 15, 1175–1181 CrossRef CAS.
- C. C. Cooksey, B. J. Greer and E. J. Heilweil, Chem. Phys. Lett., 2009, 467, 424–429 Search PubMed.
- V. Mille, N. Bourzgui, F. Medjdoub and B. Bocquet, European Microwave Conference, 2004, 1, 169–172 Search PubMed.
- P. A. George, W. Hui, F. Rana, B. G. Hawkins, A. E. Smith and B. J. Kirby, Opt. Express, 2008, 16, 1577–1582 CrossRef CAS.
- V. Matvejev, C. De Tandt, W. Ranson, J. Stiens, R. Vounckx and D. Mangelings, Prog. Electromagn. Res., 2011, 121, 89–101 Search PubMed.
- P. W. Fenimore, H. Frauenfelder, B. H. McMahon and R. D. Young, Proc. Natl. Acad. Sci. U. S. A., 2004, 101, 14408–14413 CrossRef CAS.
- H. Frauenfelder, G. Chen, J. Berendzen, P. W. Fenimore, H. Jansson, B. H. McMahon, I. R. Stroe, J. Swenson and R. D. Young, Proc. Natl. Acad. Sci. U. S. A., 2009, 106, 5129–5134 CrossRef CAS.
- N. Jain and I. Roy, Protein Science, 2009, 18, 24–36 CAS.
- A. Lerbret, F. Affouard, P. Bordat, A. Hedoux, Y. Guinet and M. Descamps, J. Non-Cryst. Solids, 2011, 357, 695–699 Search PubMed.
- M. Heyden and M. Havenith, Methods, 2010, 52, 74–83 CrossRef CAS.
- N. Vinh, S. Allen and K. Plaxco, J. Am. Chem. Soc., 2011, 133, 8942–8947 Search PubMed.
- B. Jana, S. Pal and B. Bagchi, J. Chem. Sci., 2012, 124, 317–325 Search PubMed.
- Y. I. Khurgin, V. A. Kudryashova and V. A. Zavizion, Radiotekhnika I Elektronika, 1996, 41, 737–743 Search PubMed.
- S. P. Mickan, J. Dordick, J. Munch, D. Abbott and X. C. Zhang, Biomedical Applications of Micro- and Nanoengineering, 2002, 4937, 49–61 Search PubMed.
- J. Kitagawa, T. Ohkubo, M. Onuma and Y. Kadoya, Appl. Phys. Lett., 2006, 89, 041114 Search PubMed.
- J. Xu, K. Plaxco and S. Allen, J. Phys. Chem. B, 2006, 110, 24255–24259 CrossRef CAS.
- S. Pal, J. Peon and A. Zewail, Proc. Natl. Acad. Sci. U. S. A., 2002, 99, 1763–1768 CrossRef CAS.
- U. Heugen, G. Schwaab, E. Brundermann, M. Heyden, X. Yu, D. M. Leitner and M. Havenith, Proc. Natl. Acad. Sci. U. S. A., 2006, 103, 12301–12306 CrossRef CAS.
- B. Born and M. Havenith, Journal of Infrared Millimeter and Terahertz Waves, 2009, 30, 1245–1254 Search PubMed.
- S. Laurette, A. Treizebre and B. Bocquet, J. Micromech. Microeng., 2011, 21, 065029 Search PubMed.
- A. Treizebre and B. Bocquet, Int. J. Nanotechnol., 2008, 5, 784–795 Search PubMed.
- A. Treizebre, B. Bocquet, Y. S. Xu and R. G. Bosisio, Microwave Opt. Technol. Lett., 2008, 50, 2998–3001 Search PubMed.
- L. Dazhang, J. Cunningham, M. Byrne, S. Khanna, C. Wood, A. Burnett, S. Ershad, E. Linfield and A. Davies, Applied Physics Letters Search PubMed 95, year.
- D. Gacemi, J. Mangeney, T. Laurtent, J. Lampin, T. Akalin, K. Blary, A. Degiron, P. Crozat and F. Meng, Opt. Express, 2012, 20, 8466–8471 Search PubMed.
- S. Laurette, A. Treizebre, N. Bourzgui and B. Bocquet, Prog. Electromagn. Res. Lett., 2012, 30, 49–58 Search PubMed.
- A. Abbas, A. Treizebre, P. Supiot, N. E. Bourzgui, D. Guillochon, D. Vercaigne-Marko and B. Bocquet, Biosens. Bioelectron., 2009, 25, 154–160 CrossRef CAS.
- S. Laurette, A. Treizebre, F. Affouard and B. Bocquet, Appl. Phys. Lett., 2010, 97, 111904 Search PubMed.
- P. U. Jepsen, U. Moller, F. Eichhorn, H. Merbold, J. R. Folkenberg and S. J. Clark, 2007 Conference On Lasers & Electro-optics/quantum Electronics and Laser Science Conference, 2007, 1–5, 1740–1741 Search PubMed.
- S. Ebbinghaus, S. J. Kim, M. Heyden, X. Yu, U. Heugen, M. Gruebele, D. M. Leitner and M. Havenith, Proc. Natl. Acad. Sci. U. S. A., 2007, 104, 20749–20752 CrossRef CAS.
- K. Gekko and H. Noguchi, J. Phys. Chem., 1979, 83, 2706–2714 CrossRef CAS.
- M. Suzuki, J. Shigematsu and T. Kodama, J. Phys. Chem., 1996, 100, 7279–7282 Search PubMed.
- T. Yoshida, H. Inagaki, H. Kamya and I. Ueda, J. Phys. Chem. B, 2001, 105, 256–260 Search PubMed.
- K. Yokoyama, T. Kamei, H. Minami and M. Suzuki, J. Phys. Chem. B, 2001, 105, 12622–12627 Search PubMed.
- T. Sato and R. Buchner, J. Chem. Phys., 2003, 118, 4606–4613 CrossRef CAS.
- T. Sato and R. Buchner, J. Phys. Chem. A, 2004, 108, 5007–5015 CrossRef CAS.
- J. Barthel and R. Buchner, Pure Appl. Chem., 1991, 63, 1473–1482 CAS.
- N. Gracia, S. Thomas, F. Thibault-Starzyk, O. Lerasle and L. Duponchel, Chemom. Intell. Lab. Syst., 2011, 106, 210–215 Search PubMed.
- C. Ruckebusch, A. D. Juan, L. Duponchel and J. Huvenne, Chemom. Intell. Lab. Syst., 2006, 80, 209–214 CrossRef CAS.
- C. Ruckebusch, L. Duponchel, J. P. Huvenne and J. Saurina, Anal. Chim. Acta, 2004, 515, 183–190 CrossRef.
- E. Malinowski, Factor analysis in chemistry, Wiley-Interscience, New York, 2nd edn, 1992 Search PubMed.
- R. Tauler, Chemom. Intell. Lab. Syst., 1995, 30, 133–146 CrossRef CAS.
- A. de Juan and R. Tauler, Anal. Chim. Acta, 2003, 500, 195–210 CrossRef CAS.
- S. Navea, A. de Juan and R. Tauler, Anal. Chem., 2003, 75, 5592–5601 CrossRef.
- L. Duponchel et al., Analytica Chimica Acta, Search PubMed submitted.
- W. Smith, C. W. Yong and P. M. Rodger, Molecular Simulation, 2002, 28, 385–471 CrossRef CAS.
- W. L. Jorgensen, D. S. Maxwell and J. Tirado-Rives, J. Am. Chem. Soc., 1996, 118, 11225–11236 CrossRef CAS.
- J. L. F. Abascal and C. Vega, J. Chem. Phys., 2005, 123, 234505 CrossRef CAS.
- F. Affouard et al., Journal of Physical Chemistry B., Search PubMed submitted.
- S. Laurette, A. Treizebre and B. Bocquet, IEEE Trans. Terahertz Sci. Technol., 2012, 2, 340–344 Search PubMed.
- S. Ebbinghaus, S. J. Kim, M. Heyden, X. Yu, M. Gruebele, D. M. Leitner and M. Havenith, J. Am. Chem. Soc., 2008, 130, 2374–2375 CrossRef CAS.
| This journal is © The Royal Society of Chemistry 2012 |
