Addressing the terawatt challenge: scalability in the supply of chemical elements for renewable energy†
Peter C. K.
Vesborg
*a and
Thomas F.
Jaramillo
b
aTechnical University of Denmark (DTU), Department of Physics, Bld. 307, Fysikvej, DK-2800, Kgs. Lyngby, Denmark
bStanford University, Department of Chemical Engineering, Stanford, CA-94305, USA
First published on 1st June 2012
Abstract
The energy infrastructure for fossil fuels is well-established, accounting for approximately 87% of the 16 TW of power consumed globally. For renewable and sustainable energy conversion technologies to play a relevant role at the terrestrial scale, they must be able to scale to the TW level of deployment. This would place a significant demand on the current and future supply of raw materials (chemical elements) used by those technologies. Oftentimes, the average crustal abundance of a chemical element is cited as a measure of its scalability, however another important metric for scalability is the existence (of lack thereof) of mineable ores with a high concentration of the targeted element. This paper aims to provide an overview of the availability of all elements. This is accomplished via a compilation of data for global primary production rates for each element, as a measure of availability at the present time. This work also addresses the potential future availability based on current and possible future primary sources.
1 Introduction-materials for terawatt-scale deployment
Richard Smalley has named the global energy problem “The Terawatt Challenge”.1 This is an appropriate expression since society currently consumes 16.0 TWavg of primary power of which 87% is based on burning fossil fuels2 and it is estimated that by 2050 the demand for primary power will be on the order of 30 TWavg.3,4 For this reason, any technology for energy harvesting, conversion or storage in a sustainable future must be able to scale to the TW-level to make a relevant impact at the global scale. This scaling requirement is true for photovoltaics, wind turbines, solar fuels, biomass conversion catalysts, electrification of automotive vehicles, fuel cells, storage batteries, flow batteries and any other energy conversion technology.1.1 The problem with crustal abundance
Within the broad field of energy conversion technologies there is an understanding that the limited availability of a material (chemical element) can potentially limit the deployment of a technology that relies on that material. Most researchers agree that elements with low crustal abundance like iridium or xenon are too scarce to be useful on a large scale. On the other hand, elements like gallium, or scandium which are about as abundant as lead in earth’s crust seem plentiful enough to be useful for energy transformation technologies. This study argues that basing availability assessments solely on crustal abundance can be potentially misleading. Indeed, there are elements with high (average) crustal concentration, but without the tendency to concentrate into ores with sufficiently high concentration to allow economical mining. The ability for an element to naturally up-concentrate itself into mineable ores is important since only about half of the naturally occurring chemical elements have an average crustal concentration higher then 5 g t−1 (5 ppm). A typical grade for platinum or gold ore (which represents the lowest grade ores currently mined for any primary product) is around 4 g t−1. Conversely, there are elements that can be mined economically despite very low average crustal abundance because they have a tendency to from ore bodies with a concentration much higher than the average crustal average.Silver and indium exemplify this point: Both have an average crustal abundance of about 0.1 g t−1, but while the primary production of silver is 22![[thin space (1/6-em)]](https://www.rsc.org/images/entities/char_2009.gif) 500 t yr−1 that of indium is only around 530 t yr−1. One important reason for the large silver production (relative to indium) is that silver is often found in certain minerals with thousands of times the average crustal concentration. Combined zinc–lead–silver ores often hold 100–400 g t−1 of silver (i.e. 1000 times the crustal average concentration) and “pure” silver ores may contain as much as 2000 g t−1 of silver (or ∼20000 times the crustal average concentration). Contrast this to indium which has a poor affinity for the common ore forming anions. In this case, the best known deposit in the world (Mt. Pleasant in New Brunswick, Canada) has an indium concentration of only 133 g t−1; and furthermore, the deposit is a very small resource—estimated to hold just 680 t indium (15 months of global production) at the stated concentration.5 Larger deposits such as Dachang in China contain indium deposits of much lower concentration, in the range of 40–60 g t−1.
500 t yr−1 that of indium is only around 530 t yr−1. One important reason for the large silver production (relative to indium) is that silver is often found in certain minerals with thousands of times the average crustal concentration. Combined zinc–lead–silver ores often hold 100–400 g t−1 of silver (i.e. 1000 times the crustal average concentration) and “pure” silver ores may contain as much as 2000 g t−1 of silver (or ∼20000 times the crustal average concentration). Contrast this to indium which has a poor affinity for the common ore forming anions. In this case, the best known deposit in the world (Mt. Pleasant in New Brunswick, Canada) has an indium concentration of only 133 g t−1; and furthermore, the deposit is a very small resource—estimated to hold just 680 t indium (15 months of global production) at the stated concentration.5 Larger deposits such as Dachang in China contain indium deposits of much lower concentration, in the range of 40–60 g t−1.
Jack Lifton has described the issue in this manner:6
“The distribution of a metal in the earth’s crust or ocean has absolutely nothing to do with its availability or accessibility.”
A critical parameter is the concentration of any given element in mineable ore bodies. In effect, an ore body where a given element is highly concentrated with respect to its average crustal concentration represents an exergy resource because the entropic work of concentration has been done by nature. Treating concentrated resource ores as available exergy is a powerful concept which allows comparison between ores of different elements and even fossil fuels (also an exergy source) on an equal footing.7
Martin Green has suggested the following empirical relation between market price and ore concentration:
| P = C/core | (1) |
000 [$ kg−1 × g t−1] and core is the ore concentration in g t−1 (ppm).5 If, for example, a given platinum ore contains 4 g t−1, the resulting estimate for the cost of production is ∼$42000 kg−1 (or $1300 tr oz−1) which is close to the actual market price. The simple formula empirically describes the fact that it takes a certain amount of work and energy (exergy, actually) to dig out and crush the ore and to extract and concentrate the product. The required energy input for mining has been estimated to be ∼0.4 MJ kg−1ore for open pit mining and ∼1 MJ kg−1ore for underground mining.7 Combining this energy estimate with relation 1 gives a ratio between the product price and energy spent on extraction in the $0.05–$0.2 MJ−1-range. Comparison to the market price for fossil fuels (∼$0.0046 MJ−1 for coal and ∼$0.019 MJ−1 for oil) suggests that energy costs in general represent a very significant fraction of the market price of minerals.
It is also important to distinguish between elements whose production is the main economic product of mining a given ore body and those elements which are produced as by-products of a different main product. In fact, ∼36 of the 81 non-radioactive elements ‡ are produced only (or mainly) as by-products of other elements. This is important because the supply of by-products tends to be very inelastic § to increases in demand (and price) once the available material in the tailings stream of the primary product are exhausted. Relation 1 therefore, only really applies to main products. A good example of this occurred from 2004–2008 where the industrial demand for rhodium (which is essentially only produced as a by-product of platinum) increased beyond supply and the de-stocking that resulted caused the price of rhodium to go from $16000 kg−1 in 2003 to over $300000 kg−1 in 2008.8,9 Interestingly, this near-twenty fold increase in the price of rhodium caused only a very modest increase in primary supply¶ from 22.5 t in 2003 to 25.5 t in 2007 (in 2008 primary supply was down to 21.5 t due to reduced demand during the financial crash) and the increase was most likely due to modestly increasing platinum prices rather than exploding rhodium prices.
Clearly, crustal abundance taken alone gives only a vague indication of the availability chemical elements. Furthermore, the supply–demand dynamics for by-products mean that an increase in demand and price does not automatically lead to increased production.
1.2 How much is available now?
Recognizing that even high crustal abundance does not guarantee availability, this study presents an analysis of a compilation of data for current (2010) global production (kg year−1) of the chemical elements. In effect, this represents the confirmed, here-and-now availability of every element, but comments about potential future availability are included where relevant. For completeness, almost all elements for which data can be obtained have been included even if they have no current applications for energy harvesting, storage or transformation. Information about primary production sources (particularly for by-products) is included whenever relevant and available. Secondary production (de-stocking from stockpiles, recycling etc.) is not included in any figures since only primary sources can contribute in a meaningful way to TW-scale rollout of any of the energy technologies in question.The overall economic significance of any given element may be estimated by the market value of the global annual production which is trivial to calculate when approximate market prices are available. Most low-volume elements|| have very volatile prices so the reader may want to look up current market prices for up-to-date data, but production figures are much less volatile. The relationship between current market price and global production rate for each element is shown in the supporting information, Fig. S1, ESI.†
1.3 Sources of data and methodology
Reputed sources such as yearbooks from the US Geological Survey,10 the British Geological Survey11 and Natural Resources Canada,12 have been consulted as primary information sources in order to estimate global production figures for most of the elements by averaging their estimates. Where relevant, well-reputed industry publications have also been consulted (e.g. annual reports from Johnson Matthey, the International Copper Study Group, the Copper Development Association, the International Energy Agency, Indium Corporation, the International Lead and Zinc Study Group, the International Nickel Study Group, the World Gold Council, the Silver Institute, the Minor Metals Trade Association and Lipmann Walton & Co Ltd.). For many elements, however, standardized data are not readily accessible and in these cases specialized reports from reputed sources such as the US Department of Energy (DOE) and JRC-IET (under the European Commission) have been consulted. As a secondary source of information, reports from specialized consultancies such as Technology Materials Research (TMR), Materials innovation institute (M2i) and Roskill Mineral Services (RMS) have been consulted.Careful production estimates of certain elements (such as tellurium) can be found in the peer reviewed literature, but a few elements including the heaviest of the lanthanides (holmium–lutetium) and certain noble gases have been estimated in the present work after review of the available literature on production technology and elemental concentration in the primary product stream. Whenever possible, the data pertains to 2010 annual production, otherwise data from the most recent year is presented. Notes are provided in the tables whenever production figures are old or are regarded as more than 30% uncertain (0.1 on the log-scale) although production figures for most elements have much lower uncertainty than this (as judged by the degree of agreement between independent information sources).
Price estimates are compiled from various websites of metal exchanges and trade associations (London Metal Exchange, Commodity Exchange Inc., Minor Metals Trade Association, metal-pages.com, asianmetal.com, mineralprices.com, platinum.matthey.com, etc.). Whenever possible, the prices reported are approximate spot prices from October–November 2011. Up to date prices for a few of the minor elements are not published in the public domain and in these cases price estimates are provided based on chemical encyclopaedia (Ullmann’s Encyclopedia of Industrial Chemistry and Kirk-Othmer Encyclopedia of Chemical Technology) or from the sources mentioned in the preceding paragraph.
2 Data
2.1 Global annual production
This section contains figures and tables with data for all naturally occurring elements. The production figures always pertain to the total mass of the element contained in useful industrial forms (except for nitrogen, oxygen, hydrogen, silicon and carbon where only the following forms are included: ammonia, O2, H2, Si and graphite). The elements are classified into four groups according to annual production: The first group (Table 1) comprises 25 main industrial elements whose global annual production exceeds 1 Mt. These elements are colour coded as green in the figures. The second group (Table 2) comprises 15 low volume industrial elements whose annual production is less than 1 Mt, but exceeds 33 kt.** In the figures, these less-available elements appear in light-green colour. The third group (Table 3) comprises the 16 elements for which global production is very low (but exceeds 1 kt yr−1) and these are colour coded as orange. The fourth and final group (Table 4) contains the 25 elements of which the production is extremely low (less than 1 kt yr−1) and these are colour coded in red.Fig. 1 shows a logarithmic plot of the estimated global annual production of each element as a function of its atomic number. To highlight the difference between elements which are mostly the primary economic product of their extraction (main products) from those which are mostly by-products of some other element, the data markers of the latter are open circles coloured blue instead of instead of dots coloured black. Fig. 1 is similar to the familiar plot of crustal abundance, but it highlights key information on current availability and the nature (main/by-product) of the element.
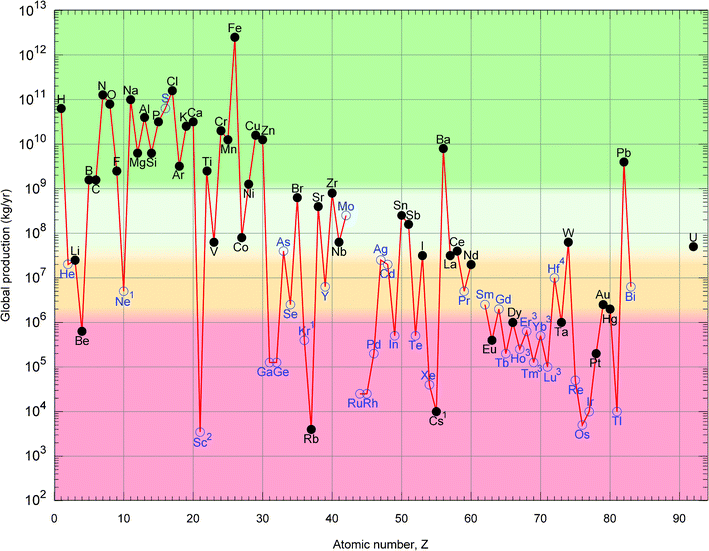 | ||
| Fig. 1 Global primary production of the elements in 2010. Solid symbols and black font are used for elements which are main economic products of their respective ores while open symbols and blue font are used for the elements which are mostly by-products of other elements. Notes: 1: Production figures for Ne, Kr and Cs are not available. The data presented are upper bounds. 2: Trustworthiness of the data for Sc is not clear. The true production could be higher. 3: Production data for the heaviest lanthanides, Ho, Er, Tm, Yb and Lu are not available and have been estimated. 4: The figure presented for Hf includes the Hf contained in Zr and Zr-compounds. Zr-free Hf production is two orders of magnitude lower. | ||
Fig. 2 shows the periodic table in a familiar layout where the colouring serves to provide a quick overview of availability and main/by-product nature of all the elements. When available, there are three numbers shown within the elements. The first of these is the logarithm (base 10) of the annual production, p, in kg. The second number is the logarithm of the price, P, in $ kg−1 and the third is the logarithm of the resulting market value, V, in $ yr−1 (trivially, the sum of the previous two logarithms).
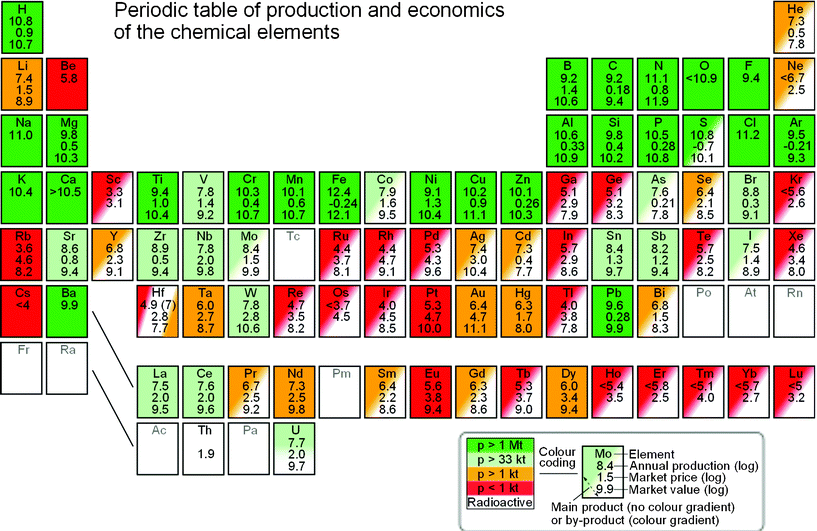 | ||
| Fig. 2 Periodic table of the elements with data for production, price and implied value for the year 2010. The colour coding (green, light-green, orange and red) corresponds to overall production level (medium to high, low, very low and extremely low, respectively). Solid colour is used for elements which are chiefly main economic products of their respective ores while a diagonal gradient in colour is used for elements which are mostly by-products of other elements. | ||
In the following sections, the chemical elements are ordered by falling global annual production rate i.e. the highest volume elements are treated first.
2.2 High volume elements-the top 25
There are 25 chemical elements produced in quantities exceeding 1 Mt yr−1 which means that an energy-related technology which uses 1 gram of a given element for each Watt can be implemented at a rate of at least 1 TW yr−1 if all current production of that element could be diverted to that energy technology. An example of a technology which has a material intensity in the range of Table 1 is wind turbines: 1 TWp of wind turbine requires about 83 Mt of mild steel.13 As may be deduced from Table 1 the 25 “megaton” elements are all of large economic significance (≥ 109 $ yr−1) although iron/steel, nitrogen (ammonia), copper and aluminium dominate from an economic perspective and iron/steel stands out from a mass perspective.| log(p) | log(P) | log(V) | M/B | Comment | |
|---|---|---|---|---|---|
| Fe | 12.4 | −0.24 | 12.1 | M | |
| Cl† | 11.2 | M | NaCl | ||
| — | 10.7 | Cl 2 | |||
| N† | 11.1 | 0.8 | 11.9 | M | NH3 only |
| Na† | 11.0 | M | NaCl | ||
| O | < 10.9 | −1.4 | M | O2 only | |
| H | 10.8 | 0.9 | 10.7 | M | H2 only |
| S | 10.8 | −0.7 | 10.1 | B | Oil by-prod. |
| Al | 10.6 | 0.3 | 10.9 | M | |
| Ca† | > 10.5 | M | Ca compounds | ||
| P† | 10.5 | −0.28 | 10.8 | M | Phosphate rock |
| K† | 10.4 | M | K compounds | ||
| Cr | 10.3 | 0.4 | 10.7 | M | |
| Cu | 10.2 | 0.9 | 11.1 | M | |
| Mn | 10.1 | 0.6 | 10.7 | M | |
| Zn | 10.1 | 0.26 | 10.3 | M | |
| Ba† | 9.9 | M | Mostly BaSO44 | ||
| Mg† | 9.8 | 0.5 | 10.3 | M | Mg compounds |
| — | 8.9 | Mg metal | |||
| Si† | 9.8 | 0.4 | 10.2 | M | Si only, no SiO2 |
| Pb | 9.6 | 0.28 | 9.9 | M,B | Also a by-prod. of Zn |
| Ar | 9.5 | −0.21 | 9.3 | M | |
| F† | 9.4 | M | Mostly CaF2 | ||
| Ti† | 9.4 | 1.4 | 10.4 | M | TiO2 + FeTiO3 |
| — | 8.1 | Ti metal | |||
| B† | 9.2 | 1.4 | 10.6 | M | B compounds |
| C | 9.2 | 0.18 | 9.4 | M | Graphite only |
| Ni | 9.1 | 1.3 | 10.4 | M |
2.3 Low volume elements
The elements in this section are numbers 26 through 40 in descending order of annual production ranging from just under 1 Mt yr−1 to 33 kt yr−1 (plus thorium). This range of annual production rates is relevant for a number of renewable energy technologies, including thin-film solar photovoltaics. For example, to produce 1 TWp of CdTe-based solar panels requires approximately 75 kt (log(p) = 7.9) each of cadmium and tellurium. Unfortunately neither cadmium nor tellurium is in found in this group.| log(p) | log(P) | log(V) | M/B | Comment | |
|---|---|---|---|---|---|
| Zr | 8.9 | 0.5 | 9.4 | M | Mostly ZrO2 |
| Br | 8.8 | (0.3) | M | ||
| Sr | 8.6 | 0.8 | 9.4 | M | Sr compounds |
| Mo | 8.4 | 1.5 | 9.9 | B,M | By-prod. [Cu] |
| Sn | 8.4 | 1.3 | 9.4 | M | |
| Sb | 8.2 | 1.2 | 9.4 | M | |
| Co | 7.9 | 1.6 | 9.5 | B | |
| Nb | 7.8 | 2.0 | 9.8 | M | |
| W | 7.8 | 2.8 | 10.6 | M | |
| V | 7.8 | 1.4 | 9.2 | M | |
| U | 7.7 | 2.0 | 9.7 | M | Radioactive |
| Ce | 7.6 | 2.0 | 9.6 | M | With La and Nd |
| As | 7.6 | 0.21 | 7.8 | B | |
| La | 7.5 | 2.0 | 9.5 | M | With Ce and Nd |
| I | 7.5 | (1.4) | M | ||
| Th | 1.9 | M | Radioactive |
2.4 Very low volume elements
This group contains elements 43 through 68 in order of descending production, from 33 kt yr−1 to 1 kt yr−1. Production rates of these elements are so low that only renewable energy technologies that use elements from this group in very small quantities can readily scale to the TW-level. An example could be dysprosium, an element which is added in small amounts to neodymium-based permanent magnets for use in certain modern wind turbines in order to increase their service temperature limit. It is estimated that 1 TWp of such wind turbines requires 12.5 kt of dysprosium (log(p) = 7.1), i.e. about 12 times the current annual production.| log(p) | log(P) | log(V) | M/B | Comment | |
|---|---|---|---|---|---|
| Ag | 7.4 | 3.0 | 10.4 | B | Mostly by-prod., ∼30% prim. prod. |
| Li | 7.4 | 1.5 | 8.9 | M | |
| Nd | 7.3 | 2.5 | 9.8 | M | With La and Ce |
| He | 7.3 | 0.5 | 7.8 | B | By-prod. of natural gas |
| Cd | 7.3 | 0.4 | 7.7 | B | By-prod. [Zn] |
| Y | 6.8 | 2.3 | 9.1 | B | By-prod. [HREEs] |
| Bi | 6.8 | 1.5 | 8.3 | B | By-prod. [Pb] |
| Pr | 6.7 | 2.5 | 9.2 | B | By-prod. [LREEs] |
| Ne | < 6.7 | 2.5 | B | By-prod. [Ar] | |
| Au | 6.4 | 4.7 | 11.1 | M | |
| Sm | 6.4 | 2.2 | 8.6 | B | By-prod. [LREEs] |
| Se | 6.4 | 2.1 | 8.5 | B | By-prod. [Cu] |
| Gd | 6.3 | 2.3 | 8.6 | B | By prod. [HREEs] |
| Hg | 6.3 | 1.7 | 8.0 | M | |
| Dy | 6.0 | 3.4 | 9.4 | (M) | Co-prod. [Eu] |
| Ta | 6.0 | 2.7 | 8.7 | M |
000 times higher, but not all natural gas contains economic concentrations of helium.24 The largest producer is the USA (74%). Smaller producer countries include Algeria (17%), Russia (5%) and Poland (2%).10 Production is also starting up in Qatar which is thought to have a large reserve of about 1/3 that of the USA, but since helium availability is linked to natural gas the eventual decline in global natural gas production will take helium production with it—regardless of demand and price.
:400 to 1:200 the scope for cadmium availability can be estimated as about 0.2–0.5% of the primary zinc output which indicates that there is limited scope for increased cadmium production (perhaps 2–3 times the current levels).10,13
:9320 ppm (concentration ratio) of argon production.24
2.5 Extremely low volume elements-bottom 26
This section discusses the 26 most scarcely produced elements, all < 1 kt yr−1. These elements are only relevant for energy conversion technologies if less than 1 milligram is needed for each Wp. An example of an energy conversion technology with such a low material intensity is the platinum electrocatalyst used low temperature fuel cells.| log(p) | log(P) | log(V) | M/B | Comment | |
|---|---|---|---|---|---|
| Be† | 5.8 | M | |||
| Er | < 5.8 | 2.5 | B | By-prod. [HREE] | |
| In | 5.7 | 2.9 | 8.6 | B | By-prod. [Zn] |
| Te | 5.7 | 2.5 | 8.2 | B | By-prod. [Cu] |
| Yb | < 5.7 | 2.7 | B | By-prod. [HREE] | |
| Eu | 5.6 | 3.8 | 9.4 | (M) | Co-prod. [Dy] |
| Kr | < 5.6 | 2.6 | B | By-prod. [Ar] | |
| Ho | < 5.4 | 3.5 | B | By-prod. [HREE] | |
| Tb | 5.3 | 3.7 | 9.0 | B | By-prod. [HREE] |
| Pd | 5.3 | 4.3 | 9.6 | B | By-prod. [Ni, Pt] |
| Pt | 5.3 | 4.7 | 10.0 | M | |
| Ge | 5.1 | 3.2 | 8.3 | B | By-prod. [Zn] |
| Ga | 5.1 | 2.9 | 7.9 | B | By-prod. [Al] |
| Tm | < 5.1 | 4.0 | B | By-prod. [HREE] | |
| Lu | < 5.0 | 4.0 | B | By-prod. [HREE] | |
| Hf | 4.9 | 2.8 | 7.7 | B | By-prod. [Zr] |
| Re | 4.7 | 3.5 | 8.2 | B | By-prod. [Mo,(Cu)] |
| Xe | 4.6 | 3.4 | 8.0 | B | By-prod. [Ar] |
| Rh | 4.4 | 4.7 | 9.1 | B | By-prod. [Pt] |
| Ru | 4.4 | 3.7 | 8.1 | B | By-prod. [Pt] |
| Ir | 4.0 | 4.5 | 8.5 | B | By-prod. [Pt] |
| Tl | < 4 | B | By-prod. [Cu,Zn] | ||
| Cs | < 4 | (M) | Co-prod. [Li,Ta,Pb] | ||
| Os | < 3.7 | 4.5 | B | By-prod. [Pt] | |
| Rb | 3.6 | 4.6 | 8.2 | (M) | Co-prod. [Cs,Ta,Li] |
| Sc | 3.3 | 3.1 | B | By-prod. |
:9320 ppm).24
:Pt in the two ore types are roughly 0.83 and 0.42, respectively. Palladium supply is highly inelastic unless its price rises to levels similar to platinum, making it a co-product rather than a by-product.9,48,49
:Hf ratio of about 50, so production could in principle be expanded to about 2% of the zirconium production (potential log(p) = 7), but separating hafnium from zirconium is very difficult and expensive.51
:Pt ratio of ∼0.19, while it is ∼0.05 for the latter. Rhodium has nearly no supply elasticity.9,49
Rubidium is produced from Lepidolite ore. The Tanco mine is also a major supplier of rubidium.10,54
2.6 Correlation between crustal abundance and production
In order to quantitatively estimate the correlation between production and crustal abundance of the elements, one is plotted as a function of the other in Fig. 3. In general, estimates of crustal abundance have an order of magnitude higher uncertainty than estimates for annual production. The estimates for crustal abundance used in the plot are calculated as the average of references56–58 and the production data used in the plot is the same (and carry the same assumptions) as those plotted in Fig. 1. The plot also shows the concentration range for typical platinum and gold ores. Since these ores represent the lowest-grade ores of any current main product, any of the 35 elements with a crustal concentration below this level can be extracted at prices below those of platinum or gold only if it is a by-product of some other element (leading to inelastic supply), or if natural ores exist in economic quantities in which the element is naturally concentrated many-fold.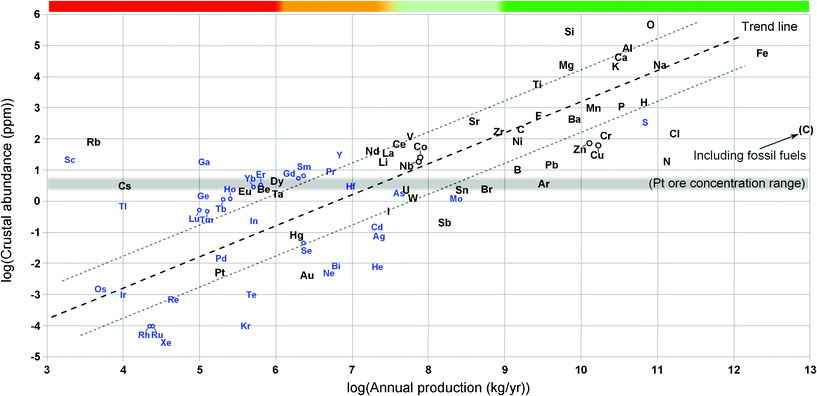 | ||
| Fig. 3 Estimated crustal abundance plotted as a function of global primary production in 2010. Elements which are main economic products of their respective ores are shown in black font while blue (smaller) font is used for the elements which are mostly by-products of other elements. The general trend, that production and abundance are proportional to each other, is characterised by a very high degree of scatter, ∼4 orders of magnitude which essentially precludes quantitative estimates of production (availability) from crustal abundance or vice versa. Elements far above the trend line are being “underproduced” with respect to the crustal abundance (but not necessarily with respect to technical availability) and, conversely, elements far below the trend line are being “overproduced”. The horizontal grey line indicates the typical ore-grade for platinum and gold ores as a reference. Carbon appears twice in the plot (as production of natural graphite alone and as graphite plus the carbon content of all fossil fuel production). The crustal abundance figure for carbon includes all carbon (i.e. also carbon in carbonate rocks). Note: The production figures for Ne, Kr, Cs, Sc, Ho, Er, Tm, Yb, Lu and Hf have the same assumptions as in Fig. 1 | ||
While the plot shows that crustal abundance and production are roughly proportional to each other it is also clear that there is a very high degree of scatter in the data (even considering only the economically important main-product elements). In fact, given a value for annual production, the uncertainty in the resulting estimate for crustal production (or vice versa) is several orders of magnitude (the RMS of the residuals is about 1.7).
Notwithstanding the scatter, Fig. 3 reveals some interesting features. One of these is the outliers. Nitrogen (ammonia) is clearly being “overproduced” with respect to its modest average concentration in the earth’s crust. Nitrogen has this in common with the other elements harvested from the atmosphere, i.e. neon, argon, krypton and xenon are also overproduced which reflects the utility of these products, but it also reflects the fact that the atmosphere is an “ore” where these elements are immensely concentrated with respect their average in the crust. Including only graphite, carbon is not an outlier, but if all the fossil fuels are included, carbon is being “overproduced” by more than three orders of magnitude (both data are included in the plot). As an example of an “underproduced” outlier, an element like gallium illustrates that medium-high crustal abundance is no guarantee for high production. Despite being more abundant than lead-and 400 times more expensive-gallium is being produced at a rate 32000 times lower than lead and has limited potential for increased production. Another, even more extreme example is rubidium which, despite being almost as abundant as carbon, is produced at more than 500000 times lower rates than graphite and more than 109 times lower rates than fossil fuel carbon.
Some elements in the “underproduced” group, represent opportunity for increased availability. The obvious candidates include the extremely abundant elements such as silicon, aluminium, calcium, magnesium and titanium, but also comparatively rare elements like vanadium, lanthanum, cerium and neodymium and even a very rare element like beryllium could probably have production ramped up if needed.
A final note on Fig. 3 is that many of the “minor” metals which are regarded as being highly depleted (e.g. silver, tin, antimony, lead and zinc) are found in the “overproduced” or highly “overproduced” region of the plot.7
3 Discussion
To put the production data into perspective it is useful to compare with data for materials usage (kg W−1) for various energy conversion technologies in order to assess possible constraints on scalability. Several examples (photovoltaics, fuel cells, solar fuels, storage batteries, passenger cars, wind turbines and biofuels) are provided below.The estimates given in these examples are designed to provide readers with an approximate level of materials intensity for various energy technologies, i.e. an order-of-magnitude analysis. The specific assumptions on efficiency, loading requirements, energy density, etc. will require a more detailed analysis to produce more accurate figures for specific technologies. Though improvements to technologies will reduce the materials intensities estimated in these examples, the conclusion remains unchanged that to produce just one TWavg of renewable power requires enormous amounts of materials. The list of examples given here is not meant to be exhaustive, but rather to illustrate the mechanics as to how a researcher can begin to assess the availability and accessibility of the elements needed to scale-up a renewable technology to the TW level.
3.1 Photovoltaics
Thin-film photovoltaics serve as a first example to illustrate scalability issues with chemical elements. To supply just 1 TWavg of primary energy (power) with photovoltaics, an area of about 70000 km2 (27000 mi2) must be covered with a 10% efficient solar collector in a decent location like southern Spain, Florida or Wyoming where the total insolation is about 1700 kWh m−2 yr. (The best locations in the USA like south-east California or Arizona get ∼2400 kWh m−2 yr¬1.) A standard performance ratio of 0.75 has been assumed. (This corresponds to a capacity factor of 19%, i.e. 1 TWavg ≈ 5.3 TWp.)59,60 This area is equivalent to almost 14% of the entire land mass of Spain. For a reasonably optimistic solar absorber thickness requirement of 1 μm,61–63 this 1 TWavg photovoltaic unit, therefore, needs 70000 m3 of absorber. Assuming an absorber density of 5 t m−3†† this translates to perhaps 350 kt of absorber material for each TWavg, so the absorber must be made from one of the top-30 elements or, equivalently, it must be produced at a rate higher than the current production of tin or molybdenum in order to install one TWavg yr−1 of thin-film photovoltaics. This also illustrates that even tin usage for soldering needs to be minimized in order for standard crystalline silicon photovoltaics to be scalable (although the near-term problem for this technology is replacing the silver used in screen printed contacts). It is estimated that current tin usage is 0.58 g(Sn) Wp−1 which gives 3.1 Mt tin TWavg−1 (11 years worth of tin production), but solder use in solar panels could probably be cut back if tin prices should increase.13,59,64,65
3.2 Fuel cells
Flow batteries and fuel cells constitute another area-specific example in that they are often characterized by a power density. Assuming a power density of 1 W cm−2, 1 TWp requires 100 km2 of fuel cell membrane. For a Solid Oxide Fuel Cell (SOFC) with a 45 μm thick electrolyte and electroactive region and a 300 μm anode current collector and support, the 1 TWp materials requirement is 17000 m3 of oxide-ion conducting material, which for a typical yttrium-stabilized zirconia (YSZ)-type electrolyte corresponds to approximately 63 kt of zirconium and 12 kt of yttrium (corresponding to 1 month of zirconium production and 21 months of yttrium production).66,67
If, on the other hand, we consider Polymer Electrolyte Membrane Fuel Cells (PEMFCs) with an optimistic precious metal loading of 0.3 mg cm−2, some 300 tonnes of platinum is required for 1 TWp of peak capacity equivalent to 20 months of platinum production (presently available commercial PEMFC technology uses about 800 tonnes of platinum TWp¬168–70), but of course utilization will be substantially below 100% in the real world (Pavg ≪ Pp) which increases the PGM requirement correspondingly.
3.3 Solar fuels: hydrogen by photoelectrochemical (PEC) water-splitting
Solar-water splitting has been a long-time goal for renewable H2 production.71 These devices are not yet commercialized, however techno-economic analyses of large-scale solar H2 production facilities have revealed that cost-effective H2 can be produced if appropriate materials can be developed.72 PEC planar arrays for H2 production essentially consist of PV-type solar absorbing materials coupled to fuel-cell like catalysts. Thus elemental abundance/production constraints found in those devices per TW will apply similarly to solar fuels, i.e. approximately 350 kt TWavg¬1 for the absorber (and double that for a tandem absorber system) and approximately 300 tonnes TWavg¬1 for each of the two catalysts involved in water-splitting: the H2 evolution catalyst and the water oxidation catalyst.3.4 Storage batteries
Electrochemical storage of energy in batteries is an example of a mass-specific problem. 24 h of 1 TW of power corresponds to 8.6 × 10¹⁶ J and since a lead–acid storage battery holds about 140 kJ kg−1 and a Li-ion battery holds up to 610 kJ kg−1 this corresponds to 6.1 × 10¹¹ kg of lead–acid (∼100 years worth of current lead production) or 1.4 × 10¹¹ kg of Li-ion batteries (representing ∼15 years worth of current graphite production for the anodes and ∼160 years of current lithium production).44,733.5 Electrified passenger cars
Since passenger cars are unused most of the time, the relevant parameter is not average power, but peak power. The global annual sales of cars is roughly 75 million units with perhaps 50 kW engine power each which gives a total annual engine power capacity of 3.8 TWp. The global passenger car fleet (770 million in 2007)74 has a stunning combined engine power of approximately 40 TWp. Replacing this power, currently provided by internal combustion engines, with present-day commercial PEM fuel cells would require on the order of 34 kt of platinum (180 years worth of current platinum production).As an example of a full hybrid car, the Toyota “Prius” has an electrical power of roughly 40 kW and a 53 kg battery (Nickel–metal–hydride type), so 770 million cars need 31 TWp worth of materials for wiring, magnets and batteries. For the permanent magnets for the electric motors, the requirement is perhaps 40 g dysprosium and 240 g neodymium for each vehicle, equivalent to 30 years and 10 years of current production, respectively. The requirement for the batteries is 4.1 × 10¹⁰ kg of NiMH batteries which would contain about 8–12 years of global nickel production and 28–40 years of LREE (“Mischmetal”) production.75,76
The raw materials requirement for a global fleet of full-electric cars is comparable to the 24 TWh battery described previously since just 90 MJ of battery capacity/car (like the Nissan “Leaf”) corresponds to 6.9 × 10¹⁶ J of electrochemical storage in 770 million cars-again-on the order of 130 years worth of current lithium production.
3.6 Wind turbines
Present-day wind turbines require a lot of materials for construction. It is estimated that 1 TWavg ∼ 4 TWp requires perhaps 3 × 10¹¹ kg of mild steel, 3 × 10¹⁰ kg of alloy steel, 8 × 10¹⁰ kg of stainless steel in addition to smaller, but significant, amounts of copper.13 Something like 2 months worth of steel production is enough to provide 1 TWavg of wind turbines. However, if the generator is a modern medium or high speed permanent magnet design, there is a further requirement of ∼750 kt of neodymium (40 years of production) and ∼50 kt of dysprosium (50 years of production) for magnets. Low speed/gearless permanent magnet generators require about 9 times more neodymium and dysprosium than high speed generators.133.7 Biofuels
The dominant biofuel technology in the world today is corn-derived ethanol.77 In the US, (largest producer of bio-ethanol) a corn field of 4047 m2 (1 acre) yields an average of about ∼3800 kg (150 bushels) of corn every year. 1 bushel of corn gives ∼11 l of ethanol using current technology, so each acre yields ∼ 1650 l of ethanol with a total lower heating value (LHV) of ∼38 GJ.77–79 Thus, in order to produce 1 TWavg of corn-derived ethanol, using current technology, an area of 3.36 × 10⁶ km2 (830 million acres) corresponding to 35% of the total US land area would need to be reserved for this purpose. ‡‡ Furthermore, the (economic) optimum fertilizer use is comparatively high for corn production. According to the USDA statistics service the average use of N, P2O5 and K2O for corn growth in the US was 15.7 t km−2, 6.7 t km−2 and 8.8 t km−2 (140; 60; 79 lbs acre−1 respectively) so the annual fertilizer requirement to grow 1 TWavg works out to log(N TWavg−1) = 10.7 (42% of global nitrogen production), log(P TWavg¬1) = 10.3 (∼69% of global phosphorous production) and log(K TWavg−1) = 10.5 (∼120% of global potassium production).80An alternative source of biomass-derived fuel is to gassify biomass such as cellulose and run conventional Fischer–Tropsch (FT) synthesis on the resulting syngas to make hydrocarbons. In this case, one possible limitation could be the availability of the necessary catalysts such as ruthenium for promoting cobalt-based FT catalysis (see Table 5).
| Technology | Material | Intensity Wp kg−1 | TWp req. log(M/TWp) | Capacity factor | TWavg req. log(M/TWavg) | Years to reach 1 TWavg | Refs. |
|---|---|---|---|---|---|---|---|
| a log(p)∼12.5 for cement. b Silicon solar cells are made of highly purified silicon (≥ 99.9999%) but most of the annually produced silicon is the far less pure, “metallurgical grade”. c Assuming a 2.5 μm absorber thickness. d Assuming a 1 μm absorber thickness and an indium-free transparent-conducting oxide (TCO) front contact. e The capacity factor for fuel cells is strongly dependent on the type of application (e.g. automotive or combined heat and power). f Yttrium stabilized zirconia–based solid oxide fuel cells. g Assuming 800 t Pt Wp¬1. h Cobalt-based Fischer–Tropsch from syngas (CO-H2 mixture) results mainly in wax which may be cracked to make synthetic Diesel fuel. i Co-based FT synthesis is strongly promoted by small amounts of PGMs or rhenium in cobalt-based catalysts and since rhenium and ruthenium are cheaper than the other PGMs they have been considered here. j The nuclear reactor considered here is a modern generation III+ pressurized water reactor (such as the “EPR”) burning high enrichment (5% U-235) fuel. The stated uranium requirement is the natural uranium (0.7% U-235) required to make the fuel elements for starting up 1 TW of electrical output. Running the reactors requires a further ∼144 kt of natural uranium for each TW × yr of electricity output-i.e. operation of 1 TWavg requires log(p (U)) = 8.2 equivalent to roughly 3 times the current uranium production rate. | |||||||
| Wind Turbines | Steel/Fe | 12 | 10.9 | 0.25 | 11.5 | 0.14 | 13 |
| Wind (on-shore) | Cementa | 20 | 10.7 | 0.25 | 11.3 | 0.06 | 81 |
| Wind (PM-gen.) | Nd | 5.3 k | 8.3 | 0.25 | 8.9 | 45 | 13 |
| Wind (PM-gen.) | Dy | 80 k | 7.1 | 0.25 | 7.7 | 50 | 13 |
| Photovoltaics-c-Si | Glass | 13 | 10.9 | 0.19 | 11.6 | — | 13, 59 |
| Photovoltaics-c-Si | Polymers | 85 | 10.1 | 0.19 | 10.8 | — | 13, 59 |
| Photovoltaics-c-Si | Sib | 250 | 9.6 | 0.19 | 10.3 | 3 | 13, 64 |
| Photovoltaics-c-Si | Cu | 450 | 9.3 | 0.19 | 10.1 | 0.7 | 13 |
| Photovoltaics-CdTec | Te | 14 k | 7.9 | 0.2 | 8.6 | 700 | |
| Photovoltaics-CIGSd | In | 50 k | 7.3 | 0.2 | 8.0 | 200 | |
| Fuel Cells-SOFCef | Y | 83 k | 7.1 | — | — | (1.8) | 66, 67 |
| Fuel Cells-PEMFCeg | Pt | 1.25 M | 5.9 | — | — | (4) | 69 |
| Co-based FT | Coh | 12 k | 7.9 | 0.95 | 7.9 | 1 | 82, 83 |
| Ru/Rei | 590 k | 6.2 | 0.95 | 6.3 | 75/38 | 13, 83 | |
| Nuclear fissionj | Unat. | 2.3 k | 8.6 | 0.85 | 8.7 | 10 | 13, 84 |
4 Conclusion-material challenges
According to the International Energy Association,85 the production of iron and steel accounts for 21% of industrial energy consumption (∼6.4 TWavg25), while chemicals and petrochemical production (which importantly includes ammonia, polymers and chlorine) accounts for 29%.85 There are other industrial processes which consume large amounts of energy (and exergy). These include the production of cement, of aluminium and of other non-ferrous metals (mostly copper) and of paper.7,86 The point is that there are very significant energy costs (several TWavg) associated with providing the current flow of raw materials so it seems prudent to start building a sustainable energy infrastructure sooner rather than later. It requires significant energy in the present to build the infrastructure needed to supply energy in the future.As the examples in the previous section and in Table 5 serve to show, any given technology needs large amounts of materials to reach the necessary TW-scale. Based on the analysis presented herein, it is challenging for any single renewable energy technology to scale to the 10+ TW level, based solely on elemental availability and accessibility and not even including other technological challenges such as efficiency and cost. On the other hand there are big differences among the technologies as to which specific materials are needed, and therein lies some hope that complementary technologies can be found which, in combination, will allow sustainable energy inputs to society on the multi-TW scale. It is, however, clear that only the most available elements can be relied upon for these crucial technologies if they are to scale to the TW-level. Elemental availability cannot be judged by crustal abundance alone. A more detailed analysis of the nature of production is needed for estimating potential scalability in supply and today’s numbers for global production rates provide extremely relevant information that must be factored into the analysis.
References
- R. E. Smalley, MRS Bull., 2005, 30, 412–417 CrossRef.
- BP, Statistical Review of World Energy, Bp plc technical report, 2011 Search PubMed.
- N. S. Lewis and D. G. Nocera, Proc. Natl. Acad. Sci. U. S. A., 2006, 103, 15729–15735 CrossRef CAS.
- N. Armaroli and V. Balzani, Angew. Chem., Int. Ed., 2007, 46, 52–66 CrossRef CAS.
- M. A. Green, Progr. Photovolt.: Res. Appl., 2009, 17, 347–359 CrossRef.
- J. Lifton, Rare Metals in the Age of Technology, The Jack Lifton Report Technical Report, 2010, 2 Search PubMed.
- A. Valero and A. Valero, Resour., Conserv. Recycl., 2010, 54, 1074–1083 CrossRef.
- T. Kendall, Platinum 2005, Johnson Matthey plc Technical Report ISSN, 2005, 0268-7305 Search PubMed.
- J. Butler, Platinum 2011, Johnson Matthey plc Technical Report ISSN, 2011, 0268-7305 Search PubMed.
- USGS, Mineral Commodity Summaries 2011, U. S. Geological Survey (USGS) technical report, 2011 Search PubMed.
- T. J. Brown, T. Bide, A. S. Wlaters, N. Idoine, R. A. Shaw, H. S. D, L. P. A. J and K. R, World Mineral Production 2005-09, BGS technical report, 2011 Search PubMed.
- NRC -Minerals and Metals Sector, Candian Minerals Yearbook, Natural Resources Canada technical report Search PubMed.
- R. L. Moss, E. Tzimas, H. Kara, P. Willis and J. Kooroshy, Critical Metals in Strategic Energy Technologies, European Commission–Joint Research Centre technical report, 2011 Search PubMed.
- T. V. Bommaraju, B. Lüke, T. F. O’Brian and M. C. Blackburn, in Kirk- Othmer Encyclopedia of Chemical Technology, JohnWiley and Sons Inc., 2002, vol. 6, ch. Chlorine, pp. 130–211 Search PubMed.
- M. J. Kirschner, in Ullmann’s Encyclopedia of Industrial Chemistry, Wiley-VCH Verlag GmbH, 2011, ch. Oxygen, pp. 617–635 Search PubMed.
- IEA, Hydrogen Production and Distribution, International Energy Agency technical report, 2007 Search PubMed.
- ICSG, World Copper Factbook 2010, International Copper Study Group technical report, 2010 Search PubMed.
- CDA, Annual Data 2011–Copper Supply & Consumption, Copper De- velopment Association technical report, 2010 Search PubMed.
- ILZSG, Lead and Zinc Statistics, International Lead and Zinc Study Group technical report, 2010 Search PubMed.
- R. Kresse, U. Baudis, P. Jäger, H. H. Riechers, H. Wagner, J. Winkler and H. U. Wolf, in Ullmann’s Encyclopedia of Industrial Chemistry, Wiley- VCH Verlag GmbH, 2012, ch. Barium and Barium Compounds, pp. 621–640 Search PubMed.
- D. A. Kramer, in Kirk-Othmer Encyclopedia of Chemical Technology, John Wiley and Sons Inc., 2010, ch. Magnesium and Magnesium Alloys, pp. 1–55 Search PubMed.
- EC, Critical raw materials for the EU, European commission-enterprise and industry technical report, 2010 Search PubMed.
- H. Wouters and D. Bol, Material Scarcity, M2i technical report, 2010 Search PubMed.
- P. Hässinger, R. Glatthaar, W. Rhode, H. Kick, C. Benkmann, J. Weber, H. Wunschel, V. Stenke, E. Leicht and H. Stenger, in Ullmann’s Encyclopedia of Industrial Chemistry, Wiley-VCH Verlag GmbH, 2012, vol. 24, ch. Noble Gasses, pp. 391–448 Search PubMed.
- EIA, International Energy Outlook, U.S. Energy Information Adminis- tration technical report, 2011 Search PubMed.
- INSG, World Nickel Statistics, International Nickel Study Group technical report, 2010 Search PubMed.
- R. H. Nielsen, J. H. Schlewitz and H. Nielsen, in Kirk-Othmer Encyclo- pedia of Chemical Technology, John Wiley and Sons Inc., 2007, vol. 26, ch. Zirconium and Zirconium Compounds, pp. 621–664 Search PubMed.
- CDI, Cobalt Facts 2011, Cobalt Development Institute technical report, 2011 Search PubMed.
- IAEA, World Distribution of Uranium Deposites, International Atomic Energy Agency (IAEA) Technical Report, 2009, IAEA-TECDOC-1629 Search PubMed.
- G. P. Hatch, Critical Rare Earths: Global Supply & Demand Projections and the Leading Contenders for New Sources of Supply, Technology metal research, llc technical report, 2011 Search PubMed.
- J. Nessler, Giant Bayan Obo REE-Fe-Nb Ore Deposit of Inner Mongolia, China, 2007 Search PubMed.
- J. B. Hedrick, 2007 Minerals Yearbook–Rare Earths, U. S. Geological Survey (USGS) technical report, 2010 Search PubMed.
- M. Humphries, Rare Earth Elements: The Global Supply Chain, Con- gressional Research Service Technical Report, 2011, R41347 Search PubMed.
- DOE, Critical Materials Strategy, U.S. Department of Energy (DOE) technical report, 2010 Search PubMed.
- A. Leveque, J. L. Sabot and P. Maestro, in Kirk-Othmer Encyclopedia of Chemical Technology, John Wiley and Sons Inc., 2001, ch. Lanthanides, pp. 1–28 Search PubMed.
- OECD-NEA and IAEA, Uranium 2009: Resources, Production and Demand, OECD Publishing, 2010 Search PubMed.
- GFMS Ltd., World Silver Survey 2011, The Silver Institute technical report, 2011 Search PubMed.
- K. R. Long, B. S. Van Gosen, N. K. Foley and D. Cordier, The Principal Rare Earth Elements Deposites of the United States–A Summary of Domestic Deposites and a Global Perspective, U. S. Geological Survey (USGS) technical report, 2010 Search PubMed.
- DOE, Critical Materials Strategy, U.S. Department of Energy (DOE) technical report, 2011 Search PubMed.
- WGC, Gold Numbers and Facts, World Gold Council technical report, 2011 Search PubMed.
- Guilinger, Assessment of Critical. Thin Film Resources. Tellurium, NREL Technical Report, 1999, RAF-9-29609 Search PubMed.
- M. W. George, Selenium and Tellurium, U. S. Geological Survey (USGS) 2007 minerals yearbook, 2008 Search PubMed.
- M. A. Green, Progr. Photovolt.: Res. Appl., 2006, 14, 743–751 CrossRef CAS.
- B. A. Andersson, Prog. Photovoltaics, 2000, 8, 61–76 CAS.
- D. McNeil, Beryllium, MMTA/Roskill Mineral Services technical report. Search PubMed.
- G. Phipps, C. Mikolacczak and T. Guckes, Renewable Energy Focus, 2008, 56–59 CrossRef.
- M. Buchert, D. Schler and D. Bleher, Critical Metals For Future Sustainable Technologies And Their Recycling Potential, United Nations Environment Programme (UNEP) technical report, 2009 Search PubMed.
- R. G. Cawthorn, Platinum Met. Rev., 2010, 54, 205–215 CrossRef.
- R. J. Seymour and J. O’Farrelly, in Kirk-Othmer Encyclopedia of Chemical Technology, John Wiley and Sons Inc., 2001, ch. Platinum-Group Metals, pp. 1–33 Search PubMed.
- MMTA, Germanium, MMTA technical report. Search PubMed.
- S. Munnoch, Hafnium, MMTA/Avon Metals Ltd. technical report. Search PubMed.
- A. Lipmann and M. Husakiewicz, Rhenium 2009 and beyond, Lipmann Walton & Co. LTD technical report, 2009 Search PubMed.
- C. A. DiFrancesco, G. R. Smith, P. N. Gabby and D. E. Guberman, Thallium Statistics, U. S. Geological Survey (USGS) technical report, 2010 Search PubMed.
- Cabot, TANCO–Tantalum Mining Corporation of Canada Ltd., Cabot Corporation technical report, 2001 Search PubMed.
- S. Munnoch and T. Worstall, Scandium, MMTA/Avon Metals Ltd. technical report. Search PubMed.
- K. H. Wedepohl, Geochim. Cosmochim. Acta, 1995, 59, 1217–1232 CrossRef CAS.
- N. N. Greenwood and A. Earnshaw, in Chemistry of the elements, Elsevier, 2nd edn, 1997, ch. Appendix 4–Abundance of Elements in Crustal Rocks, p. 1294 Search PubMed.
- Handbook of Chemistry and Physics, ed.W. M. Haynes, CRC, 92nd edn, 2011, ch. 14–Geophysics, Astronomy and Acoustics, p. 18 Search PubMed.
- B. Lloyd and A. S. Forest, Energy Policy, 2010, 38, 7378–7394 CrossRef.
- Photovoltaic Geographical Information System (PVGIS), Geographical Assessment of Solar Resource and Performance of Photovoltaic Technology, 2012 Search PubMed (Accessed January 09, 2012).
- K. Zweibel, Science, 2010, 328, 699–701 CrossRef CAS.
- V. Fthenakis, Renewable Sustainable Energy Rev., 2009, 13, 2746–2750 CrossRef CAS.
- C. Wadia, A. P. Alivisatos and D. M. Kammen, Environ. Sci. Technol., 2009, 43, 2072–2077 CrossRef CAS.
- EPIA, Global Outlook For Photovoltaics Until 2015, European Photovoltaic Industry Association (EPIA) technical report, 2011 Search PubMed.
- ITRP, International Technology Roadmap for Photovoltaics (ITRP.net) Results 2010, ITRP/Crystalline Silicon PV Technology and Manufacturing Group technical report, 2011 Search PubMed.
- M. B. Mogensen and S. Linderoth, in Engineering challenges : energy, climate change & health, ed. C. B. Hansen, Technical University of Denmark, 2009, ch. Fuel cells and electrolysis for converting renewable energy, pp. 41–51 Search PubMed.
- M. B. Mogensen, Technical University of Denmark- Risø, Personal communication Search PubMed.
- I. E. L. Stephens, A. S. Bondarenko, U. Grønbjerg, J. Rossmeisl and I. Chorkendorff, Energ. Environ. Sci., 2012, 5, 6744–6762 RSC.
- H. A. Gasteiger, S. S. Kocha, B. Sompalli and F. T. Wagner, Appl. Catal., B, 2005, 56, 9–35 CrossRef CAS.
- Y. Wang, K. S. Chen, J. Mishler, S. C. Cho and X. C. Adroher, Appl. Energy, 2011, 88, 981–1007 CrossRef CAS.
- M. G. Walter, E. L. Warren, J. R. McKone, S. W. Boettcher, Q. Mi, E. A. Santori and N. S. Lewis, Chem. Rev., 2010, 110, 6446–6473 CrossRef CAS.
- B. D. James, G. N. Baum, J. Perez and K. N. Baum, Technoeconomic Analysis of Photoelectrochemical (PEC) Hydrogen Production, Directed Technologies Inc., Department of Energy contract GS-10F-009J technical report, 2009 Search PubMed.
- L. Gaines and R. Cuenca, Costs of Lithium-Ion Batteries for Vehicles, Argonne National Laboratory Technical Report ANL, 2000,(ESD-42) Search PubMed.
- IEA, World Energy Outlook, International Energy Agency technical report, 2009 Search PubMed.
- B. A. Andersson and I. Rade, Transp. Res., Part D: Transp. Environ., 2001, 6, 297–324 Search PubMed.
- G. Majeau-Bettez, T. R. Hawkins and A. H. Strømman, Energ. Environ. Sci., 2011, 45, 4548–4554 Search PubMed.
- C. Difiglio, Impact of U.S. Legislation on Global Biofuel Markets, U.S. Department of Energy (DOE, 2009 Search PubMed.
- USDA-NASS, 2011 Corn production, U.S Department of Agriculture–National Agricultural Statistics Service USDA-NASS, 2011 Search PubMed.
- NCGA, How Much Ethanol Can Come From Corn, National Corn Growers Association. Search PubMed.
- USDA-NASS, 2010 Agriculture Survey, U.S Department of Agriculture–National Agricultural Statistics Service USDA-NASS, 2012 Search PubMed.
- M. L. Berndt, Sustainable concrete for wind turbine foundations, Brookhaven National Laboratory–Energy Resources Division technical report, 2004 Search PubMed.
- G. Angerer, L. Erdmann, F. Marscheider-Weidemann, M. Scharp, A. Lüllmann, V. Handke and M. Marwede, Rohstoffe für Zukunftstechnologien, Fraunhofer-Institut für System-und Innovationsforchung ISI technical report, 2009 Search PubMed.
- F. Diehl and A. Y. Khodakov, Oil Gas Sci. Technol., 2009, 64, 11–24 Search PubMed.
- WNA, The Nuclear Fuel Cycle, World Nuclear Association technical report, 2011 Search PubMed.
- IEA, Energy Technology Perspecives, International Energy Agency technical report, 2010 Search PubMed.
- J. M. Allwood, M. F. Ashby, T. G. Gutowski and E. Worrell, Resour., Conserv. Recycl., 2011, 55, 362–381 Search PubMed.
Footnotes |
| † Electronic Supplementary Information (ESI) available. See DOI: 10.1039/c2ra20839c |
| ‡ In this context bismuth is regarded as stable since the half life of the main isotope, Bi-209, is very long ∼1.9 × 10¹⁹ yr. |
| § Inelastic supply means that an increase in demand only causes little increase in supply despite large increases in price. Conversely, elastic supply means that supply follows demand with very small changes in price. |
| ¶ Primary supply originates from mining ore. Total supply, which must match total demand, equals primary supply plus secondary supply (recycling) plus net de-stocking from producers and investors. |
| || Particularly the lanthanides, the minor metals such as selenium, gallium, indium, rhenium and tellurium and the minor Platinum-Group Metals (PGMs): ruthenium, rhodium and iridium, all exhibit high volatility. |
| ** Table 2 also contains thorium despite unknown and low present production. This is because thorium historically has been produced at rates similar to other elements in the table and probably could be produced at similar rates again. |
| †† Density of some conventional absorbers (t m−3): CdTe: 6.2, CIGS: 5.7, CZTS: 4.6, GaAs: 5.3 |
| ‡‡ Note: The land area requirement for 1 TWavg of bio-ethanol corresponds to more than 40 times the area needed for 1 TWavg of photovoltaic electricity. |
| This journal is © The Royal Society of Chemistry 2012 |