Ascertaining genuine SERS spectra of p-aminothiophenol
Xiaorui
Tian
,
Li
Chen
,
Hongxing
Xu
and
Mengtao
Sun
*
Beijing National Laboratory for Condensed Matter Physics, Institute of Physics, Chinese Academy of Sciences, P. O. Box 603-146, Beijing, 100190, People's Republic of China. E-mail: mtsun@aphy.iphy.ac.cn
First published on 26th July 2012
Abstract
By choosing the proper SERS substrate and using a low concentration of p-aminothiophenol (PATP) solution, we observed the genuine SERS spectra of PATP, in which the vibrational modes of 4,4′-dimercaptoazobenzene (DMAB) at 1140, 1390, 1432 cm−1 are not observed, and the SERS spectra is the same as the Raman spectra of PATP powder. We compare the SERS spectra of PATP in two different SERS substrates, and find that both the plasmon enhancement and time of radiation by laser play key roles in the surface catalyzed reaction.
Surface-enhanced Raman scattering (SERS) is widely used in chemistry, biology, physics, and material science, since it can enhance the inherently low Raman scattering cross sections of molecules, even at the level of single molecule.1–3 Two enhancement mechanisms are widely accepted. One is the electromagnetic (EM) mechanism,2–5 which is caused by the strong surface plasmon resonance in rough metal surfaces excited by the incident light. EM enhancement should be a nonselective amplification mechanism for Raman scattering by all molecules adsorbed on a particular surface. The other is the chemical enhancement, which can be considered similarly to a resonance Raman process between the ground electronic state of the molecule–metal complex and its new excited levels arising from charge transfer between the metallic surface and the adsorbed molecule, which results in some Raman peaks being selectively enhanced enormously.6–10
SERS of 4-aminothiophenol (PATP) adsorbed on different metal surfaces has been extensively studied experimentally.11–22 These selective enhancements of b2 modes at 1140, 1390, 1432 cm−1 were ascribed to the effect of chemical enhancement.11–16 However, it has recently been confirmed experimentally and theoretically that the above observed spectra should be the SERS spectrum of 4,4′-dimercaptoazobenzene (DMAB), which is dimerized (converted) from PATP by surface catalysis reaction,17–22 where the Raman peaks at 1390, 1432 cm−1 are the –N![[double bond, length as m-dash]](https://www.rsc.org/images/entities/char_e001.gif) N– stretching modes, assigned as ag16 and ag17, respectively.18 Now, a great challenge is proposed: what is the genuine SERS spectrum of PATP, is it similar to or different from DMAB, and how to observe it experimentally? It is expected that the genuine SERS spectrum of PATP can end the argument about chemical or EM enhancements for SERS of PATP.
N– stretching modes, assigned as ag16 and ag17, respectively.18 Now, a great challenge is proposed: what is the genuine SERS spectrum of PATP, is it similar to or different from DMAB, and how to observe it experimentally? It is expected that the genuine SERS spectrum of PATP can end the argument about chemical or EM enhancements for SERS of PATP.
Recently, the substrate-, wavelength-, and time-dependent plasmon-assisted surface catalysis reactions of 4-nitrobenzenethiol (4NBT) dimerizing to DMAB have been studied experimentally and theoretically.23–25 It was found when the experimental conditions were rationally designed, the genuine SERS spectra of 4NBT can be successfully observed. The systematic works on the novel application of surface plasmon on chemical reactions of DMAB produced from PATP and 4NBT have been reviewed.26 Inspired by the above experimental results that the chemical reaction can not occur with weak plasmon intensity, the genuine reactant species of 4NBT, instead of the DMAB produced from 4NBT by a surface catalyzed reaction, can be observed23–26 and we try to find a proper system for ascertaining the genuine SERS spectrum of PATP. It had been found in our earlier experiment that PATP was much easier to dimerize to DMAB than 4NBT through a surface catalyzed reaction, and maybe that is the reason why the observed SERS spectra of PATP adsorbed on Ag substrate before our work were the SERS spectra of DMAB, not PATP itself. The observation of the genuine SERS spectra of PATP becomes a challenge. It has even been questioned whether the monomer of PATP actually exists in SERS. Luckily, with the SERS substrate of Ag nanowire on an Ag film, we report, for the first time, the observation of the genuine SERS spectra of PATP, where the modes of DMAB at 1140, 1390, 1432 cm−1 are not observed, and the SERS spectra are the same as the Raman spectrum of PATP powder.
The substrates for SERS measurement were prepared by first evaporating 5 nm of Cr on glass, and then 120 nm of Ag under a high vacuum using the electron beam evaporator (Peva-600E). The surface roughness was evaluated with atomic force microscopy (AFM, model SPA400), see Fig. 1(a). The crystalline Ag nanowires were prepared by chemical synthesis.27 The Ag film was immersed in a PATP ethanol solution (10−7 M) for two hours, and then washed with ethanol for 10 min to guarantee that there was only one monolayer of PATP molecules adsorbed on the Ag film. Then the Ag nanowires were dropped on the Ag film. A typical SEM image (SEM, Hitachi S-4800) of the system of Ag nanowire on Ag film was given in Fig. 1(b). Single nanowire on a film as an efficient SERS-active platform has been reported experimentally and theoretically.28 There are two reasons for us to choose this system: one is the plasmon coupling induced electromagnetic enhancement in the gap between Ag nanowire and Ag film is relatively weaker than that in the hot spots of aggregative nanoparticles, due to the dispersion of plasmon along nanowire;29 and the other reason is the number of PATP molecule is easy to controlled by choosing PATP solutions with proper concentration, and there is only one monolayer of PATP molecule in the gap betweem Ag nanowire and Ag film, which increases the difficulty for PATP dimerizing to DMAB. It is difficult to control the number of molecule in aggregative metal nanostructures, and there is probably more than one layer of molecule in the gap, and more hot spots among nanoparticles.
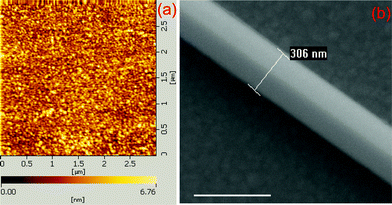 | ||
| Fig. 1 (a) AFM image of Ag film, and (b) a typical SEM image of Ag nanowire-Ag film system. The scale bar in (b) is 500 nm. | ||
SERS spectra were measured using a Renishaw inVia Raman system equipped with an integral microscope (LEICA, DMLM). The 632.8 nm radiation from the He–Ne laser was used as an excitation source. In our Raman experiment, the laser power used on the SERS sample was limited to 0.01 mW with a 100× objective. The data acquisition time used in the experiment was 10 s. For comparison, the normal Raman scattering (NRS) spectrum of PATP was also measured. The Raman spectrum of PATP adsorbed on Ag5 cluster were calculated using density functional theory,30 B3LYP functional,31 6-31G(d) basis set for C, H, S and H, and LANL2DZ basis set32 for Ag. All of the quantum chemical calculations were done with the Gaussian 09 suite.33
Comparing Fig. 2(a)–(c), we can see that the SERS spectrum (Fig. 2(b)) is the same as the NRS spectra of PATP powder (Fig. 2(a)), in which the vibrational modes of DMAB at 1140, 1390, 1432 cm−1 are not observed. This indicates that the SERS spectrum is from the PATP monomer, instead of DMAB dimerized from two PATP molecules. The experimental result in Fig. 2(b) is strongly supported by the simulated Raman spectrum of PATP adsorbed on Ag5 cluster (see Fig. 2(c)). Six vibrational modes can be seen from Fig. 3.
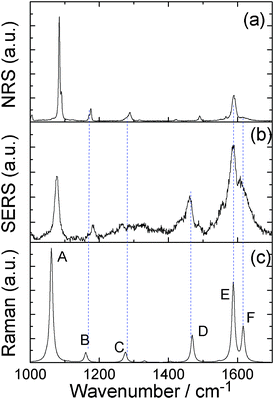 | ||
| Fig. 2 (a) NRS spectrum of PATP powder, (b) SERS spectrum of PATP, and (c) the simulated Raman spectrum of PATP adsorbed on Ag5 cluster. | ||
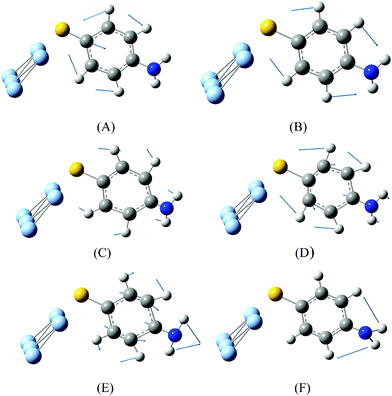 | ||
| Fig. 3 (a) Vibrational modes of PATP adsorbed on Ag5 cluster in Fig. 2(c). | ||
Fig. 4(a) and (b) give the SERS spectra of PATP at the very beginning and after 60 s with the laser continuously radiating on the sample, respectively. Compared with the spectrum in Fig. 4(a), three strong Raman peaks of DMAB at 1140, 1390, 1432 cm−1 can be clearly observed in Fig. 4(b). Furthermore, the NH2 vibration of Raman peak at 1610 cm−1 of PATP in Fig. 4(a) vanished in Fig. 4(b). This indicates that by increasing the radiation time, the dimerization reaction (PATP being converted to DMAB) also occurred.
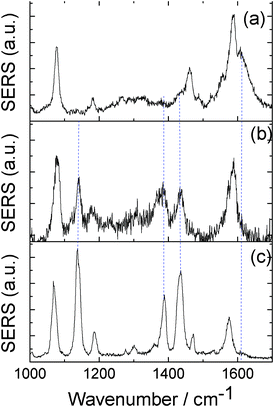 | ||
| Fig. 4 (a) and (b) SERS spectra of PATP measured at the very beginning and after 60 s of laser radiating in Ag nanowire on Ag film system, respectively, and (c) the SERS spectrum of DMAB in Ag aggregation system. | ||
To compare with the above Ag nanowire on Ag film system, we also measured the SERS spectra of PATP in an Ag nanoparticle aggregation system. In detail, the colloidal solution containing Ag nanoparticles was mixed with a solution of PATP with the same concentration (10−7 M) as used above for 2 h, and then 10 μL of the mixed solution was dropped on clean glass slides for the SERS measurement. The SERS active silver colloid was prepared by citrate reduction of AgNO3,34 and the average radius is about 40 nm.18Fig. 4(c) gave the typical SERS spectrum of PATP in the Ag aggregation system with the same experimental measurement conditions used in the above system. As shown in Fig. 4(c), three strong Raman peaks of DMAB at 1140, 1390, 1432 cm−1,18,19 are clearly observed, where the radiation time is just 10 s. Besides, it is almost impossible to observe the genuine SERS spectra of PATP in such a system. So, to some extent, we can say that by increasing the plasmon enhancement, the chemical reaction of dimerization can be faster. The mode assignments of DMAB in Fig. 4(c) can be seen from Ref. 18. It can be expected that the reaction time and reaction extent can be controlled by choosing a different SERS system, and by changing the laser power and solution concentration of molecule.
To qualitatively reveal the plasmon intensity from the coupling between the Ag nanowire and the Ag film, and from the coupling between Ag nanoparticles, we performed theoretical calculations with the finite element method,35 which was implemented in the COMSOL software (version 4.2). The radius of nanoparticle is 40 nm, and the distance between nanoparticles is 1 nm. The diameter of Ag nanowire is 300 nm (see Fig. 1(b)) and the thickness of Ag film is 120 nm. The distance between Ag nanowire and Ag film is also set 1 nm for comparison with the system of nanoparticle dimer. We choose these parameters by making them in close agreement with the experimental parameters. In the simulation, the perfectly matched layer (PML) boundary condition is used to reduce reflections from computing boundary. The incident light is plane wave, with a wavelength of 633 nm. The excitation polarization is parallel to the nanoparticle dimer axis in the nanoparticle aggregates system and perpendicular to the nanowire for the nanowire-film structure, respectively. The permittivity of Ag in our simulation is −18.3 + 0.5042i. It is found that |Elocal/E0| of the nanoparticle system is much larger than that of the Ag nanowire on Ag film system, which explains why plasmon enhanced dimerization can be observed in the Ag nanoparticle system in Fig. 4(c) but not in the Ag nanowire on Ag film system (Fig. 5).
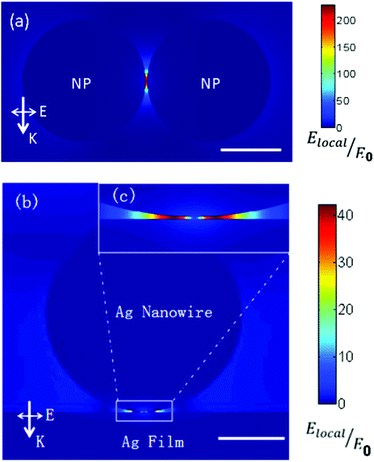 | ||
| Fig. 5 Electric field enhancement |Elocal/E0| of (a) Ag nanoparticle dimer and (b) electric field enhancement for the Ag nanowire-Ag film system. The scale bar in the lower right corner of (a) and (b) is 40 nm and 100 nm, respectively. The direction of k and E for incident light is also given. (c) The enlarged image for the part labeled by a rectangle in (b). | ||
In summary, for the first time, we have successfully observed the genuine SERS spectra of PATP, in which vibrational modes of DMAB at 1140, 1390, 1432 cm−1 are not observed, and the SERS spectrum is the same as the Raman spectrum of PATP powder. Radiation time by laser, plasmon enhancement are both the key factors which affect the surface catalyzed reaction. It can be expected that the reaction time and reaction extent can be controlled by choosing different SERS systems, and by changing the laser power and also the solution concentration of molecule.
References
- M. Fleischman, P. J. Hendra and A. J. McQuillan, Chem. Phys. Lett., 1974, 26, 163 CrossRef.
- D. L. Jeanmaire and R. P. VanDuyne, J. Electroanal. Chem., 1977, 84, 1 CrossRef CAS.
- H. X. Xu, E. J. Bjerneld, M. Käll and L. Borjesson, Phys. Rev. Lett., 1999, 83, 4357 CrossRef CAS.
- M. Moskovits, Rev. Mod. Phys., 1985, 57, 783 CrossRef CAS.
- K. Kneipp, H. Kneipp, I. Itzkan, R. R. Dasari and M. S. Feld, Chem. Rev., 1999, 99, 2957 CrossRef CAS.
- A. Otto, I. Mrozek, H. Grabhorn and W. Akemann, J. Phys.: Condens. Matter, 1992, 4, 1143 CrossRef CAS.
- M. T. Sun, S. S. Liu, M. D. Chen and H. X. Xu, J. Raman Spectrosc., 2009, 40, 137 CrossRef CAS.
- L. L. Zhao, L. Jensen and G. C. Schatz, J. Am. Chem. Soc., 2006, 128, 2911 CrossRef CAS.
- J. F. Arenas, I. Lopez-Tocon, J. L. Castro, S. P. Centeno, M. R. Lopez-Ramírez and J. C. Otero, J. Raman Spectrosc., 2005, 36, 515 CrossRef CAS.
- J. R. Lombardi and R. L. Birke, J. Phys. Chem. C, 2008, 112, 5605 CAS.
- M. Osawa, N. Matsuda, K. Yoshii and I. Uchida, J. Phys. Chem., 1994, 98, 12702 CrossRef CAS.
- Q. Zhou, X. W. Li, Q. Fan, X. X. Zhang and J. W. Zheng, Angew. Chem., Int. Ed., 2006, 45, 3970 CrossRef CAS.
- F. Toderas, M. Baia, L. Baia and S. Astilean, Nanotechnology, 2007, 18, 255702 CrossRef.
- D. R. Ward, N. J. Halas, J. K. Ciszek, J. M. Tour, Y. Wu, P. Nordlander and D. Natelson, Nano Lett., 2008, 8, 919 CrossRef CAS.
- T. Shegai, A. Vaskevich, I. Rubinstein and G. Haran, J. Am. Chem. Soc., 2009, 131, 14390 CrossRef CAS.
- J. A. Hutchison, S. P. Centeno, H. Odaka, H. Fukumura, J. Hofkens and H. Uji-i, Nano Lett., 2009, 9, 995 CrossRef CAS.
- D. Y. Wu, X. M. Liu, Y. F. Huang, B. Ren, X. Xu and Z. Q. Tian, J. Phys. Chem. C, 2009, 113, 18212 CAS.
- Y. Fang, Y. Li, H. X. Xu and M. T.Sun, Langmuir, 2010, 26, 7737 CrossRef CAS.
- Y. F. Huang, H. P. Zhu, G. K. Liu, D. Y. Wu, B. Ren and Z. Q. Tian, J. Am. Chem. Soc., 2010, 132, 9244 CrossRef CAS.
- M. T. Sun, Y. R. Fang, Z. Y. Zhang and H. X. Xu, arXiv, 1112.4218v1 Search PubMed.
- V. Canpean, M. Iosin and S. Astilean, Chem. Phys. Lett., 2010, 500, 277 CrossRef CAS.
- S. Zong, Z. Wang, J. Yang and Y. Cui, Anal. Chem., 2011, 83, 4178 CrossRef CAS.
- B. Dong, Y. R. Fang, X. W. Chen, H. X. Xu and M. T. Sun, Langmuir, 2011, 27, 10677 CrossRef CAS.
- B. Dong, Y. R. Fang, L.X. Xia, H. Xu and M. T. Sun, J. Raman Spectrosc., 2011, 42, 1205 CrossRef CAS.
- M. T. Sun, Z. L. Zhang, H. R. Zheng and H. X. Xu, Sci. Rep. Search PubMed Under review.
- M. T. Sun and H. X. Xu, Small, 2012 DOI:10.1002/smll.201200572.
- Y. Sun and Y. N. Xia, Adv. Mater., 2002, 14, 833 CrossRef CAS.
- I. Yoon, T. Kang, W. Choi, J. Kim, Y. Yoo, S.-W. Joo, Q. H. Park, H. Ihee and B. Kim, J. Am. Chem. Soc., 2009, 131, 758 CrossRef CAS.
- G. Schider, J. R. Krenn, A. Hohenau, H. Ditlbacher, A. Leitner, F. R. Aussenegg, W. L. Schaich, I. Puscasu, B. Monacelli and G. Boreman, Phys. Rev. B: Condens. Matter, 2003, 68, 155427 CrossRef.
- P. Hohenberg and W. Kohn, Phys. Rev., 1964, 136, B864 CrossRef.
- (a) A. D. Becke, Phys. Rev. A: At., Mol., Opt. Phys., 1988, 38, 3098 CrossRef CAS; (b) C. Lee, W. Yang and R. G. Parr, Phys. Rev. B, 1988, 37, 785 CrossRef CAS.
- P. J. Hay and W. R. Wadt, J. Chem. Phys., 1985, 82, 270 CrossRef CAS.
- M. J. Frisch, et al., Gaussian, Inc., Gaussian 09, Revision A.02, Gaussian, Inc., Wallingford CT, 2009.
- P. C. Lee and D. Meisel, J. Phys. Chem., 1982, 86, 3391 CrossRef CAS.
- I. Babuška, U. Banerjee and J. E. Osborn, International Journal of Computational Methods, 2004, 1, 67 CrossRef.
| This journal is © The Royal Society of Chemistry 2012 |
