DOI:
10.1039/C2RA20540H
(Paper)
RSC Adv., 2012,
2, 8681-8688
Uniform mesoporous 3D hematite superstructures: phase transition and their magnetic properties†
Received
24th March 2012
, Accepted 22nd July 2012
First published on 25th July 2012
Abstract
Uniform mesoporous superparamagnetic 3D hematite superstructures self-assembled using nanoparticles as building blocks have been successfully obtained in large quantities via an oleic acid-assisted one-pot solvothermal route. The as-obtained products were characterized by X-ray diffraction, X-ray photoelectron spectroscopy, Raman spectroscopy, scanning electron microscopy, transmission electron microscopy, Fourier transform infrared spectroscopy and N2 absorption-desorption isotherm. Some factors influencing the phase and morphology of the products were systematically investigated. Reaction time plays an important role in phase transition of the products from magnetite (microspheres), to hematite (mesoporous 3D superstructures), to maghemite (magnetic chains). Notably, ultrafine nanoparticles or cubic superstructures can also be obtained without oleic acid or instead by other additives. Oleic acid-assisted self-assembly and dissolution-recrystallization process is proposed based on experimental investigation and analysis. The magnetic study reveals a surprising phenomenon that the mesoporous 3D hematite superstructures exhibit a unique superparamagnetic behavior with a high saturation magnetization at room temperature, which is seldom reported thus far for the mesoporous 3D hematite superstructures. Uniform mesoporous superparamagnetic 3D hematite superstructures probably have potential application in magnetorheology, catalysis and water treatment.
Introduction
Over the past few years, the fabrication of three-dimensional (3D) hierarchical magnetic superstructures self-assembled by using nanoparticles (0D),1 nanorods (1D),2 nanoplates3 or nanosheets (2D)4,5 as have attracted a great deal of attention because of their unique properties and potential applications as compared with the fundamental building blocks.6,7 Generally, the simplest synthetic route to 3D magnetic superstructures is probably self-assembly, in which ordered aggregates are formed in a spontaneous process.8–10 It has been demonstrated that the magnetic properties, such as saturation magnetization (Ms) and coercive force, are closely related to the morphology, size and crystallinity of magnetic materials.11–14 However, the self-assembly of nanoscale magnetic particles into complex 3D architectures with controllable morphology and well-defined crystalline structure remains one of main challenges for material synthesis and device fabrication.
As an important n-type semiconductor with an optical band gap of 2.1 eV,15 hematite (α-Fe2O3) is the most thermodynamically stable phase among iron oxides and has potential applications in magnetic devices,16,17 photocatalysis,18 lithium ion batteries,1,19 gas sensors,20,21 pigments,22,23 owing to its nontoxicity, low processing cost, and high resistance to corrosion. Stimulated by the promising applications, considerable efforts have been devoted to the synthesis of hematite nanostructures with different morphologies. To date, well-defined nanostructures of hematite with different dimensionalities such as 0D (nanoparticles),24 1D (nanorods,25 nanowires,26 nanotubes,27 nanospindles,28 nanofibers29), 2D (nanoflakes,15 nanocages,30 nanorings,20 nanofilms31), and 3D (cubes,25 hollow spheres,16 dentritic crystals,32 urchin-like flowers33) superstructures have been successfully obtained by a series of solution-based routes and vapor-phase processes. Especially, 3D superstructures of hematite which allow exploration of the collective properties of nanoscale particles often produce more active sites or exhibit more interesting electrical,33 optical,28 catalytic,18 and magnetic properties25 than those of the 2D or 1D architectures. Therefore, it is meaningful to develop simple and feasible routes to the synthesis of 3D hematite superstructures with controllable morphology and well-defined crystalline structure. As known, bulk hematite has a first-order magnetic transition at TM = 263 K, which is called Morin transition. Below TM, the antiferromagnetic (AF) spins are oriented along the c-axis. Above TM, spins lie AF in the basal plane of the crystal with a ferromagnetism component.34 So it is easy to understand that kinds of 3D hematite superstructures generally show ferromagnetism component at room temperature. However, the magnetic properties of 3D hematite superstructures dependent on the particle size, structure and packing density are variable.35
In this work, we firstly report a facile solvothermal route to synthesize uniform mesoporous superparamagnetic 3D hematite superstructures on a large scale. 3D hematite superstructures are constructed of self-assemblies of thousands of nanoscale particles under the direction of oleic acid (OA). Importantly, there exists a great deal of slit among nanoscale particles so that 3D hematite superstructures are provided with mesoporous structures. Besides, magnetite microspheres and maghemite magnetic chains were also obtained as the reaction time was reduced or increased, indicating that the phase transition comes about. Notably, ultrafine nanoparticles and cubic superstructures can be obtained without OA or instead by other additives. On the basis of the experimental investigation and analysis, oleic acid-assisted self-assembly and dissolution-recrystallization process are proposed to understand the formation of mesoporous 3D hematite superstructures. The magnetic properties of the as-synthesized products are studied using a superconducting quantum interface device magnetometer.
Experimental
Sample preparation
All of the chemical reagents used in this experiment were of analytical grade and used without further purification. Iron(III) acetylacetonate (Fe(acac)3) was purchased from Aldrich. OA, triethylene glycol (TEG), dodecylamine (DAM) and ethanol were purchased from the Shanghai Chemical Reagent Company. The mesoporous superparamagnetic 3D hematite superstructures were synthesized by a facile solvothermal route. In a typical procedure, 0.5 mmol (0.1766 g) of Fe(acac)3 were dispensed into 15 mL of TEG and magnetically stirred for 15 min. Next, 5 mL of OA was added and constantly stirred for 15 min. The resulting mixture was then sealed into a Teflon-lined autoclave, followed by solvothermal treatment at 200 °C for 8 h in an electric oven. After the treatment, the reddish-brown products were collected, washed three times with ethanol, and then vacuum-dried at 50 °C for 8 h.
Characterization
The morphologies of the products were observed with field-emission scanning electron microscopy images (SEM) on a JEOL JSM-6300F SEM. Transmission electron microscopy (TEM) and high resolution transmission electron microscopy (HRTEM) were performed with a JEOL-2010 microscope operated at an accelerating voltage of 200 kV with a tungsten filament. The phase and composition of the products were determined by a Rigaku D/Max-γA rotating-anode X-ray diffractometer equipped with monochromatic high-intensity Cu-Kα radiation (λ = 1.54187 Å). X-Ray photoelectron spectroscopy (XPS) was performed with an XPS instrument (ESCALAB 250, Thermo) using Al Kα X-ray source (1486.6 eV). Raman spectroscopy was recorded on a confocal microscopy DXR SmartRaman Spectrometer (Thermo Scientfic) with an excitation wavelength of 532 nm. Fourier transform infrared (FTIR) spectroscopy was performed with a spectrophotometer (Nicolet IS10, Thermo-Fisher, USA). The thermal gravimetric (TG) and differential scanning calorimetry (DSC) curves were measured on a DTG-60H/DSC-60 thermal analyzer (Shimadzu, Japan) with a heating rate of 20 °C min−1 in flowing air. The BET surface area and pore size distribution were measured with a Micromeritics Coulter (USA) instrument. The magnetic properties of the products were measured on a superconducting quantum interference device (SQUID) magnetometer.
Results and discussion
Structure, composition and morphologies
The phase structure and composition of the as-obtained samples were characterized by XRD, XPS and Raman spectroscopy. Fig. 1 shows the XRD patterns of as-obtained products for different reaction times, indicating that the crystallization and phase structure of the as-obtained samples can be controlled by varying the reaction time. When the reaction time is as short as 0.75 h, the crystallization of the products is poor (Fig. 1a). As the reaction time was increased to 4 h, the products underwent an obvious crystallization process (Fig. 1b,c). Besides, the XRD patterns shown in Fig. 1b,c indicate that magnetite (Fe3O4) or maghemite (γ-Fe2O3) was obtained. Herein, caution should be taken when identifying magnetite or maghemite simply based on their ordinary XRD patterns, due to the same spinel structure and similar lattice parameter a (0.8350 nm for γ-Fe2O3 [JCPDS No. 24-0081, No. 04-0755] and 0.8378 nm for Fe3O4 [JCPDS No. 89-0691]).36 XPS and Raman analysis were carried out for 4 h for identification of the as-obtained samples. As shown in Fig. 2a and b, the binding energies obtained in the XPS were corrected for specimen charging by referencing the C1s line to 284.5 eV. The survey reveals that the products for 4 h are composed of Fe and O (Fig. 2a). In the high-resolution Fe2p spectrum (Fig. 2b), two distinct peaks were found at a binding energy of ∼710.6 eV for Fe2p3/2 and ∼724.1 eV for Fe2p1/2, which is quite consistent with the handbook values of magnetite.37 The Raman spectrum presented in Fig. S1† further confirm the magnetite phase of the as-obtained samples for 4 h. The characteristic band in the Raman spectrum is centered at 667 cm−1, which belongs to the typical A1g mode of magnetite.38,39 After 8 h of reaction time, well-defined XRD patterns were observed and all diffraction peaks were perfectly indexed (Fig. 1d), which is well in agreement with the standard data of the rhombohedral crystalline phase of α-Fe2O3 (JCPDS No. 89-0597).20 However, the XRD patterns of the as-obtained samples for 16 h indicate that the rhombohedral crystalline phase of hematite has transformed into magnetite or maghemite with the same spinel structure. XPS and Raman analyses were used again to identify the samples for 16 h, as shown in Fig. S2 and Fig. S1.† XPS analysis indicates that the products for 16 h are also composed of Fe and O (Fig. S2a). The difference with that for 4 h is that two distinct peaks at a binding energy of ∼710.4 eV for Fe2p3/2 and ∼724.1 eV for Fe2p1/2 with a satellite peak at ∼719.3 eV are observed (Fig. S2b),† which is the characteristic of Fe3+ in Fe2O3.20 Moreover, the Raman spectrum of the as-obtained products for 16 h shows the characteristic bands of maghemite around 350, 500, and 700 cm−1 (Fig. S1),† which can be easily distinguished from the magnetite one.38–40 On the basis of XPS and Raman analysis, the products for 16 h belong to maghemite. The phase transition from magnetite to hematite, to magnetite is seldom seen in the previous literature and may be ascribed to the solvothermal treatment with high temperature and pressure.41
 |
| | Fig. 1 XRD patterns of as-obtained products for different reaction times (a) 0.75 h, (b) 2 h, (c) 4 h, (d) 8 h, (e) 16 h. | |
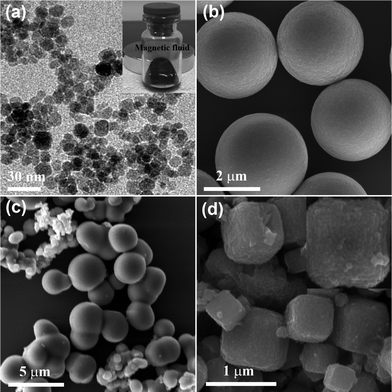
The morphologies and microstructures of the as-obtained samples were examined by SEM, TEM and HRTEM. Fig. 3a shows a typical SEM image of the products for 8 h. It can be clearly observed that the products are composed of densely packed spherical particles with a good size distribution of 2.1∼2.3 μm (seen in the inset of Fig. 3a). The SEM image with high-resolution shows that thousands of nanoparticles loosely assemble to construct 3D hematite superstructures (Fig. 3b). A typical TEM image demonstrates that 3D hematite superstructures have no large voids inside (Fig. 3c). Fig. 3d shows the surface microstructures of 3D hematite superstructures, which further verifies that the superstructures are indeed composed of a large quantity of nanoparticles. The HRTEM images (Fig. 3e,f) show the lattice images obtained at the edge of two different nanoparticles. It demonstrates clearly the lattice fringes with interplanar spacing of 2.67 and 3.71 Å (3.74 Å shown in Fig. 3f), corresponding to the (104) and (012) planes of the crystalline hematite, respectively.42 Analysis of the nanoparticles by HRTEM demonstrates that the single nanoparticle is well crystallized in the same direction and belongs to single crystalline.
Surface chemical structures and thermal stability
The surface chemical structures and thermal stability of the as-obtained samples for 8 h were characterized by FTIR spectroscopy and TG-DSC measurement. In the FTIR spectrum (Fig. 4a), the adsorption peak at 3442 cm−1 is due to the characteristic peak of –OH. The peaks at 2925, 2855, 1635, 1411 and 1060 cm−1 accord with the characteristic peaks of OA molecules.43 Nonetheless, the correlative literature demonstrates that TEG molecules have notable FTIR absorption at 3430, 2923, 2845, 1120∼1060 cm−1, which corresponds to O–H, C–H and C–O stretching vibrations of TEG molecules.44 Obviously, the FTIR absorption bands of TEG molecules are matched with those shown in Fig. 4a to a great extent. Other adsorption peaks at 568 and 479 cm−1 can be assigned to the vibrations of Fe–O.45 The FTIR spectroscopy analysis reveals that the surface of 3D hematite superstructures not only contains OA molecules, but also TEG molecules. As the TG curve of the as-obtained samples for 8 h shown in Fig. 4b, the weight loss from 30 to 400 °C corresponds to the solvent evaporation and decomposition of organic components. Besides, there are two exothermic peaks at about 265 and 546 °C on the DSC curve which may be ascribed to the heat release from the decomposition of organic components and the further crystallization process of hematite without any weight loss, respectively.46
 |
| | Fig. 4 (a) FTIR spectrum, (b) TG-DSC curves of the as-obtained samples for 8 h. | |
Surface area and porosity
Fig. 5 shows a typical N2 adsorption/desorption isotherm and the pore size distribution of the as-obtained samples for 8 h. The special surface area is as high as 78.3 m2 g−1, which is much higher than the value of hematite hierarchically hollow microspheres reported previously in literature (20 m2 g−1).5 The amount adsorbed rose linearly along with the increase of relative pressures, as shown in Fig. 5. This corresponds to the characteristics of type IV isotherm with a type H4 hysteresis loop associated with the loose assemblages of numerous nanoparticles forming slit-like pores, which was confirmed by the SEM image (the inset in Fig. 5) Additionally, the hysteresis loop appears at the middle pressure region (P/P0 = 0.3∼0.8), suggesting the presence of mesopores.47 The pore size distribution (the inset in Fig. 5) shows that the size of most of the pores is ∼2.2 nm, which further proves the loose structures constructed by self-assembly of nanoparticles. Thus, the as-obtained mesoporous 3D hematite superstructures with high surface area have potential application in the catalysis and water treatment.
 |
| | Fig. 5 N2 absorption–desorption isotherm, the corresponding pore size distribution and a colorful image of the as-obtained samples for 8 h (insets). | |
Formation mechanism
To understand the formation mechanism of the mesoporous 3D hematite superstructures, the effect of reaction parameters (time, amount of Fe(acac)3 and additives) on the resultant products was investigated in detail. Fig. 6 shows typical morphological evolvement for different reaction times of 0.75, 4, 12 and 16 h. At a short reaction time of 0.75 h, microspheres with a smooth surface and bright spots emerged as initial products (Fig. 6a). The size of the microspheres ranges from 3.3 to 4.2 μm, as shown in Fig. S3a.† According to the SEM image of the broken microspheres (see ESI, Fig. S3b), the reason for the bright spots could be ascribed to the unwashed solvents. After reaction of 4 h, the surface of the microspheres starts to get slightly rough (Fig. 6b). When the reaction time was increased to 12 h, the morphology of the products is similar to that of 8 h except that the mesoporous structures begin to disappear (Fig. 6c). Surprisingly, the magnetic chains self-assembled by two or several microspheres come about as the reaction time was extended to 16 h (Fig. 6d). Up to date, the reports related to the maghemite magnetic chains obtained without the applied magnetic field are seldom found. The transition of crystalline structures may be responsible for the formation of the magnetic chains, and an exact reason should further be investigated. These results indicate that the reaction time plays a key role in determining the size and morphology of the products.
 |
| | Fig. 6 SEM images of the as-obtained samples for different reaction times (a) 0.75 h, (b) 4 h, (c) 12 h, (d) 16 h. | |
Fig. 7 displays the SEM images of the samples prepared with different amount of Fe(acac)3. As shown in Fig. 7a, microspheres with a slightly rough surface were obtained when the amount of Fe(acac)3 was doubled. The size of the microspheres has an uniformity of ∼2 μm, but no obvious porous structures can be seen. As the amount of Fe(acac)3 was halved, monodisperse submicrospheres with a rough surface were obtained (Fig. 7b) and the particle size ranges from 450 to 650 nm according to the histogram of the particle size distribution (see ESI, Fig. S4a). With a quarter of the amount of Fe(acac)3, a larger number of aggregates and a few sphere-like structures were achieved (Fig. 7c). Hence one can see that the size and morphology of the products can be tuned by adjusting properly the amount of Fe(acac)3.
 |
| | Fig. 7 SEM images of the samples prepared with different amounts of Fe(acac)3 (a) 1 mmol, (b) 0.25 mmol, (c) 0.125 mmol. | |
In our typical procedure, OA was chosen as an additive to bedeck magnetic particles and reduce their surface energy. However, ultrafine magnetic nanoparticles were obtained without the existence of OA (Fig. 8a). The average size of the ultrafine magnetic nanoparticles is 9.1 nm based on the statistical results shown in Fig. S4b.† A standard deviation of 0.9 nm demonstrates the high monodispersity of the ultrafine magnetic nanoparticles. Interstingly, the magnetic nanoparticles dispersed in the solvent of ethanol instantaneously exhibit wonderful behavior of magnetic fluid when an external magnetic field was applied by a magnet (see inset in Fig. 8a). When 1 mL of OA was dropped into the reaction system, microspheres with slight smooth surface were easily achieved (Fig. 8b). Taking place of 5 mL of OA by 5 mL of DAM, a mass of aggregates consisting of irregular microspheres or particles come about (Fig. 8c). When 2.5 mL of OA and 2.5 mL of DAM were mixed as additives, cubic superstructures with a defective surface were received (Fig. 8d). The high-resolution SEM image of the samples (see the inset in Fig. 8d) indicates that the cubic superstructures could be assembled by larger numbers of nanoparticles in the form of oriented attachment.
 |
| | Fig. 8 SEM images of the samples prepared using different amounts of additives and other additives (a) 0 mL OA, (b) 1 mL OA, (c) 5 mL DAM, (d) 2.5 mL OA and 2.5 mL DAM (the inset in Fig. 8a exhibits a magnetic response of dispersion of the ultrafine nanoparticles). | |
Based on the above experimental results, we propose a possible formation mechanism for the mesoporous 3D hematite superstructures as shown schematically in Fig. 9. Initially, rapid stirring was used to accelerate the dissolution and coordination of Fe(acac)3 in TEG solution, and then under the solvothermal conditions, the iron alkoxide was decomposed to become the nuclei and quickly grew into the primary magnetite nanoparticles capped by OA.48 In the next growth stage, thousands of OA-capped magnetite nanoparticles self-assembled into magnetite microspheres. Generally, the driving force for magnetic nanoparticles assembly into the microspheres may originate from the inherent magnetic interaction or other physical or energetic means, such as Brownian motion,49 van de Waals forces,50 hydrogen bonds51 and crystal-face attraction.52 Moreover, it has been reputed that the subunits assembly can be driven through the binding affinities between organic ligands and inorganic nanoparticles or promoted by the interactions among surface-capped ligands.53 In this context, control experiments demonstrate that the microspheres can't be achieved in the absence of OA or being replaced by other additives (Fig. 6a, c and d), which indicates that OA plays a crucial role in directing the magnetic nanoparticles assembly into microspheres. According to the results of FTIR spectroscopy analysis (Fig. 4a), van de Waals force and/or hydrogen bonds among the capping OA molecules may be the most probable candidates for the driving force of self-assembly. With the increase of solvothernal time, magnetite microspheres with a smooth surface come about by a transient Ostwald ripening. However, the magnetite microspheres with a smooth surface are metastable. According to the Gibbs-Thompson equation and Fick's first law, the chemical potential of a particle increases with the decrease in particle size, meaning that the equilibrium concentration near a small particle is higher than that near a large one. The resulting concentration gradient would lead to the diffusion of molecular-scale species from smaller to larger particles.48 Generally, the inner particles in the microspheres can be considered as smaller particles because they have high curvature. Therefore, they are capable of diffusing to the outer area by the dissolution-recrystallization process.54 In our case, the dissolution-diffusion of the smaller particles would be partially inhibited because the OA molecules anchor to the smaller particles. However, those smaller particles protecting from dissolving underwent phase transition under the solvothermal environment with high temperature and pressure so that mesoporous 3D hematite superstructures rather than hollow structures formed after a long dissolution-recrystallization process.41
 |
| | Fig. 9 Schematic illustration of the formation mechanism of the mesoporous 3D hematite superstructures. | |
Magnetic properties
The magnetic properties of the mesoporous 3D superstructures (8 h), microspheres (4 h) and magnetic chains (16 h) were measured at room temperature from −15![[thin space (1/6-em)]](https://www.rsc.org/images/entities/char_2009.gif) 000 Oe to 15000 Oe, and their hysteresis loops are shown in Fig. 10. From the plots of M versus H (Fig. 10a), the Ms of the mesoporous 3D superstructures is 28.9 emu g−1, which is much higher than the reported value of bulk hematite.34 Interestingly, the remnant magnetization and coercivity (Hc) of the mesoporous 3D superstructures are also close to zero (seen in the inset of Fig. 10a), indicating the appearance of superparamagnetic state. The zero field cooled (ZFC) and field cooled (FC) magnetization study was also performed to prove the superparamagnetic state (see ESI, Fig. S5).† The ZFC curve shows an increase of the magnetization up to the maximum value at 158 K, which corresponds to the superparamagnetic blocking temperature (TB). Its appearance further proves the superparamagnetic behavior of the mesoporous 3D superstructures. at room temperature. Generally, hematite is weakly ferromagnetic at room temperature and undergoes phase transition at 263 K (the morin temperature, TM) to an antiferromagnetic state.34 It is known that the particles change from a multidomain to a single domain when the size of the magnetic particles decreases. If the single domain particles become small enough, the magnetic moment in the domain fluctuates in direction because of thermal agitation, which leads to superparamagnetism.55 According to previous reports, the hematite critical size for transition of ferromagnetic to superparamagnetic behavior is different, which is related to differences in particle shapes, the strain and defects in the particles induced by different synthetic routes.35, 56–58 For spherical hematite, the reported, biggest threshold diameter is about 41 nm, below which the particles become superparamagnetic (Hc≈0).57 Nonetheless, for one-dimensional nanostructures (hematite nanorods), the value is 15 ∼25 nm in breadth and 170∼330 nm in length.58 However, the average size of the as-obtained mesoporous 3D hematite superstructures is 2.2 μm, far higher than those reported above. The possible reason could be assigned to the unique structures influencing the magnetic properties of hematite. In fact, the as-obtained 3D hematite superstructures are composed of thousands of primary nanoparticles of about 30 nm (see ESI, Fig. S6).† Each primary particle can be visualized as a small enough single domain (superparamagnetic) particle so that the assembled 3D hematite superstructures also show superparamagnetic behavior. In contrast, the Ms of the microspheres and magnetic chains reach up to 41.1 and 62.7 emu g−1 (Fig. 10a), obvious remnant magnetization and coercivity also appear (Fig. 10b). This result reveals that both microspheres and magnetic chains display normal ferromagnetic behavior. The transition of magnetic behavior should be ascribed to the evolvement of the phase, structure and morphology of samples.9–11 Whether the microspheres or magnetic chains are composed of microstructures rather than the unique superstructures constructed by nanoparticles of about 30 nm, so the appearance of ferromagnetic state can be understood. More detailed investigation and explanation of their magnetic properties are in progress.
000 Oe to 15000 Oe, and their hysteresis loops are shown in Fig. 10. From the plots of M versus H (Fig. 10a), the Ms of the mesoporous 3D superstructures is 28.9 emu g−1, which is much higher than the reported value of bulk hematite.34 Interestingly, the remnant magnetization and coercivity (Hc) of the mesoporous 3D superstructures are also close to zero (seen in the inset of Fig. 10a), indicating the appearance of superparamagnetic state. The zero field cooled (ZFC) and field cooled (FC) magnetization study was also performed to prove the superparamagnetic state (see ESI, Fig. S5).† The ZFC curve shows an increase of the magnetization up to the maximum value at 158 K, which corresponds to the superparamagnetic blocking temperature (TB). Its appearance further proves the superparamagnetic behavior of the mesoporous 3D superstructures. at room temperature. Generally, hematite is weakly ferromagnetic at room temperature and undergoes phase transition at 263 K (the morin temperature, TM) to an antiferromagnetic state.34 It is known that the particles change from a multidomain to a single domain when the size of the magnetic particles decreases. If the single domain particles become small enough, the magnetic moment in the domain fluctuates in direction because of thermal agitation, which leads to superparamagnetism.55 According to previous reports, the hematite critical size for transition of ferromagnetic to superparamagnetic behavior is different, which is related to differences in particle shapes, the strain and defects in the particles induced by different synthetic routes.35, 56–58 For spherical hematite, the reported, biggest threshold diameter is about 41 nm, below which the particles become superparamagnetic (Hc≈0).57 Nonetheless, for one-dimensional nanostructures (hematite nanorods), the value is 15 ∼25 nm in breadth and 170∼330 nm in length.58 However, the average size of the as-obtained mesoporous 3D hematite superstructures is 2.2 μm, far higher than those reported above. The possible reason could be assigned to the unique structures influencing the magnetic properties of hematite. In fact, the as-obtained 3D hematite superstructures are composed of thousands of primary nanoparticles of about 30 nm (see ESI, Fig. S6).† Each primary particle can be visualized as a small enough single domain (superparamagnetic) particle so that the assembled 3D hematite superstructures also show superparamagnetic behavior. In contrast, the Ms of the microspheres and magnetic chains reach up to 41.1 and 62.7 emu g−1 (Fig. 10a), obvious remnant magnetization and coercivity also appear (Fig. 10b). This result reveals that both microspheres and magnetic chains display normal ferromagnetic behavior. The transition of magnetic behavior should be ascribed to the evolvement of the phase, structure and morphology of samples.9–11 Whether the microspheres or magnetic chains are composed of microstructures rather than the unique superstructures constructed by nanoparticles of about 30 nm, so the appearance of ferromagnetic state can be understood. More detailed investigation and explanation of their magnetic properties are in progress.
 |
| | Fig. 10 (a,b) Magnetic hysteresis loops of different structures and the corresponding hysteresis loops in the low field region (the inset in Fig. 10a shows the hysteresis loop of 3D superstructures). | |
Conclusion
In summary, uniform mesoporous superparamagnetic 3D hematite superstructures have been successfully obtained in large quantities via a facile oleic acid-assisted solvothermal route. The unique mesoporous superstructures are assembled loosely by thousands of nanoparticles of about 30 nm and are 2.1∼2.3 μm in diameter. By adjusting the reaction parameters, the morphology of the as-obtained products can be effectively tuned as microspheres, submicrospheres, magnetic chains, ultrafine nanoparticles and cubic superstructures. The time-dependent experiments demonstrate that the phase transition of the products from magnetite to hematite, to maghemite follows by morphological conversion from microspheres to mesoporous 3D superstructures, to magnetic chains. On the basis of time-dependent experiments, a possible formation mechanism is proposed, which involves five evolution stages. Especially, the formation and self-assembly of OA-capped magnetite nanoparticles, and final dissolution-recrystallization are the indispensable steps. The magnetic measurements demonstrate that the mesoporous 3D hematite superstructures display unique superparamagnetic behavior at room temperature, which is seldom reported thus far for the mesoporous 3D hematite superstructures. The superparamagnetic behavior with an Ms value of 28.9 emu g−1 is probably caused by the unique loose structures constructed by assembly units of 30 nm. Uniform mesoporous superparamagnetic 3D hematite superstructures probably have a potential application in magnetorheology, catalysis and water treatment.
Acknowledgements
This work was supported by the National Natural Science Foundation of China (No.20873153), the National Basic Research Program of China (2011CB302103), the State Key Laboratories of Transducer Technology (Skt0906).
References
- J. Chen, L. N. Xu, W. Y. Li and X. L. Gou, Adv. Mater., 2005, 17, 584 Search PubMed.
- G. C. Xi, C. Wang and X. Wang, Eur. J. Inorg. Chem., 2008, 425 CrossRef CAS.
- L. Liu, Y. Li, S. M. Yuan, M. Ge, M. M. Ren, C. S. Sun and Z. Zhou, J. Phys. Chem. C, 2010, 114, 251 CAS.
- J. S. Hu, L. S. Zhang, W. G. Song and L. J. Wan, Adv. Mater., 2008, 20, 2977 CrossRef CAS.
- J. S. Xu and Y. J. Zhu, CrystEngComm, 2011, 13, 5162 RSC.
- Y. S. Kang, S. Risbud, J. F. Rabolt and P. Stroeve, Chem. Mater., 1996, 8, 2209 CrossRef CAS.
- R. Ghosh, L. Pradhan, Y. P. Devi, S. S. Meena, R. Tewari, A. Kumar, S. Sharma, N. S. Gajbhiye, R. K. Vatsa, B. N. Pandey and R. S. Ningthoujam, J. Mater. Chem., 2011, 21, 13388 RSC.
- G. M. Whitesides and M. Boncheva, Proc. Natl. Acad. Sci. U. S. A., 2002, 99, 4769 CrossRef CAS.
- Y. Hou, H. Kondoh and T. Ohta, Chem. Mater., 2005, 17, 3994 CrossRef CAS.
- M. Mo, J. C. Yu, L. Z. Zhang and S. Li, Adv. Mater., 2005, 17, 756 CrossRef CAS.
- L. Suber, P. Imperatori, G. Ausanio, F. Fabbri and H. Hofmeister, J. Phys. Chem. B, 2005, 109, 7103 CrossRef CAS.
- H. Deng, X. Li, Q. Peng, X. Wang, J. Chen and Y. Li, Angew. Chem., Int. Ed., 2005, 44, 2782 CrossRef CAS.
- A. Yan, X. Liu, G. Qiu, N. Zhang, R. Shi, R. Yi, M. Tang and R. Che, Solid State Commun., 2007, 144, 315 CrossRef CAS.
- J. Bachmann, J. Jing, M. Knez, S. Barth, H. Shen, S. Mathur, U. Gösele and K. Nielsch, J. Am. Chem. Soc., 2007, 129, 9554 CrossRef CAS.
- M. V. Reddy, T. Yu, C. H. Sow, Z. X. Shen, C. T. Lim, G. V. S. Rao and B. V. R. Chowdari, Adv. Funct. Mater., 2007, 17, 2792 CrossRef CAS.
- X. L. Yu, C. B. Cao and X. Q. An, Chem. Mater., 2008, 20, 1936 CrossRef CAS.
- I. Cesar, A. Kay, J. G. Maritinez and M. Grätzel, J. Am. Chem. Soc., 2006, 128, 4582 CrossRef CAS.
- S. Y. Zeng, K. B. Tang, T. W. Li, Z. H. Liang, D. Wang, Y. K. Wang, Y. X. Qi and W. W. Zhou, J. Phys. Chem. C, 2008, 112, 4836 CAS.
- B. Wang, J. S. Chen, H. B. Wu, Z. Y. Wang and X. W. Lou, J. Am. Chem. Soc., 2011, 133, 17146 CrossRef CAS.
- X. L. Hu, J. C. Yu, J. M. Gong, Q. Li and G. S. Li, Adv. Mater., 2007, 19, 2324 CrossRef CAS.
- L. L. Wang, T. Fei, Z. Lou and T. Zhang, ACS Appl. Mater. Interfaces, 2011, 3, 4689 CAS.
- N. Pailhe, A. Wattiaux, M. Gaudon and A. Demourgues, J. Solid State Chem., 2008, 181, 2697 CrossRef CAS.
- H. Katsuki and S. Komarneni, J. Am. Chem. Soc., 2003, 86, 183 CAS.
- G. H. Qiu, H. Huang, H. Genuino, N. Opembe, L. Stafford, S. Dharmarathna and S. L. Suib, J. Phys. Chem. C, 2011, 115, 19626 CAS.
- J. B. Lian, X. C. Duan, J. M. Ma, P. Peng, T. Kim and W. J. Zheng, ACS Nano, 2009, 3, 3749 CrossRef CAS.
- U. Cvelbar, Z. Q. Chen, M. K. Sunkara and M. Mozetič, Small, 2008, 4, 1610 CrossRef CAS.
- C. T. Liu, J. Ma and H. Y. Chen, RSC Adv., 2012, 2, 1009 RSC.
- S. Mitra, S. Das, K. Manda and S. Chaudhuri, Nanotechnology, 2007, 18, 275608 CrossRef.
- Y. L. Chen, B. L. Zou, C. J. Wang, Y. J. Liu, X. Z. Fan, L. Zhu, Y. Wang, H. M. Ma and X. Q. Cao, CrystEngComm, 2011, 13, 2863 RSC.
- X. Wang, X. Y. Chen, X. C. Ma, H. G. Zheng, M. R. Ji and Z. Zhang, Chem. Phys. Lett., 2004, 384, 391 CrossRef CAS.
- B. Yan, J. G. Tao, C. Pang, Z. Zheng, Z. X. Shen, C. H. A. Huan and T. Yu, Langmuir, 2008, 24, 10569 CrossRef CAS.
- X. L. Hu, J. C. Yu and J. M. Gong, J. Phys. Chem. C, 2007, 111, 11180 CAS.
- L. C. Hsu, H. C. Yu, T. H. Chang and Y. Y. Li, ACS Appl. Mater. Interfaces, 2011, 3, 3084 CAS.
- A. S. Teia and P. Y. Koh, Prog. Cryst. Growth Charact. Mater., 2009, 55, 22 CrossRef.
- T. P. Raming, A. J. A. Winnubst, C. M. van Kats and A. P. Philipse, J. Colloid Interface Sci., 2002, 249, 346 CrossRef CAS.
- X. Z. Wang, Z. B. Zhao, J. Y. Qu, Z. Y. Wang and J. S. Qiu, Cryst. Growth Des., 2010, 10, 2863 CAS.
-
J. F. Moulder, W. F. Stickle, P. E. Sobol and K. D. BombkenHandbook of X-ray photoelectron spectroscopy, Eden Prairie: Physical Electronics Division, Perkin-Elmer Corp., 1992 Search PubMed.
- I. V. Chernyshova, M. F. Hochella Jr and A. S. Madden, Phys. Chem. Chem. Phys., 2007, 9, 1736 RSC.
- G. C. Xi, C. Wang and X. Wang, Eur. J. Inorg. Chem., 2008, 425 CrossRef CAS.
- T. J. Daou, G. Pourroy, S. Bégin-Colin, J. M. Grenèche, C. Ulhaq-Bouillet, P. Legaré, P. Bernhardt, C. Leuvrey and G. Rogez, Chem. Mater., 2006, 18, 4399 CrossRef CAS.
- R. Zboril, Chem. Mater., 2002, 14, 969 CrossRef CAS.
- W. Zhou, L. J. Lin, W. J. Wang, L. L. Zhang, Q. Wu, J. H. Li and L. Guo, J. Phys. Chem. C, 2011, 115, 7126 CAS.
- Q. Lan, C. Liu, F. Yang, S. Y. Liu, J. Xu and D. J. Sun, J. Colloid Interface Sci., 2007, 310, 260 CrossRef CAS.
- H. Deligöz, A. Baykal, E. E. Tanriverdi, Z. Durmus and M. S. Toprak, Mater. Res. Bull., 2012, 47, 537 CrossRef.
- G. Gao, P. Huang, Y. X. Zhang, K. Wang, W. Qin and D. X. Cui, CrystEngComm, 2011, 13, 1782 RSC.
- D. Mao, J. X. Yao, X. Y. Lai, M. Yang, J. Du and D. Wang, Small, 2011, 7, 578 CrossRef CAS.
- K. S. W. Sing, D. H. Everett, R. A. W. Haul, L. Moscow, R. A. Pierotti, J. Rouquérol and T. Siemieniewska, Pure Appl. Chem., 1985, 57, 603 CrossRef CAS.
- X. F. Qu, Q. Z. Yao, G. T. Zhou, S. Q. Fu and J. L. Huang, J. Phys. Chem. C, 2010, 114, 8734 CAS.
- G. T. Zhou, Q. Z. Yao, J. Ni and G. Jin, Am. Mineral., 2009, 94, 293 CrossRef CAS.
- M. W. Heaven, G. W. V. Cave, R. M. McKinlay, J. Antesberger, S. J. Dalgarno, P. K. Thallapally and J. L. Atwood, Angew. Chem., Int. Ed., 2006, 45, 6221 CrossRef CAS.
- H. Colfen and M. Antonietti, Angew. Chem., Int. Ed., 2005, 44, 5576 CrossRef.
- H. Colfen and S. Mann, Angew. Chem., Int. Ed., 2003, 42, 2350 CrossRef.
- R. Shenhar, T. B. Norsten and V. M. Rotello, Adv. Mater., 2005, 17, 657 CrossRef CAS.
- H. G. Yang and H. C. Zeng, J. Phys. Chem. B, 2004, 108, 3492 CrossRef CAS.
- N. Amin, S. Arajs and E. Matijevic, Phys. Status Solidi A, 1987, 104, K65 CrossRef CAS.
- F. Bødker, M. F. Hansen, C. B. Koch, K. Lefmann and S. Mørup, Phys. Rev. B: Condens. Matter, 2000, 61, 6826 CrossRef.
- T. P. Raaming, A. J. A. Winnubst, C. M. van Kats and A. P. Phulipse, J. Colloid Interface Sci., 2002, 249, 346 CrossRef.
- B. Tang, G. L. Wang, L. H. Zhuo, J. C. Ge and L. J. Cui, Inorg. Chem., 2006, 45, 5196 CrossRef CAS.
|
| This journal is © The Royal Society of Chemistry 2012 |
Click here to see how this site uses Cookies. View our privacy policy here. 
