DOI:
10.1039/C2RA01227H
(Paper)
RSC Adv., 2012,
2, 3430-3436
Synthesis of dinickel phosphide (Ni2P) for fast lithium-ion transportation: a new class of nanowires with exceptionally improved electrochemical performance as a negative electrode
Received
2nd December 2011
, Accepted 20th January 2012
First published on 29th February 2012
Abstract
Single-crystalline dinickel phosphide (Ni2P) nanowires with a uniform diameter of about 8 nm and lengths of 100–200 nm were synthesized from the thermal decomposition of continuously delivered Ni-TOP complexes using a syringe pump. These Ni2P nanowires deliver specific reversible capacities of 434 mA h g−1 at 0.1 C, 326 mA h g−1 at 0.5 C after 50 cycles, and also exhibit good rate performance. The improved electrochemical performance is attributed to the small size and stable cylindrical structure, which result in a high interfacial contact area with the electrolyte, and relieve the strain or accommodate volume expansion/contraction of these Ni2P nanowires. Electrochemical impedance spectra confirms that these Ni2P nanowires possess enhanced electrical conductivity, which facilitates the lithium ion and electron transportation in the electrode.
1. Introduction
Rechargeable lithium-ion batteries have been the most utilized batteries in the portable electronic market for many years. Many investigations have been focused on seeking alternative anode materials to graphite.1–10 Recently, extensive efforts have been carried out to explore transition metal phosphides (MPx, M = Fe, Co, Ni, etc.) since these compounds are considered as promising anodes for lithium-ion batteries for their high capacities (500–1000 mA h g−1, compared with ∼372 mA h g−1 for conventional graphite) and low polarization,2,11–14 based on a novel conversion mechanism.15 MPx can be categorized into two lithiating mechanisms during lithium reactions, depending on the nature of the metal:16,17
| MPx ↔ LiyMPx (Li+ intercalation) |
However, the sluggish charge/discharge process results in low specific reversible capacity and coulombic efficiency, as well as disappointing rate performance. Current lithium-ion batteries suffer these problems mainly because of the kinetics limitation which is caused by large micrometre sized electrode materials.18,19 Therefore, the fabrication of nanomaterials has been applied to improve their electrochemical performance.20 In our previous works, dinickel phosphide (Ni2P) nanoparticles have been synthesized to enhance the electrochemical performance,21,22 whereas the nanoparticles may easily become disconnected as these particles expand and contract on charge–discharge, thus surface modification of the carbon shell/network is needed. It has been reported that controlling the dimensions of nanostructured materials to optimize the electrochemical performance is very important. Among the various nanostructures, considerable attention has been drawn towards one-dimensional (1-D) nanostructures such as nanowires and nanorods. Particularly, there is a growing interest in utilizing the 1-D nanomaterials as electrodes in lithium-ion batteries, especially nanowires due to their high surface area and superior electronic conductivity.6,23–25 One long dimension ensures fast electron transport between the wires, and two short dimensions ensure lithium-ion insertion/removal. It is suggested that sub-20 nm, even 10 nm is sufficiently small to achieve excellent performance.26
Ni2P is an attractive anode material for its low potential vs. Li/Li+ during the charge–discharge process in order to possess high energy density.21 It is realizable to synthesize nanoscaled Ni2P,27,28 especially Ni2P nanowires29 at low temperature. In this context, use of nanowire architectures of Ni2P as an anode will offer high interfacial contact area with the electrolyte and great accommodation of strain and volume change without any structural damage or fracture.23,25,30 Also, short lithium ion diffusion paths can be achieved by fabricating nanowire electrodes. Moreover, the 1-D nanowires are beneficial for achieving high-rate performance since they facilitate better lithium ion and electron transportation than the electrodes consisting of small particles in which the lithium ions and electrons have to move through these particles and are limited by the inter-particle contacts.
In this present work, Ni2P nanowires were synthesized via an organic-phase strategy by using nickel acetylacetonate (Ni(acac)2) as a metal precursor, trioctylphosphine (TOP) as a phosphorus source, tri-n-octylamine (TOA) as the solvent and oleic acid (OA) as the surfactant with the help of a syringe pump. The 1-D nanowire morphology has a great relationship with the reversible capacity and rate performance.
2. Experimental
The Ni2P nanowires were prepared by a facile organic-phase strategy similar to that reported in ref. 29. In a typical synthesis, a stock solution containing 1 mmol Ni(acac)2 (ca. 95%, Sinopharm Chemical Reagent Co.), 2.4 mmol OA (d = 0.85 g mL−1, Sinopharm Chemical Reagent Co.) and 10 mL TOA (ca. 90%, Aladdin Chemistry Co.) was obtained at 120 °C under magnetic stirring. Then, the stock solution was very slowly injected (∼0.1 mL min−1) using a syringe pump into a stirred mixture containing 5 mL TOA and 4 mmol TOP (ca. 97%, J&K Chemical Ltd.) at 300 °C for 2 h under argon gas. After cooling to room temperature, the black product was precipitated out by adding a mixture of hexane and ethanol, and separated by centrifugation. The precipitation was washed several times and dried in vacuum. For the synthesis of Ni2P nanoparticles, the procedure is the similar to the above, but by a one-pot strategy without the help of a syringe pump.
2.2 Materials characterization
The morphologies and microstructures of Ni2P were characterized using scanning electron microscopy (SEM, FEI Sirion-100), X-ray diffraction (XRD, Rigaku D/max 2550 PC, Cu-Kα radiation, λ = 1.5416 Å) and transmission electron microscopy (TEM, JEOL JEM-2010 and Tecnai G2 F20).
2.3 Electrochemical measurements
For electrochemical tests, the working electrodes were prepared by a slurry coating procedure. The slurry which consisted of 75 wt.% Ni2P nanowires or nanoparticles, 15 wt.% acetylene black and 10 wt.% polyvinylidene fluoride (PVDF) dissolved in N-methyl pyrrolidinone (NMP), was incorporated on nickel foam with a 12 mm diameter. After drying at 90 °C for 24 h in vacuum, the samples were pressed under a pressure of 20 MPa. Test cells (CR 2025) were assembled in an argon-filled glove box with metallic lithium foil as the counter electrodes, 1 M LiPF6 in ethylene carbonate (EC)–dimethyl carbonate (DMC) (1![[thin space (1/6-em)]](https://www.rsc.org/images/entities/char_2009.gif) :
:![[thin space (1/6-em)]](https://www.rsc.org/images/entities/char_2009.gif) 1 in volume) as the electrolyte, and a polypropylene (PP) micro-porous film (Cellgard 2300) as the separator. The galvanostatic charge–discharge tests were conducted on a LAND battery program-control test system at rates of 0.1–10 C (1 C = 542 mA g−1) in the voltage range of 0.02–3.0 V at room temperature (25 ± 1 °C). Cyclic voltammetry (CV) and electrochemical impedance spectroscopy (EIS) were performed on a CHI660C electrochemical workstation. CV measurements were recorded between 0 and 3.0 V (vs. Li/Li+) at a scan rate of 0.1 mV s−1.
1 in volume) as the electrolyte, and a polypropylene (PP) micro-porous film (Cellgard 2300) as the separator. The galvanostatic charge–discharge tests were conducted on a LAND battery program-control test system at rates of 0.1–10 C (1 C = 542 mA g−1) in the voltage range of 0.02–3.0 V at room temperature (25 ± 1 °C). Cyclic voltammetry (CV) and electrochemical impedance spectroscopy (EIS) were performed on a CHI660C electrochemical workstation. CV measurements were recorded between 0 and 3.0 V (vs. Li/Li+) at a scan rate of 0.1 mV s−1.
3. Results and discussion
Ni2P nanowires were synthesized by the solution-phase thermal decomposition of continuously delivered Ni-TOP complexes using a syringe pump in a hot surfactant solution. The syringe pump was employed to ensure the continuous and constant delivery of Ni-TOP complexes into hot surfactant solution, thus inducing thermal decomposition and 1-D nanowire growth.31Fig. 1 represents a schematic illustration of the experimental setup employed for the synthesis of uniformly sized nanowires using a syringe pump, which is considered as the key factor to control the 1-D Ni2P growth.
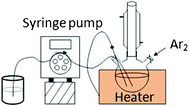 |
| | Fig. 1 Schematic illustration of the experimental setup for the synthesis of uniformly sized Ni2P nanowires. | |
Fig. 2a shows the XRD patterns of the as-synthesized Ni2P nanowires and nanoparticles. All the peaks exclusively match with hexagonal Ni2P (JCPDS 03-0953), no peaks of impurities can be observed, indicating that a high purity of Ni2P nanowires and nanoparticles has been obtained. Fig. 2b shows the TEM image of Ni2P nanowires. These nanowires have uniform morphology, and are about 8 nm in diameter and 100–200 nm in length. In addition, these nanowires are accompanied by very few nanoparticles, indicating a high yield of nanowires was obtained. A high resolution TEM (HRTEM) image of the Ni2P nanowires reveals the regularity of the lattice image corresponding to the single-crystalline structure, which is also confirmed by the fast Fourier transform (FFT) pattern (Fig. 2c). The space between the adjacent planes is 1.92 Å, corresponding to the (210) plane of Ni2P. For comparison, as shown in Fig. 2d, the Ni2P nanoparticles with a typical hollow structure can be observed, which also possess a single-crystalline structure (Fig. 2d, inset).
Fig. 3a shows that the specific discharge capacity of Ni2P nanowires after 50 cycles is 434 mA h g−1 at 0.1 C, and 326 mA h g−1 at 0.5 C. These Ni2P nanowires also exhibit good capacity retention. 74.5% and 65.7% discharge capacity for the 2nd cycle can be sustained at 0.1 and 0.5 C, respectively. For the Ni2P nanoparticles, however, the discharge capacity decreases markedly at 0.1 C, and already less than 400 mA h g−1 is observed after the 2nd cycle at 0.5 C. The cyclability of Ni2P nanowires is significantly improved, suggesting the sufficient contact between the nanowires and electrolyte to facilitate the Li-ion and electron transportation. In addition, the Ni2P nanowires exhibit an improved rate performance. Fig. 3b gives the coulombic efficiency of Ni2P nanowire and Ni2P nanoparticle electrodes at different rates. It obviously demonstrates that the Ni2P nanowire electrode has a higher initial coulombic efficiency than the Ni2P nanoparticle one (62.5 to 52.7%) at 0.1 C. In the subsequent cycles, the coulombic efficiency of the Ni2P nanowire is steady and gradually increasing to 100%, while the coulombic efficiency of the Ni2P nanoparticle is unstable and much lower than that of the Ni2P nanowire. At the 0.5 C rate, though the coulombic efficiency of the Ni2P nanowire fluctuates, it still remains stable and almost near 98% which accounts for the fast lithium ion and electron transportation due to the 1-D nanowire morphology. Fig. 3c compares the rate capabilities between the Ni2P nanowire and nanoparticle electrodes. The specific capacities of Ni2P nanowires at different charge–discharge rates are always higher than those of Ni2P nanoparticles. When tested at low rates (0.1–2 C), the two Ni2P electrodes show a similar decreasing tendency. On increasing the charge–discharge rate to 5 C, or even 7 C, the Ni2P nanowire electrode evidently exhibits a slight decrease, while the Ni2P nanoparticle electrode almost shows no capacity at a 7 C rate. At a high rate of 7 C, the discharge capacity of Ni2P nanowires is still as high as 164.7 mA h g−1. It should be noted that when the rate is decreased from 7 C to 0.2 C, the discharge capacity can be recovered to around 473.9 mA h g−1, indicating superior reversibility of the Ni2P nanowires. When the rate is increased to 5 C again, a stable discharge capacity during cycling and 89.3% of the initial capacity of the previous 5 C rate can be regained.
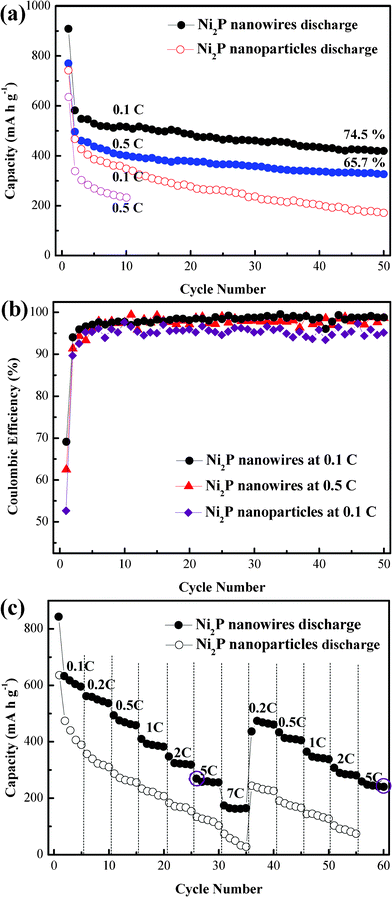 |
| | Fig. 3 (a) Specific discharge capacity with cycle number at 0.1 and 0.5 C rates. (b) Coulombic efficiency of Ni2P nanowire and nanoparticle electrodes. (c) Comparison of rate capabilities between Ni2P nanowires and nanoparticles. | |
To find out the mechanism of the improved electrochemical performance, we investigated the charge–discharge curves of Ni2P nanowire and nanoparticle electrodes, as shown in Fig. 4a and 4b. The initial discharge capacity of Ni2P nanowires is as high as 909 mA h g−1, which is much higher than that of Ni2P nanoparticles (742.4 mA h g−1). The extra capacity of Ni2P nanowires compared with their theoretical capacity resulted from the formation of a solid electrolyte interface (SEI) during the first discharging process.32 The striking difference in the two curves as marked by the dashed circle between the two Ni2P electrodes can be explained by the lithium ion insertion efficiency. There exists a well-pronounced voltage step near 0.8 V (Fig. 4a), which has been described traditionally as the dividing line between the insertion and the conversion process.19 However, the plateau between 1.7 and 1.0 V which is assigned to the insertion process is not clearly observed for the Ni2P nanoparticles (Fig. 4b). The SEM image of Ni2P nanoparticles in the inset of Fig. 4b shows these particles possess a hexangular structure, which can be described as the planar configuration mode. That is to say, not enough sites are provided for accepting lithium ion insertion. Contrarily, there are much higher specific surface areas for the cylindrical morphology due to its small size, thus resulting in a higher lithium ion insertion efficiency. In addition, after the initial cycle, an inconspicuous plateau can still be observed between 1.7 and 1.5 V for the Ni2P nanowire electrode, indicating the reversible and continuous insertion process, whereas no plateau exists for the Ni2P nanoparticle electrode. Lithium ion transport in these two configurations has been schematically illustrated in the respective plots. It can be clearly seen that the capacity per unit area of the cylindrical configuration is higher than that of the planar counterpart. The nanowire electrode–electrolyte configuration shows a great improvement in the reversible capacity. Moving to the third dimension with a nanowire based configuration has resulted in geometrical area gain and an associated electrode volume gain. This leads to shorter transport paths for lithium ion and electron diffusion within the electrodes.
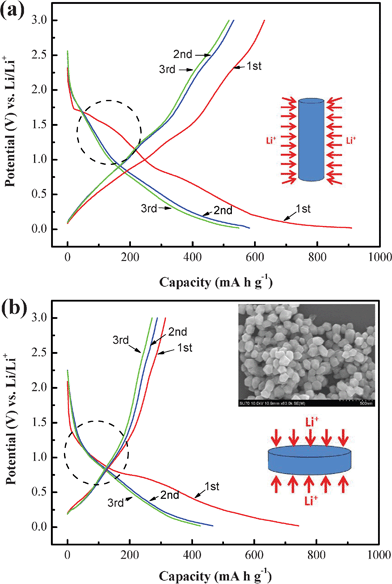 |
| | Fig. 4 Charge–discharge profiles of (a) Ni2P nanowire and (b) Ni2P nanoparticle electrodes. Insets: the schemes in (a) and (b) show the schematic illustration of the cylindrical morphology of nanowires and planar morphology of nanoparticles; the SEM image shows the morphology of Ni2P nanoparticles. | |
To confirm the high electrical conductivity of Ni2P nanowires, EIS measurements of the electrodes were conducted from 0.01 Hz to 100 kHz. Nyquist plots of the Ni2P electrodes after discharging to 0.02 V (vs. Li/Li+) at the 3rd cycle at 0.1 C are shown in Fig. 5a. The plots exhibit similar curves consisting of a depressed semicircle in high-medium frequency and a following 45° line in low frequency. At this fully discharged state, the Warburg effect is more crucial than the capacitive effect.33 As a result, it is supposed that the high-medium frequency semicircle corresponds to the charge-transfer resistance. The result reveals that the electrical conductivity of Ni2P nanowires is strikingly enhanced compared with that of Ni2P nanoparticles, which indicates that a large amount of lithium ions and electrons can transfer to the nanowires. Fig. 5b and 5c show the CV curves of the first and fourth cycles for the two Ni2P electrodes. The redox peaks are indexed to the discharge reaction Ni2P + 3Li+ + 3e− ↔ Li3P + 2Ni and the corresponding charge reaction.21,22 Compared with the Ni2P nanoparticles, the redox peaks of Ni2P nanowires are much more intensive, confirming again that large amounts of lithium ion react with Ni2P. Note that there are mainly three peaks during the anodic scan, which are suggested to be assigned to three reaction processes: transformation from Li3P + Ni to Ni12P5, then to Ni5P2, and lastly to Ni2P.22 In addition, as shown in Fig. 5b and 5c, the anodic peak of the nanowires, which can be indexed to the reversible reaction to Ni2P located at about 2.5 V, is quite obvious and much more intensive compared with that of the nanoparticles, especially during the fourth cycle, which indicates that a sufficient oxidation reaction occurs during the charge process. Furthermore, the XRD patterns of the Ni2P nanowire electrode after a full discharge/charge for the initial cycle at a C/60 rate are shown in Fig. 5d to clarify the reactions during the discharge/charge processes. After a full discharge, we note the occurrence of the Li3P phase and the disappearance of the Ni2P phase, which accounts for that there is no residual Ni2P observed. After a full charge, the Ni2P phase can be detected again, indicating the good reversibility of the Ni2P nanowire electrode. However, in our previous work, we only detected the intermediate Ni12P5 in the Ni2P nanoparticle electrode.21 Thus, all these results can certify the good reversibility of Ni2P nanowires, thus resulting in good cycling and rate performance.
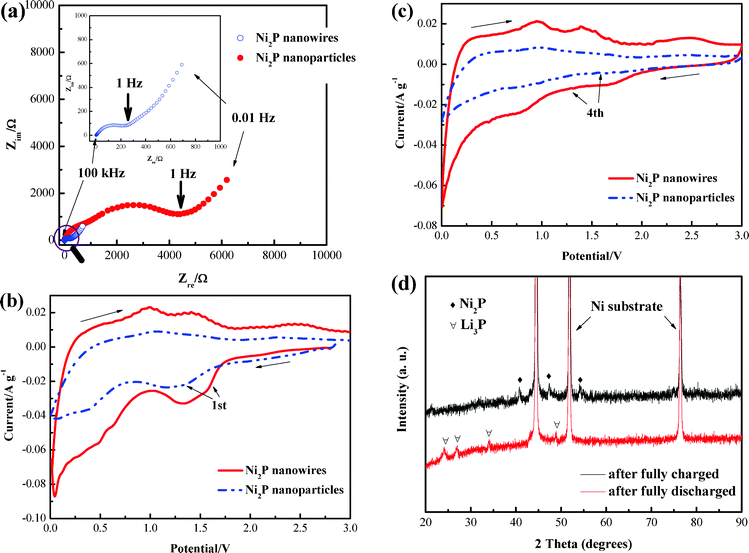 |
| | Fig. 5 (a) AC impedance of Ni2P nanowire and nanoparticle electrodes. Comparison of CV curves of Ni2P nanowire and nanoparticle electrodes for (b) the first, (c) the fourth cycle at a scan rate of 0.1 mV s−1 from 0 to 3.0 V. (d) XRD patterns of the Ni2P nanowire electrode after a full discharge/charge for the initial cycle. | |
To test the structural stability of Ni2P nanowires, TEM was performed on the nanowire electrode cycled for 50 times at 0.1 C. After fully discharging at the 50th cycle, the initial nanowires transform into an agglomerate of crystallized 5 nm-particles embedded in a crystallized lithiated matrix (Fig. 6a). After fully charging, as shown in Fig. 6b, the nanowire morphology can be retained, indicating the good reversibility of the Ni2P nanowire electrode during the charge–discharge process. In addition, the SAED pattern (Fig. 6b, inset) still reveals good crystalline Ni2P after cycling.
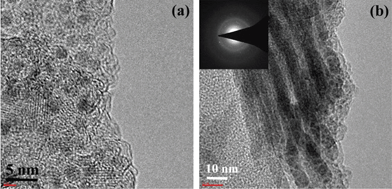 |
| | Fig. 6 TEM images of Ni2P nanowires after (a) the 50th discharge and (b) the 50th charge at 0.1 C. | |
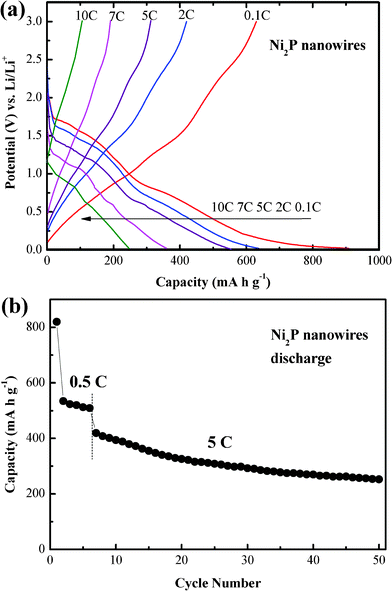
In view of the reversibility of the nanowire electrode, we also expect a good rate performance from Ni2P nanowires. Fig. 7a shows the first galvanostatic charge–discharge curves for the Ni2P nanowire electrode measured between 0.02 and 3.0 V at rates of 0.1–10 C. On increasing the charge–discharge rate, the separation of the two discharge plateaus gradually becomes blurred and the plateaus shift toward low voltage. When the rate is increased to 10 C, the discharge curve exhibits a sloping nature without the obvious plateaus. These phenomena can be explained by the ohmic drop and the increase of cell polarization at high current densities. It is not difficult to understand the results that the capacity loss observed on increasing the rate is due to kinetic limitations and may not be due to some structural changes.34 Except for the curves at 10 C, the others all exhibit similar shapes for the discharge curves even at 5 C. Fig. 7b shows the cyclability of the Ni2P nanowire electrode at the 5 C rate. After cycling for 5 times at 0.5 C, the specific reversible capacity of the Ni2P nanowires for the subsequent 45 cycles is still as high as 253 mA h g−1, revealing a good cycling performance at a relatively high charge–discharge rate. It confirms that the single-crystalline Ni2P nanowires can possess better cycling stability than the nanoparticles, attributed to the cylindrical nanowire structure which can enhance the contact area between the electrolyte and the active materials and also relieve the strain or accommodate volume expansion/contraction caused by repeated lithium ion intercalation/deintercalation into/from the Ni2P matrix.
4. Conclusions
Single-crystalline Ni2P nanowires about 8 nm in diameter and 100–200 nm in length were successfully fabricated using a syringe pump. Compared with the hexangular structured Ni2P nanoparticles, the nanowires deliver much higher reversible capacity and also exhibit good rate performance. The improved electrochemical performance is attributed to their small diameter and the stable cylindrical structure of these Ni2P nanowires, which would result in sufficient contact between the nanowires and electrolyte, and improve the efficiency of lithium ion transportation.
Acknowledgements
The assistance of Dr Ying Jiang and Dr Wei Huang for SEM/TEM analysis is grateful acknowledged.
References
- L. Taberna, S. Mitra, P. Poizot, P. Simon and J. M. Tarascon, Nat. Mater., 2006, 5, 567 CrossRef.
- S. Boyanov, J. Bernardi, F. Gillot, L. Dupont, M. Womes, J. M. Tarascon, L. Monconduit and M. L. Doublet, Chem. Mater., 2006, 18, 3531 CrossRef CAS.
- Y. S. He, P. F. Gao, J. Chen, X. W. Yang, X. Z. Liao, J. Yang and Z. F. Ma, RSC Adv., 2011, 1, 958 RSC.
- Y. Zhao, J. X. Li, Y. H. Ding and L. H. Guan, RSC Adv., 2011, 1, 852 RSC.
- J. S. Zhou, H. H. Song, L. L. Ma and X. H. Chen, RSC Adv., 2011, 1, 782 RSC.
- L. W. Ji, Z. Lin, M. Alcoutlabi and X. W. Zhang, Energy Environ. Sci., 2011, 4, 2682 CAS.
- X. H. Huang, J. P. Tu, Z. Y. Zeng, J. Y. Xiang and X. B. Zhao, J. Electrochem. Soc., 2008, 155, A438 CrossRef CAS.
- J. Y. Xiang, J. P. Tu, L. Zhang, Y. Zhou, X. L. Wang and S. J. Shi, Electrochim. Acta, 2010, 55, 4921 CrossRef CAS.
- Y. J. Mai, X. L. Wang, J. Y. Xiang, Y. Q. Qiao, D. Zhang, C. D. Gu and J. P. Tu, Electrochim. Acta, 2011, 56, 2306 CrossRef CAS.
- J. Y. Xiang, J. P. Tu, Y. Q. Qiao, X. L. Wang, J. Zhong and D. Zhang, J. Phys. Chem. C, 2011, 115, 2505 CAS.
- S. Boyanov, J. Bernardi, E. Bekaert, M. Menetrier, M. L. Doublet and L. Monconduit, Chem. Mater., 2009, 21, 298 CrossRef CAS.
- V. Pralong, D. C. S. Souza, K. T. Leung and L. F. Nazar, Electrochem. Commun., 2002, 4, 516 CrossRef CAS.
- J. Y. Xiang, X. L. Wang, J. Zhong, D. Zhang and J. P. Tu, J. Power Sources, 2011, 196, 379 CrossRef CAS.
- H. Pfeiffer, F. Tancret, M. P. Bichat, L. Monconduit, F. Favier and T. Brousse, Electrochem. Commun., 2004, 6, 263 CrossRef CAS.
- S. L. P. Poizot, S. Grugeon, L. Dupont and J.-M. Tarascon, Nature, 2000, 407, 496 CrossRef.
- O. Crosnier and L. F. Nazar, Electrochem. Solid-State Lett., 2004, 7, A187 CrossRef CAS.
- M. G. Kim and J. Cho, Adv. Funct. Mater., 2009, 19, 1497 CrossRef CAS.
- S. R. Gowda, A. L. M. Reddy, M. M. Shaijumon, X. B. Zhan, L. J. Ci and P. M. Ajayan, Nano Lett., 2011, 11, 101 CrossRef CAS.
- F. Gillot, S. Boyanov, L. Dupont, M. L. Doublet, A. Morcrette, L. Monconduit and J. M. Tarascon, Chem. Mater., 2005, 17, 6327 CrossRef CAS.
- P. G. Bruce, B. Scrosati and J. M. Tarascon, Angew. Chem., Int. Ed., 2008, 47, 2930 CrossRef CAS.
- Y. Lu, J. P. Tu, C. D. Gu, X. L. Wang and S. X. Mao, J. Mater. Chem., 2011, 21, 17988 RSC.
- Y. Lu, J. P. Tu, J. Y. Xiang, X. L. Wang, J. Zhang, Y. J. Mai and S. X. Mao, J. Phys. Chem. C, 2011, 115, 23760 CAS.
- T. Muraliganth, A. V. Murugan and A. Manthiram, Chem. Commun., 2009, 7360 RSC.
- J. Jiang, J. P. Liu, R. M. Ding, X. X. Ji, Y. Y. Hu, X. Li, A. Z. Hu, F. Wu, Z. H. Zhu and X. T. Huang, J. Phys. Chem. C, 2010, 114, 929 CAS.
- C. K. Chan, H. L. Peng, G. Liu, K. McIlwrath, X. F. Zhang, R. A. Huggins and Y. Cui, Nat. Nanotechnol., 2008, 3, 31 CrossRef CAS.
- G. Armstrong, A. R. Armstrong, P. G. Bruce, P. Reale and B. Scrosati, Adv. Mater., 2006, 18, 2597 CrossRef CAS.
- R. K. Chiang and R. T. Chiang, Inorg. Chem., 2007, 46, 369 CrossRef CAS.
- A. E. Henkes, Y. Vasquez and R. E. Schaak, J. Am. Chem. Soc., 2007, 129, 1896 CrossRef CAS.
- Y. Z. Chen, H. D. She, X. H. Luo, G. H. Yue and D. L. Peng, J. Cryst. Growth, 2009, 311, 1229 CrossRef CAS.
- A. S. Arico, P. Bruce, B. Scrosati, J. M. Tarascon and W. Van Schalkwijk, Nat. Mater., 2005, 4, 366 CrossRef CAS.
- J. Park, B. Koo, K. Y. Yoon, Y. Hwang, M. Kang, J. G. Park and T. Hyeon, J. Am. Chem. Soc., 2005, 127, 8433 CrossRef CAS.
- A. Debart, L. Dupont, P. Poizot, J. B. Leriche and J. M. Tarascon, J. Electrochem. Soc., 2001, 148, A1266 CrossRef CAS.
- M. D. Levi and D. Aurbach, J. Phys. Chem. B, 1997, 101, 4630 CrossRef CAS.
- Y. L. Ding, J. Xie, G. S. Cao, T. J. Zhu, H. M. Yu and X. B. Zhao, Adv. Funct. Mater., 2011, 21, 348 CrossRef CAS.
|
| This journal is © The Royal Society of Chemistry 2012 |
Click here to see how this site uses Cookies. View our privacy policy here. ![[thin space (1/6-em)]](https://www.rsc.org/images/entities/char_2009.gif) :
:![[thin space (1/6-em)]](https://www.rsc.org/images/entities/char_2009.gif) 1 in volume) as the electrolyte, and a polypropylene (PP) micro-porous film (Cellgard 2300) as the separator. The galvanostatic charge–discharge tests were conducted on a LAND battery program-control test system at rates of 0.1–10 C (1 C = 542 mA g−1) in the voltage range of 0.02–3.0 V at room temperature (25 ± 1 °C). Cyclic voltammetry (CV) and electrochemical impedance spectroscopy (EIS) were performed on a CHI660C electrochemical workstation. CV measurements were recorded between 0 and 3.0 V (vs. Li/Li+) at a scan rate of 0.1 mV s−1.
1 in volume) as the electrolyte, and a polypropylene (PP) micro-porous film (Cellgard 2300) as the separator. The galvanostatic charge–discharge tests were conducted on a LAND battery program-control test system at rates of 0.1–10 C (1 C = 542 mA g−1) in the voltage range of 0.02–3.0 V at room temperature (25 ± 1 °C). Cyclic voltammetry (CV) and electrochemical impedance spectroscopy (EIS) were performed on a CHI660C electrochemical workstation. CV measurements were recorded between 0 and 3.0 V (vs. Li/Li+) at a scan rate of 0.1 mV s−1.


