Experimental and theoretical study of the degradation of malonamide extractant molecules under ionizing radiation†
S.
Le Caër
*a,
G.
Vigneron
a,
D.
Guillaumont
b,
L.
Berthon
b,
N.
Zorz
b and
P.
Moisy
b
aInstitut Rayonnement Matière de Saclay, Service Interdisciplinaire sur les Systèmes Moléculaires et les Matériaux, UMR 3299 CNRS/CEA SIS2M, Laboratoire de Radiolyse, Bâtiment 546, F-91191, Gif-sur-Yvette Cedex, France
bCEA, Nuclear Energy Division, Radiochemistry & Processes Department, BP 17171, F-30207 Bagnols/Cèze, France
First published on 12th March 2012
Abstract
The behavior of three malonamides diluted in octane and submitted to ionizing radiation has been studied by means of in situ infrared spectroscopy, electrospray ionization mass spectrometry and quantum chemistry calculations. The major channel at low dose for a malonamide with ethyl groups on the nitrogen atoms and no substituent on the central carbon atom arises from the addition of an octyl group from the solvent. Adding alkyl chains on the nitrogen atoms and/or an alkyl chain on the central carbon atom weakens the central C–C bond which is then preferentially cleaved upon irradiation. The other bond cleavages (both C–N and C–H cleavages) are then detected when increasing the dose.
Introduction
Hydrometallurgy is the separation method used in nuclear fuel reprocessing. The PUREX process (plutonium uranium refining by extraction), based on the use of the tri n-butyl phosphate diluted in an aliphatic solvent is used in reprocessing plants to recover uranium and plutonium.1 To improve the management of the radioactive wastes, new solvent extraction processes are developed in order to isolate the minor actinides (e.g. Am, Cm) which are responsible for the long-term radiotoxicity of nuclear waste. The search for extractant molecules which specifically bind actinides and separate them from other cations (such as fission products) is a challenge in the context of nuclear waste separation and also from a fundamental point of view.2 Besides their ability to perform selective extractions, one of the key properties of extractant molecules is their stability toward radiolysis. Indeed, while developing a new liquid–liquid extraction process in the nuclear field, it is essential to consider the stability of potential extractant molecules as a major criteria of selection and to integrate systematic degradation studies in order to check the robustness of the extractant solution submitted to radiolysis, particularly in terms of efficiency and of selectivity.However, most studies in the field of nuclear fuel reprocessing are applied research and are therefore restricted to studying the impact of degradation on process performance in order to develop an adequate clean-up treatment. Moreover, the radiolytical degradation of extractant solutions is generally characterized in an ex situ configuration through γ-irradiation with high integrated dose leading to the formation of a multitude of radicals and ionized species which recombine into molecular products. Consequently, examination of such degraded extractant solutions is difficult from the analytical point of view. For instance, in the PUREX process, the exposure of the extractant solution to radiolysis gives rise to a mixture of over 200 secondary products, most of them in trace quantities.
So far, only few fundamental investigations have been reported which give further insight into the mechanism of degradation upon irradiation, such as pulsed radiolysis to study the primary process of degradation of TBP,3–8 phosphine oxide extractant,7 and amide extractant9 in alkane. However, in a recent review, we made the observation that the basic data that can help the understanding of the elementary mechanisms of radiation processes remain very incomplete.10 In order to gain information about the elementary mechanisms and to bring new knowledge about the radiation chemistry of the different compounds, including extractant molecules, we use infrared spectroscopy coupled to accelerated electrons. Although this spectroscopic technique is scarcely used in radiation chemistry, it is indeed a very powerful tool to identify species thanks to their vibrational signatures.
In the present work, we characterise in situ the effect of irradiation on extractant molecules of interest using the coupling between an infrared detector and a linear accelerator. We used accelerated electrons, as the LET (linear energy transfer)11 of these particles is similar to that of gamma radiation taking place in nuclear waste, inducing the same chemistry as in our experimental set-up, and the high dose rate (roughly 20 kGy min−1) enables us to obtain the required doses quickly. The aim of these experiments is to validate the choice of this experimental tool in order to study the impact of a low irradiation dose in situ. In situ experiments are combined with ex situ electrospray ionization mass spectrometry (ESI-MS) measurements performed after radiolysis and theoretical calculations. From theoretical calculations, we determine bond dissociation energies (BDE) in order to estimate the relative strengths of the bonds in the molecule and we simulate IR absorption spectra of initial and possible degradation products in order to help the interpretation of experimental IR spectra. Electrospray ionization mass spectrometry (ESI-MS) gives complementary information about degradation products.
We apply this approach to malonamide extractants developed for the DIAMEX12–20 process. The semi-developed formula of a malonamide is RR′NCOCH(R′′)CONRR′; R, R′ and R′′ being alkyl or oxyalkyl groups. The behaviour of these molecules after γ-irradiation has already been studied in the presence of nitric acid solution.13,21–28 Different degradation products are formed, including diamide, amide-acid, amide-lactone, monoamide and carboxylic acid.23,25–27 All these compounds exhibit strong and distinguishable infrared bands.29
Therefore, we chose to investigate the behaviour under irradiation with low integrated doses of a very simple malonamide, namely the N,N,N′,N′-tetraethylmalonamide, labelled as TEMA, and of malonamides having different groups on the central carbon: N,N′-dimethyl-N,N′-dibutyltetradecylmalonamide, labelled as DMDBTDMA, and N,N′-dimethyl-N,N′-dioctylhexylethoxymalonamide, labelled as DMDOHEMA. These molecules are represented in Scheme 1. Our goal is to identify the degradation pathways of these malonamides diluted in octane and to determine which bonds are preferentially cleaved upon irradiation and the effect of the nature and position of the alkyl group. The different cleavages are displayed in Scheme 2.
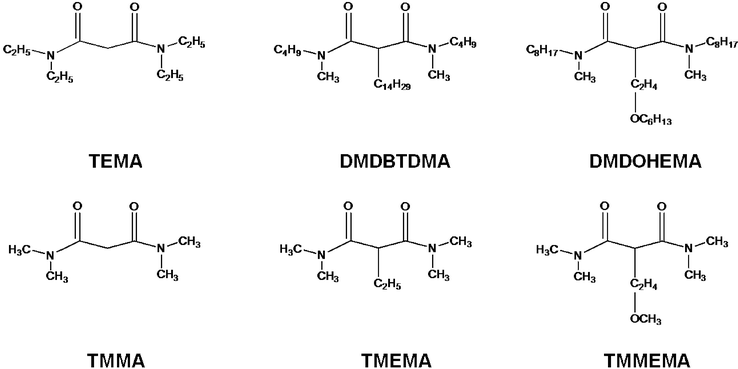 | ||
| Scheme 1 Malonamides investigated in the present study. Displayed on top are the molecules used in the experiments; displayed at the bottom are the analogues considered in the quantum chemistry calculations. | ||
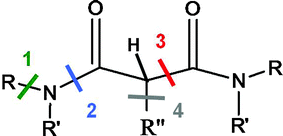 | ||
Scheme 2 Different bond cleavages envisioned: between a N atom and the adjacent carbon (1) between C![[double bond, length as m-dash]](https://www.rsc.org/images/entities/char_e001.gif) O and the adjacent N (2); between the central carbon atom and the C( O and the adjacent N (2); between the central carbon atom and the C(![[double bond, length as m-dash]](https://www.rsc.org/images/entities/char_e001.gif) O) atom (3); and between the central carbon atom and the C(alkyl) atom (4). An example of a C–H bond is also presented (see Table 1). O) atom (3); and between the central carbon atom and the C(alkyl) atom (4). An example of a C–H bond is also presented (see Table 1). | ||
Results and discussion
1. Results
1.1.1 Tetraethylmalonamide (TEMA). The infrared spectrum of TEMA was recorded in octane (0.1 mol dm−3) (Fig. 1). In the 900–1800 cm−1 spectral range, the main feature is centred at 1646 cm−1 with a small additional component at 1663 cm−1, corresponding to the C
![[double bond, length as m-dash]](https://www.rsc.org/images/entities/char_e001.gif) O stretching mode.29 These absorption wavenumbers rule out the presence of an enol form in TEMA. This is also consistent with a previous work indicating that the enol form was only reported for malonamide in aqueous solution.30 Previous conformational studies have shown that malonamides may adopt two stable conformers corresponding to two different relative orientations of the two carbonyl groups (denoted as A and B on Fig. 1). In the low-energy structure (A), the two carbonyl groups point in opposite directions.31
O stretching mode.29 These absorption wavenumbers rule out the presence of an enol form in TEMA. This is also consistent with a previous work indicating that the enol form was only reported for malonamide in aqueous solution.30 Previous conformational studies have shown that malonamides may adopt two stable conformers corresponding to two different relative orientations of the two carbonyl groups (denoted as A and B on Fig. 1). In the low-energy structure (A), the two carbonyl groups point in opposite directions.31
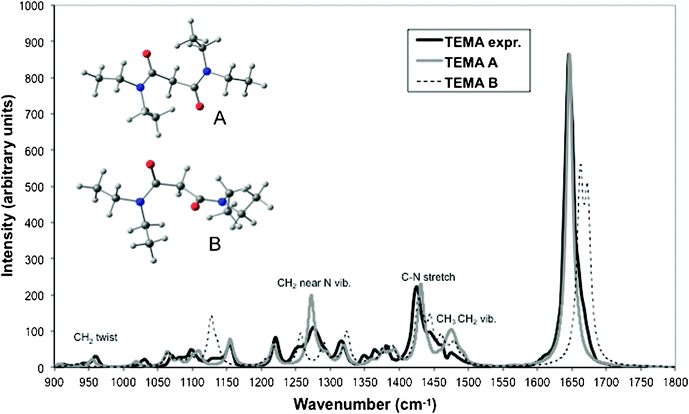 | ||
| Fig. 1 Calculated and experimental infrared spectra of TEMA measured in octane (black solid line) and calculated from DFT (B3LYP) for conformers A (the lowest in energy, grey solid line) and B (dashed line) in the 900–1800 cm−1 spectral range. Calculated spectra were simulated by broadening the calculated transitions as a sum of Lorentzian functions with bandwidths at half height of 11 cm−1. | ||
The simulated IR spectra corresponding to the two conformations of TEMA (A and B) are compared to the experimental spectra in Fig. 1. Anharmonicities can be calculated but are computationally demanding. In order to take anharmonic effects into account, calculated harmonic frequencies are usually scaled by a constant factor. In the present study, the frequencies are scaled by a factor of 0.984 in order to match the experimental and calculated C![[double bond, length as m-dash]](https://www.rsc.org/images/entities/char_e001.gif) O stretching frequencies for TEMA in its low-energy conformation A (1646 and 1673 cm−1 respectively). In what follows, all the calculated frequencies have been scaled by this value. The calculated spectrum for conformation A is in very good agreement with the measured spectrum. The positions of the bands relative to the most intense one corresponding to C
O stretching frequencies for TEMA in its low-energy conformation A (1646 and 1673 cm−1 respectively). In what follows, all the calculated frequencies have been scaled by this value. The calculated spectrum for conformation A is in very good agreement with the measured spectrum. The positions of the bands relative to the most intense one corresponding to C![[double bond, length as m-dash]](https://www.rsc.org/images/entities/char_e001.gif) O stretching are very well reproduced by the calculations with discrepancies of only a few wavenumbers. From the simulated spectra for both conformations, it is possible to interpret the experimental spectrum. The small additional component at 1663 cm−1 measured in the C
O stretching are very well reproduced by the calculations with discrepancies of only a few wavenumbers. From the simulated spectra for both conformations, it is possible to interpret the experimental spectrum. The small additional component at 1663 cm−1 measured in the C![[double bond, length as m-dash]](https://www.rsc.org/images/entities/char_e001.gif) O stretching vibration region can be attributed to the presence of the second conformation B whose C
O stretching vibration region can be attributed to the presence of the second conformation B whose C![[double bond, length as m-dash]](https://www.rsc.org/images/entities/char_e001.gif) O frequencies are calculated at 1662 cm−1 and 1673 cm−1. The contribution of conformation B to the spectrum can also be visible in other parts of the spectrum (near ∼1130, ∼1250 and ∼1450 cm−1). The calculated free enthalpy difference between A and B is 4 kJ mol−1 which corresponds roughly to a population ratio between the two conformations of 5 at 298 K. Qualitatively, this is consistent with the relative intensity of the experimental bands that can be attributed to each conformation.
O frequencies are calculated at 1662 cm−1 and 1673 cm−1. The contribution of conformation B to the spectrum can also be visible in other parts of the spectrum (near ∼1130, ∼1250 and ∼1450 cm−1). The calculated free enthalpy difference between A and B is 4 kJ mol−1 which corresponds roughly to a population ratio between the two conformations of 5 at 298 K. Qualitatively, this is consistent with the relative intensity of the experimental bands that can be attributed to each conformation.
Frequencies and IR intensities were calculated for fragmentation products corresponding to the reactions depicted on Scheme 2 for TEMA. Calculated values are shown in Fig. 2 (the main region of interest being centred around the C![[double bond, length as m-dash]](https://www.rsc.org/images/entities/char_e001.gif) O stretching band between 1590 and 1750 cm−1). Only the most stable conformation of each species is considered here. For the product of reaction 1, NH(C2H5)COCH2CON(C2H5)2 corresponding to the cleavage of a N–C(alkyl) bond, the calculated vibration frequencies with strong infrared intensity are 1695, 1637 and 1553 cm−1; the first two values correspond to C
O stretching band between 1590 and 1750 cm−1). Only the most stable conformation of each species is considered here. For the product of reaction 1, NH(C2H5)COCH2CON(C2H5)2 corresponding to the cleavage of a N–C(alkyl) bond, the calculated vibration frequencies with strong infrared intensity are 1695, 1637 and 1553 cm−1; the first two values correspond to C![[double bond, length as m-dash]](https://www.rsc.org/images/entities/char_e001.gif) O stretching whereas the latter one is due to the N–H bending mode. These values are in close agreement with those measured for N-methyl-N,N′-dioctylhexylethoxymalonamide (MDOHEMA) in octane (respectively 1684, 1637 and 1532 cm−1, see Fig. 1 in Supporting Information†). This comparison is justified by the fact that these band positions are neither very sensitive to the nature of the alkyl groups on the nitrogen atom nor to the group on the central carbon atom, as can also be seen from the comparison of Fig. 4 and 5 in Supporting Information.† Reaction 2 which corresponds to the cleavage of a N–C(
O stretching whereas the latter one is due to the N–H bending mode. These values are in close agreement with those measured for N-methyl-N,N′-dioctylhexylethoxymalonamide (MDOHEMA) in octane (respectively 1684, 1637 and 1532 cm−1, see Fig. 1 in Supporting Information†). This comparison is justified by the fact that these band positions are neither very sensitive to the nature of the alkyl groups on the nitrogen atom nor to the group on the central carbon atom, as can also be seen from the comparison of Fig. 4 and 5 in Supporting Information.† Reaction 2 which corresponds to the cleavage of a N–C(![[double bond, length as m-dash]](https://www.rsc.org/images/entities/char_e001.gif) O) bond and the formation of HCOCH2CON(Et)2 should be associated with the appearance of a band close to 1760 cm−1 (Fig. 2). Reaction 3 (cleavage of a central C–C bond) corresponds to the formation of two monoamides, CH3CON(C2H5)2 and HCON(Et)2. According to experimental spectra, tertiary monoamides are associated with a characteristic C
O) bond and the formation of HCOCH2CON(Et)2 should be associated with the appearance of a band close to 1760 cm−1 (Fig. 2). Reaction 3 (cleavage of a central C–C bond) corresponds to the formation of two monoamides, CH3CON(C2H5)2 and HCON(Et)2. According to experimental spectra, tertiary monoamides are associated with a characteristic C![[double bond, length as m-dash]](https://www.rsc.org/images/entities/char_e001.gif) O stretching band at 1665 cm−1 (see Fig. 2 in Supporting Information†). This is very similar to the calculated value for CH3CON(C2H5)2 (1668 cm−1). For HCON(C2H5)2, the calculated value of the C
O stretching band at 1665 cm−1 (see Fig. 2 in Supporting Information†). This is very similar to the calculated value for CH3CON(C2H5)2 (1668 cm−1). For HCON(C2H5)2, the calculated value of the C![[double bond, length as m-dash]](https://www.rsc.org/images/entities/char_e001.gif) O stretching band is 1701 cm−1 which is consistent with the experimental value of 1689 cm−1 for N,N-dibutylformamide (see Fig. 3 in Supporting Information†).
O stretching band is 1701 cm−1 which is consistent with the experimental value of 1689 cm−1 for N,N-dibutylformamide (see Fig. 3 in Supporting Information†).
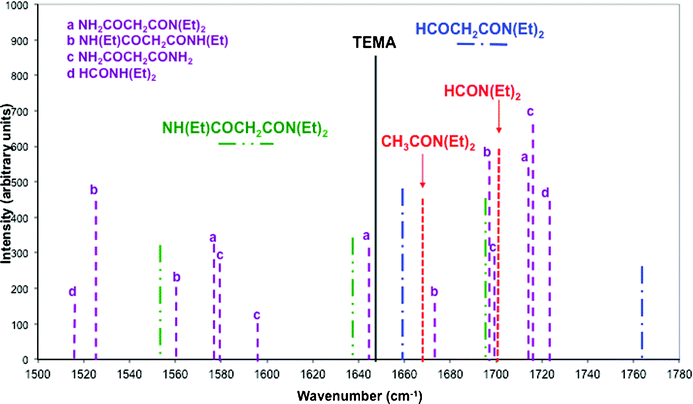 | ||
| Fig. 2 Calculated infrared frequencies and intensities for TEMA and some of its derivatives in the energy region 1500–1800 cm−1 obtained from DFT (B3LYP) calculations. Only frequencies with intensities higher than 100 are reported. Lines in dashed dotted dotted green are for the product of reaction 1 ((Et)NHCOCH2CON(Et)2), in dashed dotted blue for reaction 2 (HCOCH2CON(Et)2) and in dotted red for reaction 3 (CH3CON(Et)2 and HCON(Et)2) (see Scheme 2). Lines in dotted purple are for other derivatives of TEMA. | ||
1.1.2 Malonamide with substituents on the central carbon. For DMDBTDMA, the three components of the C
![[double bond, length as m-dash]](https://www.rsc.org/images/entities/char_e001.gif) O stretching band measured at 1640, 1657 and 1673 cm−1 (Fig. 4 in Supporting Information†) can also be attributed to the presence of the two conformers if we compare it to the simulated spectra of TMEMA (Fig. 3). The larger component measured at 1640 cm−1 can be attributed to the most stable conformer A (calculated at 1644 cm−1 after scaling by 0.984), which is also the case of the component centred at 1657 cm−1 (a second band corresponding to the C
O stretching band measured at 1640, 1657 and 1673 cm−1 (Fig. 4 in Supporting Information†) can also be attributed to the presence of the two conformers if we compare it to the simulated spectra of TMEMA (Fig. 3). The larger component measured at 1640 cm−1 can be attributed to the most stable conformer A (calculated at 1644 cm−1 after scaling by 0.984), which is also the case of the component centred at 1657 cm−1 (a second band corresponding to the C![[double bond, length as m-dash]](https://www.rsc.org/images/entities/char_e001.gif) O stretching vibration being calculated at 1660 cm−1). The component at 1673 cm−1 can be attributed to conformer B (with two bands calculated at 1667 and 1685 cm−1).
O stretching vibration being calculated at 1660 cm−1). The component at 1673 cm−1 can be attributed to conformer B (with two bands calculated at 1667 and 1685 cm−1).
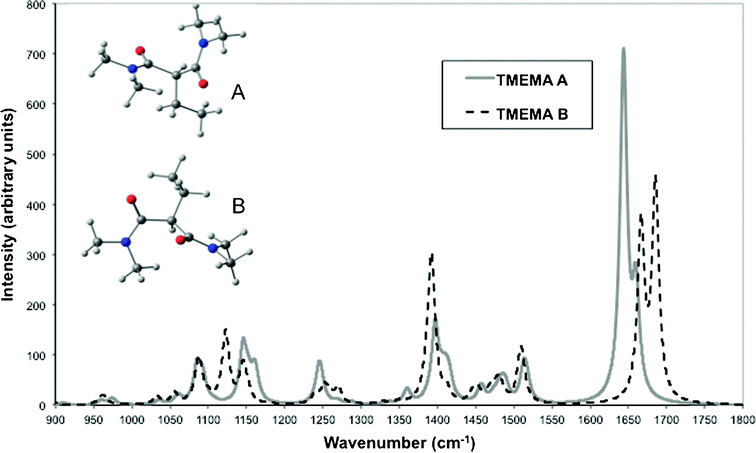 | ||
| Fig. 3 Infrared spectra of TMEMA calculated from DFT (B3LYP) for conformers A (the lowest in energy, solid line) and B (dashed line). Calculated spectra were simulated by broadening the calculated transitions as a sum of Lorentzian functions with bandwidths at half height of 11 cm−1. | ||
Frequencies and IR intensities calculated for fragmentation products of TMEMA are reproduced in Fig. 4. Upon reaction 1, corresponding to the cleavage of a N–C bond with the formation of HN(CH3)COCH2(C2H5)CON(CH3)2, the intensity of the main band should decrease and two intense bands should appear, one at ∼1690 cm−1 and the other at ∼1560 cm−1. Upon reaction 2, corresponding to the cleavage of one N–C(![[double bond, length as m-dash]](https://www.rsc.org/images/entities/char_e001.gif) O) bond and the formation of HCOCH2(C2H5)CON(CH3)2, the main band should be displaced toward ∼1670 cm−1 and a new band should appear at ∼1750 cm−1. Upon reaction 3 and the formation of HCON(CH3)2 and C3H7CON(CH3)2 the main band should be displaced toward ∼1670 cm−1 and a new band should appear at ∼1700 cm−1.
O) bond and the formation of HCOCH2(C2H5)CON(CH3)2, the main band should be displaced toward ∼1670 cm−1 and a new band should appear at ∼1750 cm−1. Upon reaction 3 and the formation of HCON(CH3)2 and C3H7CON(CH3)2 the main band should be displaced toward ∼1670 cm−1 and a new band should appear at ∼1700 cm−1.
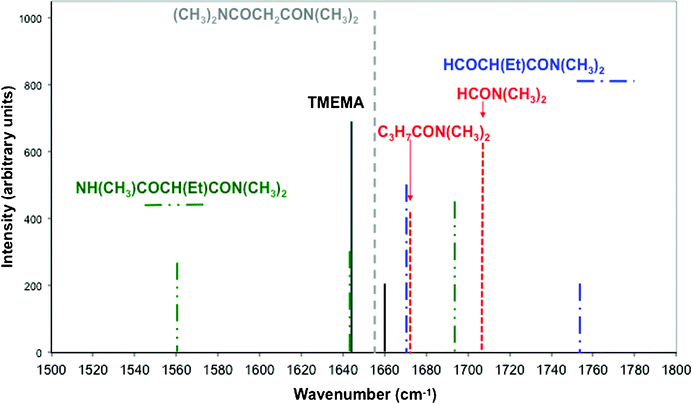 | ||
| Fig. 4 Calculated infrared frequencies and intensities for TMEMA and some of its derivatives in the energy region 1500–1800 cm−1 obtained from DFT (B3LYP) calculations. Only frequencies with intensities higher than 100 are reported. Lines in dashed dotted dotted green are for products of reaction 1, in dashed dotted blue for reaction 2, in short dotted red for reaction 3 and in dotted grey for reaction 4 (see Scheme 2). Lines in black are for TMEMA. | ||
1.1.3 Bond dissociation energies (BDEs). The relative strengths of C–C, C–N and C–H bonds that may be broken upon radiolysis were investigated by calculating the bond dissociation energies (BDEs). It should be remembered that upon radiolysis, a large amount of energy is available and that a large number of ionized species can be formed which are not considered here. BDEs are only indicative of the evolution of bond strengths in the series of compounds.
BDEs corresponding to homolytic C–C and C–N bond cleavage in reactions 1 to 4 are listed in Table 1. Increasing the length of the N-alkyl substituent, from TMMA to TEMA, strengthens the C–N bonds numbered 1 and 2 in Scheme 2 (by 34 and 23 kJ mol−1 respectively) and weakens slightly the C–C bond by 18 kJ mol−1. Adding an alkyl group to the central carbon atom, from TMMA to TMEMA, weakens the central C–C bond by 41 kJ mol−1 which becomes the weakest bond. It also slightly weakens the C–N bond number 2 (by 8 kJ mol−1) and slightly strengthens the C–N bond corresponding to the loss of the N-alkyl group (by 19 kJ mol−1).
![[double bond, length as m-dash]](https://www.rsc.org/images/entities/char_e001.gif) )C–N, (O
)C–N, (O![[double bond, length as m-dash]](https://www.rsc.org/images/entities/char_e001.gif) )C–C and C–C bonds (labelled as 1, 2, 3 and 4, respectively in Scheme 2) and C–H bonds in TMMA, TEMA, TMEMA and TMMEMA
)C–C and C–C bonds (labelled as 1, 2, 3 and 4, respectively in Scheme 2) and C–H bonds in TMMA, TEMA, TMEMA and TMMEMA
| Bond | TMMA | TEMA | TMEMA | TMMEMA |
|---|---|---|---|---|
| a H from the central C atom. b H from CH3 group of one N-alkyl chain. c H from CH2 group of one N-alkyl chain. d H from CH2 group of the central alkyl chain. e Corresponds to the dissociation of C2H4–OCH3 and f of OCH3. | ||||
| 1 | 354 | 388 | 373 | 377 |
| 2 | 393 | 416 | 385 | 397 |
| 3 | 380 | 362 | 339 | 350 |
| 4 | — | — | 354 | 360e–362f |
| C–H | 390b | 408a–428b–395c | 383a–388b–417d | — |
The BDEs for C–H bonds were calculated in TEMA and TMEMA. For TEMA the weakest C–H bond is one of the ethyl CH2 group whereas for TMEMA the weakest C–H bond is located on the central carbon atom.
![[double bond, length as m-dash]](https://www.rsc.org/images/entities/char_e001.gif) O stretching band between 1590 and 1800 cm−1. The 1500–1600 cm−1 spectral region may also be interesting due to the presence of characteristic N–H bending modes. The differential infrared spectra are recorded with respect to the solution before irradiation. The species formed upon irradiation are then detected as positive bands and the species which disappear as negative bands.
O stretching band between 1590 and 1800 cm−1. The 1500–1600 cm−1 spectral region may also be interesting due to the presence of characteristic N–H bending modes. The differential infrared spectra are recorded with respect to the solution before irradiation. The species formed upon irradiation are then detected as positive bands and the species which disappear as negative bands.
1.2.1 Tetraethylmalonamide (TEMA). The FT-IR spectra of a 10−1 mol dm−3 TEMA solution recorded just after irradiation is represented in Fig. 5 for different doses. The negative-going bands around 1645 cm−1 represent the loss of the TEMA in solution. Just after irradiation, two bands are observed. The first one is located around 1630 cm−1 whereas the second one is located around 1727 cm−1. According to the simulated and experimental spectra of TEMA and its fragmentation products (Fig. 2), the cleavage of bonds 1, 2 and 3 is associated with a diminution of the main absorption band around 1640 cm−1 and the apparition of two bands, around 1550 and 1690 cm−1 for reaction 1, around 1660 and 1760 cm−1 for reaction 2, and 1670 and 1700 cm−1 for reaction 3. No band appears around these wavenumbers on the experimental spectrum of TEMA, which may rule out the cleavage of bond 1, 2 and 3 for this compound. The positive band measured at ∼1630 cm−1 may correspond to a displacement of the C
![[double bond, length as m-dash]](https://www.rsc.org/images/entities/char_e001.gif) O stretching vibration which overlaps partly with the main band of the initial product. As a matter of fact, malonamides absorb in the 1620–1670 cm−1 spectral region as well as tertiary monoamides (Fig. 2 in Supplementary Information†). Therefore, the band detected around 1630 cm−1 could be the result of the overlap between positive bands of malonamides created upon irradiation and the negative band of the initial TEMA. Lastly, the 1727 cm−1 band is located at wavenumbers characteristic of aldehydes or acids.29 Acids can be formed after hydrolysis of the amide bond. Ionizing radiation and trace water molecules, but also dissolved dioxygen molecules, would induce this hydrolysis.
O stretching vibration which overlaps partly with the main band of the initial product. As a matter of fact, malonamides absorb in the 1620–1670 cm−1 spectral region as well as tertiary monoamides (Fig. 2 in Supplementary Information†). Therefore, the band detected around 1630 cm−1 could be the result of the overlap between positive bands of malonamides created upon irradiation and the negative band of the initial TEMA. Lastly, the 1727 cm−1 band is located at wavenumbers characteristic of aldehydes or acids.29 Acids can be formed after hydrolysis of the amide bond. Ionizing radiation and trace water molecules, but also dissolved dioxygen molecules, would induce this hydrolysis.
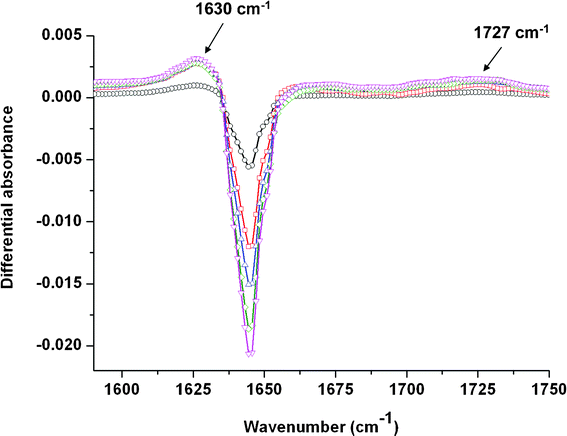 | ||
| Fig. 5 Evolution of the differential absorbance (after/before) irradiation of a 10−1 mol dm−3 TEMA solution in the 1590–1750 cm−1 spectral region as a function of the dose: 6.8 kGy (○); 13.6 kGy (□); 20.4 kGy (△); 27.2 kGy (◇) and 34 kGy (▽). The spectra are recorded just after irradiation. | ||
The evolution of the area of the negative band as a function of the dose is presented in Fig. 6. From this figure, it is clear that this evolution is not linear in the dose range studied here, i.e. in the 0–140 kGy range. This non-linear behaviour can be attributed to an accumulation of malonamides formed upon radiolysis. In principle, in situ infrared experiments enable us to quantitatively measure radiolytic yields, for example to obtain the disappearance yield of the initial compound.32 We can also estimate here a radiolytic yield of consumption of TEMA by only taking into account the four lowest doses (Fig. 6) for which the accumulation of malonamides is considered to be negligible. This leads to G(TEMA) = −(1.2 ± 0.2) 10−7 mol J−1. This value is consistent with radiolytic yields determined in the case of the TODGA (N,N,N′,N′-tetraoctyl-3-oxapentane-1,5-diamide) molecule diluted in n-dodecane at the same concentration.33
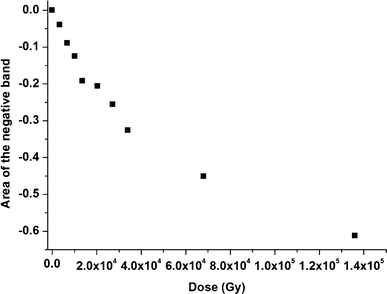 | ||
| Fig. 6 Evolution of the area of the negative band around 1645 cm−1 of a 10−1 mol dm−3 TEMA solution as a function of the dose. In the dose range studied here, the area of the band does not evolve linearly with the dose. | ||
1.2.2 Malonamides with substituents on the central carbon (DMDBTDMA and DMDOHEMA). In the case of the DMDBTDMA compound, the infrared spectrum in the C
![[double bond, length as m-dash]](https://www.rsc.org/images/entities/char_e001.gif) O stretching region exhibits a strong signal with a major contribution centred at 1640 cm−1 and two smaller components centred at 1657 and 1673 cm−1 (see Fig. 4 in Supporting Information†). The FT-IR spectra of a 10−1 mol dm−3 DMDBTDMA solution recorded just after irradiation is represented in Fig. 7 for different doses. The negative-going bands around 1640 cm−1 correspond to the loss of the DMDBTDMA in solution. Just after irradiation, different positive bands are observed. The first one is located around 1620 cm−1 and becomes enveloped in the broad negative band at the higher dose of 102 kGy. Bands are also detected in the 1680–1695 cm−1 region. The inset in Fig. 7 evidences that a band is always observed at 1683 cm−1 whereas a second one around 1692 cm−1 is detected when the dose is greater than 27.2 kGy. Lastly, a band around 1720 cm−1 is also evidenced. No bands are detected in the 1500–1600 cm−1 spectral range. As for TEMA, the 1620 cm−1 band can result in the overlap between malonamides formed upon irradiation and the disappearance of the initial DMDBTDMA. The comparison between the experimental and simulated infrared spectra for TMEMA (Fig. 4) indicates that the cleavage of bond 2 can be excluded since no band appears in the 1660–1670 and 1760 cm−1 region. This is also consistent with the highest bond dissociation energy found for this bond (see Table 1, 385 kJ mol−1 in the case of TMEMA). Besides, the cleavage of bond 1 would be associated with the apparition of a band around 1560 cm−1 whereas no band is observed in this region. Therefore, the apparition of the bands at 1683 and 1692 cm−1 can be attributed to the cleavage of the central C–C bond (reaction 3). Lastly, the 1720 cm−1 band can be attributed to the formation of a carbonyl or an acid function.
O stretching region exhibits a strong signal with a major contribution centred at 1640 cm−1 and two smaller components centred at 1657 and 1673 cm−1 (see Fig. 4 in Supporting Information†). The FT-IR spectra of a 10−1 mol dm−3 DMDBTDMA solution recorded just after irradiation is represented in Fig. 7 for different doses. The negative-going bands around 1640 cm−1 correspond to the loss of the DMDBTDMA in solution. Just after irradiation, different positive bands are observed. The first one is located around 1620 cm−1 and becomes enveloped in the broad negative band at the higher dose of 102 kGy. Bands are also detected in the 1680–1695 cm−1 region. The inset in Fig. 7 evidences that a band is always observed at 1683 cm−1 whereas a second one around 1692 cm−1 is detected when the dose is greater than 27.2 kGy. Lastly, a band around 1720 cm−1 is also evidenced. No bands are detected in the 1500–1600 cm−1 spectral range. As for TEMA, the 1620 cm−1 band can result in the overlap between malonamides formed upon irradiation and the disappearance of the initial DMDBTDMA. The comparison between the experimental and simulated infrared spectra for TMEMA (Fig. 4) indicates that the cleavage of bond 2 can be excluded since no band appears in the 1660–1670 and 1760 cm−1 region. This is also consistent with the highest bond dissociation energy found for this bond (see Table 1, 385 kJ mol−1 in the case of TMEMA). Besides, the cleavage of bond 1 would be associated with the apparition of a band around 1560 cm−1 whereas no band is observed in this region. Therefore, the apparition of the bands at 1683 and 1692 cm−1 can be attributed to the cleavage of the central C–C bond (reaction 3). Lastly, the 1720 cm−1 band can be attributed to the formation of a carbonyl or an acid function.
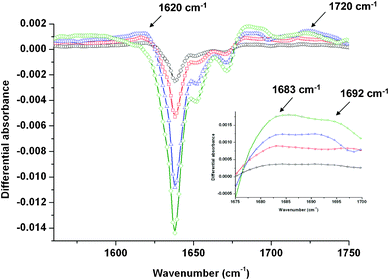 | ||
| Fig. 7 Evolution of the differential absorbance (after/before) irradiation of a 10−1 mol dm−3 DMDBTDMA solution in the 1550–1750 cm−1 spectral region as a function of the dose: 6.8 kGy (○); 13.6 kGy (□); 27.2 kGy (△) and 102 kGy (◇). The inset is a focus on the 1676–1700 cm−1 region. The spectra are recorded just after irradiation. | ||
In the case of the DMDOHEMA compound, the infrared spectrum in the C![[double bond, length as m-dash]](https://www.rsc.org/images/entities/char_e001.gif) O stretching region exhibits a signal with similar contributions at respectively 1640, 1657 and 1670 cm−1 (see Fig. 5 in Supporting Information†). The FT-IR spectra of a 10−1 mol dm−3 DMDOHEMA solution recorded just after irradiation are represented in Fig. 8 for different doses. No band is detected in the 1500–1600 cm−1 range (spectral region not shown). The negative-going bands around 1660 cm−1 represent the loss of the DMDOHEMA solution. Just after irradiation, two positive bands are observed. The first one is located at 1643 cm−1 whereas the second one is at 1683 cm−1. As no band is detected around 1530 cm−1, characteristic of N–H bending modes, the formation of a compound resulting from reaction 1 can be ruled out (see Fig. 1 in Supporting Information†). As in the preceding cases, the 1643 cm−1 band can result in the overlap between malonamides formed upon irradiation and the disappearance of the initial DMDOHEMA. At higher wavenumbers, noise prevents a careful interpretation of formed bands. As in the preceding case, the band at 1683 cm−1 can be attributed to reaction 3 (cleavage of the central C–C bond). Lastly, the non-irradiated DMDOHEMA exhibits a characteristic strong band at 1114 cm−1 corresponding to an asymmetric C–O–C stretch.29 The differential spectra obtained after irradiation are not easy to interpret in this spectral region because of the interplay with the radiolysis of the solvent (octane). Nevertheless, a decrease of the 1114 cm−1 band after irradiation is observed in the infrared spectra (not shown here). This evidences the fact that the ether is cleaved after irradiation, leading probably to the formation of alcohols.
O stretching region exhibits a signal with similar contributions at respectively 1640, 1657 and 1670 cm−1 (see Fig. 5 in Supporting Information†). The FT-IR spectra of a 10−1 mol dm−3 DMDOHEMA solution recorded just after irradiation are represented in Fig. 8 for different doses. No band is detected in the 1500–1600 cm−1 range (spectral region not shown). The negative-going bands around 1660 cm−1 represent the loss of the DMDOHEMA solution. Just after irradiation, two positive bands are observed. The first one is located at 1643 cm−1 whereas the second one is at 1683 cm−1. As no band is detected around 1530 cm−1, characteristic of N–H bending modes, the formation of a compound resulting from reaction 1 can be ruled out (see Fig. 1 in Supporting Information†). As in the preceding cases, the 1643 cm−1 band can result in the overlap between malonamides formed upon irradiation and the disappearance of the initial DMDOHEMA. At higher wavenumbers, noise prevents a careful interpretation of formed bands. As in the preceding case, the band at 1683 cm−1 can be attributed to reaction 3 (cleavage of the central C–C bond). Lastly, the non-irradiated DMDOHEMA exhibits a characteristic strong band at 1114 cm−1 corresponding to an asymmetric C–O–C stretch.29 The differential spectra obtained after irradiation are not easy to interpret in this spectral region because of the interplay with the radiolysis of the solvent (octane). Nevertheless, a decrease of the 1114 cm−1 band after irradiation is observed in the infrared spectra (not shown here). This evidences the fact that the ether is cleaved after irradiation, leading probably to the formation of alcohols.
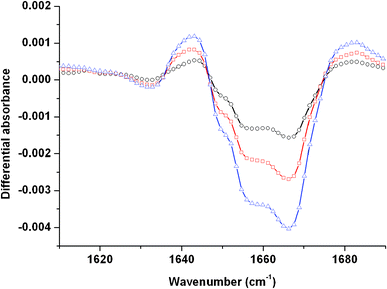 | ||
| Fig. 8 Evolution of the differential absorbance (after/before) irradiation of a 10−1 mol dm−3 DMDOHEMA solution in the 1600–1690 cm−1 spectral region as a function of the dose: 13.6 kGy (○); 20.4 kGy (□) and 34 kGy (△). The spectra are recorded just after irradiation. | ||
1.3.1 Tetraethylmalonamide (TEMA). The ESI-MS spectra of a 10−1 mol dm−3 TEMA solution before and after irradiation are presented in Fig. 9. The peak at m/z = 215.2 corresponds to the protonated form of TEMA (labeled as MH+), the other peaks with the increasing intensity from 0 to 485 kGy (Fig. 9B) correspond to the formation of compounds due to the radiolysis of the TEMA.
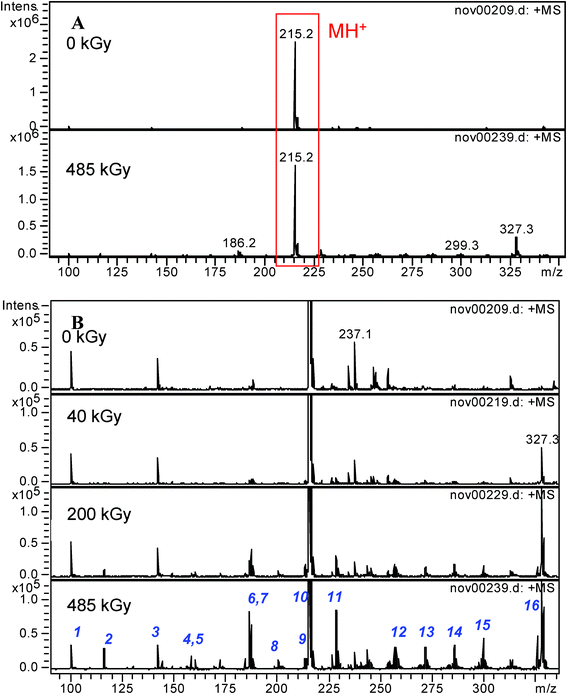 | ||
| Fig. 9 Electrospray ionization mass spectra of a 10−1 mol dm−3 TEMA solution in n-octane after radiolysis in the m/z = 100–350 range. MH+ is the protonated form of the initial malonamide. A: before and after irradiation at 485 kGy. B: influence of the irradiation dose, focus on the low intensity peaks. | ||
Table 2 presents the proposed formulae of the degradation products identified at the higher doses (≥200 kGy). Besides the presence of the fragmentation products (molecular weight lower than those of TEMA), the first observation is the formation of recombination compounds (having a molecular weight higher than those of TEMA). The mains peaks at m/z = 116.1; 187.1 and 327.4 are assigned to CH3CON(C2H5)2 (cleavage of bond 3); (C2H5)2NCOCH2CON(C2H5)H (cleavage of bond 1) and to a compound arising from the reaction of the diluent with the TEMA [compound 16: (C2H5)2NCOCH2CON(C2H5)(C10H21)]. The other compounds from m/z = 228.2 to m/z = 299.3 are obtained by reaction of the diluent with several degradation products or by degradation of compound 16. The MS2 spectra of compound 16 (See Fig. 6 in Supporting Information†) is compatible with the addition of the octyl group on a carbon atom on the ethyl group, probably the carbon in the alpha position of the nitrogen atom. This is also consistent with ab initio calculations (Table 1).
| Species number | m/z | Identification | Comment |
|---|---|---|---|
| 1 | 100.2 | [HCON(C2H5)2H-2]H+ | Impurity |
| 2 | 116.1 | [CH3CON(C2H5)2]H+ | Cleavage 3 |
| 3 | 142.1 | [HCOCH2CON(C2H5)2H-2]H+ | Impurity |
| 4 | 158.2 | [(C10H21)NH2]H+ | Cleavage 1 and 2 and C8H17 addition |
| 5 | 160.1 | [(C2H5)2NCOCH2COOH]H+ | Cleavage 2 and OH addition |
| 6 | 186.2 | [(C2H5)(C10H21)NH]H+ | Cleavage 2 and C8H17 addition |
| 7 | 187.1 | [(C2H5)2NCOCH2CON(C2H5)H]H+ | Cleavage 1 |
| 8 | 200.2 | n.d. | |
| 9 | 213.2 | (MH-2)H+ | |
| 10 | 215.2 | MH+ | TEMA |
| 11 | 228.2 | [CH3CON(C2H5)(C10H21)]H+ | Cleavage 3 and C8H17 addition |
| 12 | 256.3 | n.d. | |
| 13 | 271.2 | [(C2H5)HNCOCH2CONH(C10H21)]H+ | Two cleavages 1 and C8H17 addition |
| 14 | 285.3 | n.d. | |
| 15 | 299.3 | [(C2H5)2NCOCH2CONH(C10H21)]H+ | Cleavage 1 and C8H17 addition |
| 16 | 327.4 | [(C2H5)2NCOCH2CON(C2H5)(C10H21)]H+ | C–H cleavage and C8H17 addition |
It is important to notice that at low integrated dose (i.e. 40 kGy), the main degradation product observed is compound 16 (addition of the solvent on TEMA), the compounds formed by the cleavage of bond 1, 2 and 3 appearing only in significant amount at higher irradiation dose (200 and 485 kGy). These observations are consistent with the in situ analysis by infrared spectroscopy which rules out the cleavage of bond 1, 2 and 3 for an irradiation dose of 34 kGy. The compound 5, which is formed by cleavage of the bond 2 followed by the formation of an acid function, is only observed at higher irradiation dose on the ESI mass spectra. The IR band observed at 1727 cm−1 is probably due to the presence of this acid molecule. We point out here the fact that ESI-MS and IR spectroscopy have different sensitivities according to the nature of the detected molecules.
1.3.2 Malonamides with substituents on the central carbon (DMDBTDMA and DMDOHEMA). The ESI-MS spectra of 10−1 mol dm−3 DMDBTDMA and DMDOHEMA solution before and after irradiation are presented in Fig. 10 and 11, respectively. The peak at m/z = 439.5 (Fig. 10) and at m/z = 483.5 (Fig. 11) corresponds to the protonated form of DMDBTDMA and DMDOHEMA, respectively (labeled as MH+). The other peaks correspond to the formation of compounds due to the radiolysis of those malonamides. Tables 3 and 4 present the proposed formulae of the degradation products identified after irradiation at high dose (≥200 kGy).
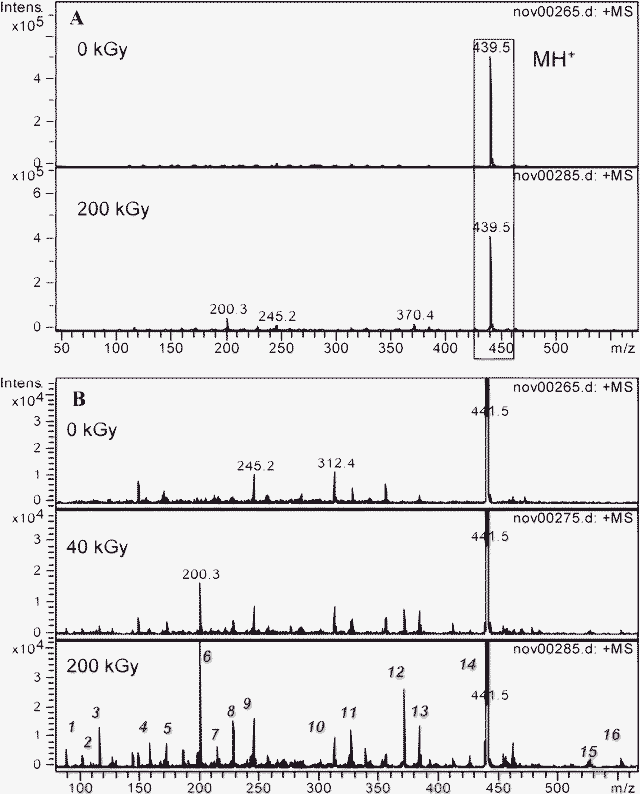 | ||
| Fig. 10 Electrospray ionization mass spectra of a 10−1 mol dm−3 DMDBTDMA solution in n-octane after radiolysis in the m/z = 70–600 range. MH+ is the protonated form of the initial malonamide. A: before and after irradiation at 200 kGy. B: influence of the irradiation dose, focus on the low intensity peaks. | ||
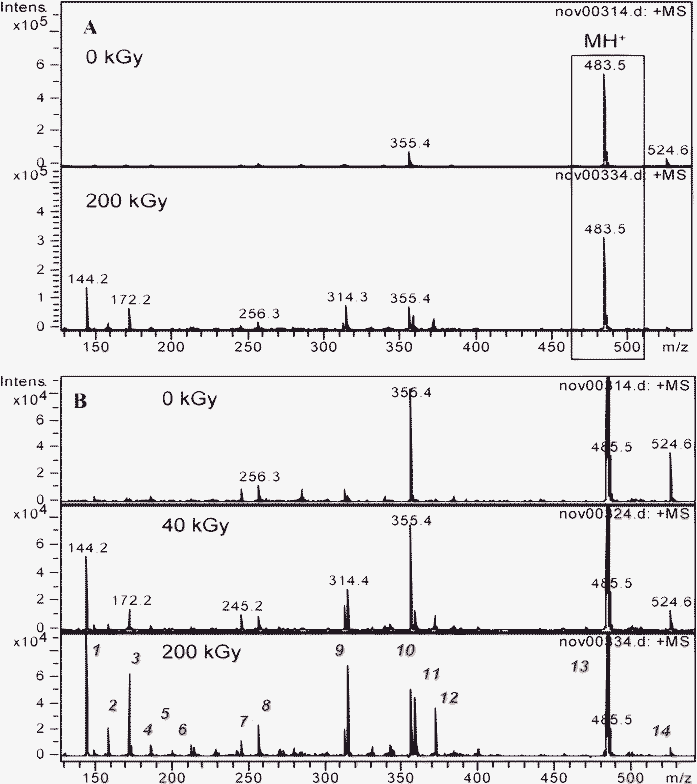 | ||
| Fig. 11 Electrospray ionization mass spectra of a 10−1 mol dm−3 DMDOHEMA solution in n-octane after radiolysis in the m/z = 100–550 range. MH+ is the protonated form of the initial malonamide. A: before and after irradiation at 200 kGy. B: influence of the irradiation dose, focus on the low intensity peaks. | ||
| Species number | m/z | Identification | Comment |
|---|---|---|---|
| 1 | 88.2 | [(C4H9)(CH3)NH]H+ | Cleavage 2 |
| 2 | 102.2 | [HCONH(C4H9)]H+ | Cleavages 1 and 3 |
| 3 | 116.1 | [(C4H9)(CH3)NCOH]H+ | Cleavage 3 |
| 4 | 158.2 | n.d. | |
| 5 | 172.2 | n.d. | |
| 6 | 200.3 | [(C4H9)(CH3)NH+C8H16]H+ | Cleavage 2 and C8H17 addition |
| 7 | 214.3 | n.d. | |
| 8 | 228.2 | [HCON(C4H9)(CH3)+C8H16]H+ | Cleavage 3 and C8H17 addition |
| 9 | 245.2 | n.d. | Impurity |
| 10 | 312.4 | n.d. | Impurity |
| 11 | 326.5 | [(C4H9)(CH3)NCOC15H31]H+ | Cleavage 3 |
| 12 | 370.4 | [(C4H9)(CH3)NCOCH(C14H29)COOH]H+ | Cleavage 2 and OH addition |
| 13 | 383.5 | [(C4H9)(CH3)NCOCH(C14H29)CONH(CH3)]H+ | Cleavage 1 |
| 14 | 439.5 | [(C4H9)(CH3)NCOCH(C14H29)CON(C4H9)(CH3)]H+ | DMDBTDMA |
| 15 | 526.4 | Adduct [DMDBTDMA+(C4H9)(CH3)NH]H+ | Adduct |
| 16 | 551.6 | [DMDBTDMA+C8H16]H+ | C–H cleavage and C8H17 addition |
| Species number | m/z | Identification | Comment |
|---|---|---|---|
| a Only observed after irradiation at 0.7 MGy. | |||
| 1 | 144.2 | [(C8H17)(CH3)NH]H+ | Cleavage 2 |
| 2 | 158.2 | [HCONH(C8H17)]H+ | Cleavages 1 and 3 |
| 3 | 172.2 | [(C8H17)(CH3)NCOH]H+ | Cleavage 3 |
| 4 | 186.2 | [(C8H17)(CH3)NCOCH3]H+ | Cleavages 3 and of the central chain |
| 5 | 212.2 | n.d. | |
| 6 | 228.3 | n.d. | |
| 7 | 242.3 | n.d. | |
| 8 | 256.3 | [(C8H17)(CH3)NH+C8H16]H+ | Cleavage 2 and C8H17 addition |
| 9 | 314.3 | [(C8H17)(CH3)NCOC3H6OC6H13]H+ | Cleavage 3 |
| 10 | 355.4 | [(C8H17)(CH3)NCOCH2CON(CH3)(C8H17)]H+ | Impurity |
| 11 | 358.3 | [(C8H17)(CH3)NCOCH(C2H4OC6H13)COOH]H+ | Cleavage 2 and OH addition |
| 12 | 371.4 | [(C8H17)(CH3)NCOCH(C2H4OC6H13)CONH(CH3)]H+ | Cleavage 1 |
| 13 | 483.5 | [(C8H17)(CH3)NCOCH(C2H4OC6H13)CON(C8H17)(CH3)]H+ | DMDOHEMA |
| 14 | 524.6 | [(C8H17)(CH3)NCOCH(C2H4N(CH3)(C8H17))CON(C8H17)(CH3)]H+ | Impurity |
| 15 | 595.6 | [DMDOHEMA+C8H16]H+ | C–H cleavage and C8H17 additiona |
With these two malonamides, the compounds formed by recombination are now minor. Only one compound at higher molecular weight than the initial malonamide is observed at high irradiation dose (m/z = 551.6 for DMDBTDMA and m/z = 595.6 for DMDOHEMA) and it is formed in small amounts. Amine, monoamide, malonamide and acid have been identified. Some compounds are formed by cleavage of the N–C bond (reaction 1), of the N–C amide bond (reaction 2), of the C–C bond (reaction 3) or by a combination of reaction 2 or 3 with the addition of a diluent molecules (compounds 6 and 8 in Table 3 and 8 in Table 4). In contrast to the TEMA behavior, the cleavage of the bond 1, 2 or 3 is observed at a low irradiation dose (40 kGy) whereas no recombination reaction is detected.
The comparison of the in situ analysis by infrared spectroscopy with the ESI-MS analysis at 40 kGy shows some discrepancies amongst them. For the DMDBTDMA molecule, the cleavage of the bond 1 and 2 is ruled out from the IR analysis while the presence of the compound 13 ([(C4H9)(CH3)NCOCH(C14H29)CONH(CH3)]) in Fig. 10B indicates the cleavage of bond 1, and the presence of the species 1 and 6 (amines) and 12 [(C4H9)(CH3)NCOCH(C14H29)COOH] indicate the cleavage of bond 2. This could be due to the fact that the compounds 1 and 6, which are amines, have a high response factor in electrospray ionisation positive mode and could then be detected even at a very low concentration. Similarly, the compound 12 (acid) is obtained by the cleavage of bond 2 followed by the reaction with trace water molecules. Its presence is consistent with the band observed at 1720 cm−1 in the IR spectra (Fig. 7). It is easily observed with infrared spectroscopy due to a high molar extinction coefficient. Nevertheless, the corresponding amine formed upon irradiation is not observed by IR spectroscopy due to a too low molar extinction coefficient. Similar trends are observed for the DMDOHEMA molecule.
2. Discussion
The three techniques used in the present study are complementary and enable us to describe the behaviour of malonamides diluted in alkane and exposed to ionizing radiation.In the case of TEMA, the major processes are recombination reactions. ESI-MS experiments evidence the addition of an octyl group (arising from the solvent). MS2 spectra indicate that this addition takes place on a carbon atom from the ethyl group, most likely on the carbon atom next to the nitrogen atom which has the weakest C–H bond in the molecule according to BDE calculations, leading to the formation of the [(C2H5)2NCOCH2CON(C2H5)(CH(C8H17)CH3)] molecule. At low dose, from ESI-MS, the major compound is the TEMA molecule with the addition of an octyl group. This is consistent with differential infrared spectra which don't indicate any significant reaction products arising from C–N or C–C bond cleavages. A band is detected in the C![[double bond, length as m-dash]](https://www.rsc.org/images/entities/char_e001.gif) O stretching region of malonamide which is consistent with the formation of a new malonamide. Besides, the formation of an acid is detected. The radicals formed after the (O
O stretching region of malonamide which is consistent with the formation of a new malonamide. Besides, the formation of an acid is detected. The radicals formed after the (O![[double bond, length as m-dash]](https://www.rsc.org/images/entities/char_e001.gif) )C–N bond cleavage can react with trace water molecules but also with dissolved dioxygen molecules leading to this amide hydrolysis reaction. At higher doses (ESI-MS experiments), reactions 1 and 3 are also evidenced, even though they are minor. Reaction 2 involving the cleavage of the N–C(
)C–N bond cleavage can react with trace water molecules but also with dissolved dioxygen molecules leading to this amide hydrolysis reaction. At higher doses (ESI-MS experiments), reactions 1 and 3 are also evidenced, even though they are minor. Reaction 2 involving the cleavage of the N–C(![[double bond, length as m-dash]](https://www.rsc.org/images/entities/char_e001.gif) O) bond is very minor. This is consistent with BDEs calculations (Table 1) which show that bond 2 is the strongest in TEMA.
O) bond is very minor. This is consistent with BDEs calculations (Table 1) which show that bond 2 is the strongest in TEMA.
The two other malonamides studied here (DMDBTDMA and DMDOHEMA, with a substituent on the central carbon atom and with longer alkyl chains on the nitrogen atoms) exhibit clearly a very different behaviour as compared to TEMA. The recombination reactions are no longer the major processes and ESI-MS experiments evidence that the three bond cleavages (Scheme 2) are detected. At lower doses, in situ infrared experiments associated to quantum chemistry calculations prove that the central C–C bond is preferentially cleaved upon irradiation. This is also consistent with the bond dissociation energy values (Table 1) which become the smallest upon addition of an alkyl chain on the central atom. We point out here that the same kind of effect is observed when the alkyl chain length on the nitrogen atoms is increased. As a matter of fact, in the case of N,N,N′,N′-tetrabutylmalonamide, ((C4H9)2NCO)2CH2, the central C–C bond is attacked (in situ infrared experiments, Fig. 7 in Supporting Information†) which is not the case in TEMA. This is consistent with BDEs calculations: increasing the length of the N-alkyl substituent, from TMMA to TEMA, strengthens C–N bonds numbered 1 and 2 and weakens the C–C bond (Table 1).
At first glance, it seems surprising that there is such a good correlation between the observed behaviour of malonamides under irradiation and the calculated BDEs. Ionizing radiation is known to be absorbed non-selectively so that molecules are excited according to their relative abundance in the studied medium. At the concentrations studied here (0.1 mol dm−3), i.e. in dilute solutions, the excited molecules are essentially those of the solvent and thus only indirect effects from the solvent to extractant molecules are to be expected. It is therefore not surprising that the less energetic channel is preferentially observed at the lowest irradiation doses. The direct excitation of the malonamides in the radiolysis of dilute solutions being unlikely, ionizing radiation interacts with liquid octane (C8H18) to produce excited alkane molecules (C8H18*) and electron-hole pairs. Most of the ejected electrons thermalize before they can escape the Coulombic attraction of the positive charges. The majority of the electrons recombine with the holes. The recombination of these electron-hole pairs leads to the formation of unstable excited octane molecules. The fate of these species is then determined by the deactivation, fragmentation and chemical reactions that they undergo with the surrounding molecules. Roughly, we can assume that the radiolysis of octane will first mainly yield the lowest singlet and triplet states of octane. The singlet and triplet states will react according to the following equations:34
| 1C8H18* → alkene + H2 | (1) |
| 3C8H18* → ˙C8H17 + H˙ | (2) |
| 3C8H18* + C8H18 → 2 ˙C8H17 + H2 | (3) |
It was shown in the radiolysis of N,N-dihexyloctanamide (C7H15CON(C6H13)2) in dodecane solution that its radiolytic reactivity proceeds mainly through reactions with ˙C12H25 and H˙ radicals.35 The authors evidenced the formation of the H-atom adduct C7H15C˙(OH)N(C6H13)2 and of the ˙C12H25 adduct C7H15C(C12H25)O˙N(C6H13)2.35
Hayon et al. have studied the reactivity of HO˙ radicals with amides in aqueous solutions.36 We point out here the fact that H˙ are expected to react with amides in the same manner as hydroxyl radicals, i.e. with abstraction reactions, thus allowing the comparison. The authors36 proved that with the N-methylated amides, abstraction by HO˙ radicals is selective and takes place mainly from the N-methyl group according to the reaction:
| HO˙ + CH3CON(CH3)2 → CH3CON(C˙H2)(CH3) + H2O | (4) |
What we observe in the case of TEMA is consistent with the observation of Hayon et al.:36
| (C2H5)2NCOCH2CON(C2H5)2 + H˙ → (C2H5)2NCOCH2CON(CH˙CH3) + H2 | (5) |
| (C2H5)2NCOCH2CON(CH˙CH3) + C8H18 → (C2H5)2NCOCH2CON(C2H5)(CH(C8H17)CH3) + H˙ | (6) |
Let's point out that reaction (6) can also lead to the re-formation of TEMA with the production of a ˙C8H17 radical. This selective production of one parent radical is characteristic of dilute solutions.37 Hydrogen atoms are generated, and they react selectively with the molecules of interest. The reaction similar to reaction (6) is minor in the case of the DMDBTDMA and DMDOHEMA solutions. Nevertheless, this reaction can also lead to the re-formation of the initial malonamide, with the production of a ˙C8H17 radical.
Upon radiolysis, malonamide excited states can be formed here, probably mainly by energy transfer processes from excited octane molecules. Nevertheless, these excited malonamide molecules may also be produced thanks to other processes such as ion recombination or excitation by Cerenkov radiation. In the case of DMDBTDMA and DMDOHEMA solutions, the central C–C bond energy is weakened as compared to TEMA and excitation is transferred from octane to malonamides, leading then preferentially to the formation of the RR′NCO˙ and ˙CHR′′CONRR′ radicals (Scheme 2). These radicals will then react with octane molecules to abstract a hydrogen atom. In all cases, we observe that the malonamides are excited leading to the formation of ˙NRR′ and ˙COCHR′′NRR′ radicals formed after the (O![[double bond, length as m-dash]](https://www.rsc.org/images/entities/char_e001.gif) )C–N bond cleavage (Scheme 2). The following reactions are then observed:
)C–N bond cleavage (Scheme 2). The following reactions are then observed:
| ˙NRR′ + C8H18 → HNRR′ + ˙C8H17 | (7) |
| ˙COCHR′′NRR′ + H2O → HOOCCHR′′NRR′ + H˙ | (8) |
Reaction 8 with trace water molecules accounts for the hydrolysis of amides in octane solution and submitted to ionizing radiation. Nevertheless, this reaction is minor under our experimental conditions. Indeed, previous studies have evidenced that the acid formation occurred mainly in the presence of aqueous nitric acid.33
Experimental
Irradiations with 10 MeV electrons
The irradiations were performed using the electron pulses of a Titan Beta, Inc. linear accelerator (LINAC) which delivers electrons of 8, 9 or 10 MeV energy. The energy bandwidth of the electrons is ±15%.38 In the present experiments, 10 ns pulses of 10 MeV electrons were used and we worked at a repetition rate of 10 Hz.A dose of 34 gray per pulse was determined using the Fricke dosimetry.39 We have checked that the dose determined by this method is analogous to the dose calculated using the SCN− dosimeter in pulse radiolysis.
Coupling of a FT-IR spectrometer with the LINAC
The coupling of infrared detection with the 10 MeV electrons is described elsewhere32 and enabled us to characterize in situ the effects of irradiation. The FT-IR spectrometer (Bruker Vertex 70) and the MCT (mercury cadmium telluride) detector were moved out of the accelerator room to be protected against radiation. The infrared beam is guided at a distance of 6 metres by mirrors and optical conduits (Axiot tubes) purged by dinitrogen. The infrared beam goes from the interferometer to the sample, and then to the detector.The spectra are averaged from 100 scans at a 4 cm−1 resolution. As there is no handling of the sample, the IR spectra are recorded within 1–2 min(s) after the end of the irradiation. Moreover, we checked by recording IR spectra at different times after the end of the irradiation that the system was stable. We used bare CaF2 windows with mylar spacers of 25 μm. The solutions were 0.1 mol dm−3 malonamide solutions diluted in octane. Spectra of irradiated solutions were recorded with reference to the same solution just before irradiation, which allowed us to detect the effects of irradiation by measuring differential absorption. The solution was renewed before each irradiation.
The IR spectra of non-irradiated solutions and of reference solutions were checked using the FT-IR spectrometer in a more “conventional” way, with a DTGS (deuterated triglycine sulfate) detector and octane as the reference.
The spectra were fitted as a sum of Gaussian and/or Lorentzian functions. The fit was optimized according to the least square method using the Levenberg–Marquardt method.40
Preparation of the samples
Octane (Fluka, 99%) was used as received. TEMA, DMDBTDMA and DMDOHEMA were obtained from Panchim (Lisses, France) with a purity higher than 98%.Electrospray ionization mass spectrometry (ESI-MS)
The mass spectrometry measurements were recorded in positive ionization mode using a Bruker Esquire-LC quadrupole ion trap equipped with an electrospray interface. ESI-MS was calibrated with a Hewlett-Packard “Tuning Mix” standard in acetonitrile solution. Experimental conditions were in positive ion mode, drying gas (N2): 5 L min−1, nebulizer gas 5 psi at 250 °C, ion spray voltage of 4000 V, cap exit offset of 60 V, skimmer 1 at 20–45 V, skimmer 2 at a constant 10 V, trapdrive 30 or 50. Spectra were acquired over an m/z mass range of 45–2200. A syringe infusion pump (Cole Palmer) delivered the sample at a flow rate of 90 μL h−1 to the electrospray source.Malonamide 10−1 mol dm−3 solutions (before and after radiolysis) in n-octane were diluted 1![[thin space (1/6-em)]](https://www.rsc.org/images/entities/char_2009.gif) :
:![[thin space (1/6-em)]](https://www.rsc.org/images/entities/char_2009.gif) 1000 in an acetonitrile–water mixture (50
1000 in an acetonitrile–water mixture (50![[thin space (1/6-em)]](https://www.rsc.org/images/entities/char_2009.gif) :
:![[thin space (1/6-em)]](https://www.rsc.org/images/entities/char_2009.gif) 50) containing ∼10−5 mol dm−3 of acid before analysis. After irradiation, the solutions were stored in a freezer (at −25 °C) prior to analysis in order to avoid modifications of the chemical composition of the solution.
50) containing ∼10−5 mol dm−3 of acid before analysis. After irradiation, the solutions were stored in a freezer (at −25 °C) prior to analysis in order to avoid modifications of the chemical composition of the solution.
We point out here the fact that the electrospray ionization depends on the physico-chemical parameters of the compounds (pKa of the compounds, pH of the solution, nature of the solvent, number of protonable sites…). Thus, it was difficult to form positive ions with compounds such as alkane, alkene or alcohols. Consequently, they were not detected by electrospray ionization mass spectrometry.
Computational details
Standard quantum chemistry calculations were carried out using the Gaussian 03 revision D.02 software package.41Geometries were optimized using Becke's hybrid functional (B3LYP)42,43 and were characterized by harmonic frequency analysis as local minima. For open-shell systems, spin-unrestricted calculations were done. To find the lowest conformers of the molecules, the potential energy surfaces were scanned using B3LYP and 6-31G(d) basis set. When possible, the surfaces were not fully scanned, but starting structures were selected from published conformational analysis reported on malonamides.31 IR frequencies and intensities were obtained from B3LYP/6-311+G(d,p) calculations in the presence of a continuum solvent model (IEFPCM in Gaussian 03) for solvent effects. In IEFPCM, the molecular cavity was constructed using a series of overlapping spheres with UAHF radii. The solvent model used was heptane because parameters for octane were not available in Gaussian 03.
Calculated bond dissociation energies (BDEs) corresponding to enthalpy variations associated to homolytic C–N, C–C or C–O bond cleavages at 298 K were determined using the G3MP2 composite method44 which was developed for thermochemistry calculations.
Conclusion
Thanks to the use of complementary techniques, a global description of the behaviour under ionizing radiation of malonamides diluted in alkane was obtained. Different behaviours depending on the malonamide structure are observed. The major channel observed at low dose in the case of TEMA is a recombination reaction, arising from the addition of an octyl group on the malonamide. The species resulting from recombination reactions are always in the majority even at higher doses. With the addition of an alkyl group on the central carbon atom and also the addition of alkyl groups on the nitrogen atoms, the central C–C bond is weakened. This bond is then preferentially cleaved upon irradiation, which is consistent with the smallest BDE calculated. When increasing the irradiation dose, the other bond cleavages (both C–N and C–H cleavages, see Scheme 2) are detected.These results clearly show that infrared spectroscopy is a very powerful tool to study in situ the reactivity of compounds under irradiation. We are currently implementing time-resolved infrared spectroscopy to obtain kinetic constants of the reaction mechanisms, especially in the case of monofunctional molecules.
Acknowledgements
We thank GNR PARIS for financial support. This work was supported by the French National Research Agency (ANR) under the “SPIRIT” project.References
- Application of tributyl phosphate in nuclear fuel reprocessing, in Science and technology of tributyl phosphate, ed. W.W. Schulz, L.L. Burger, J.D. Navratil, CRC Press Inc., Boca Raton, Florida, USA, 1990, vol. 3 Search PubMed.
- M. Miguirditchian, D. Guillaneux, D. Guillaumont, P. Moisy, C. Madic, M. P. Jensen and K. L. Nash, Inorg. Chem., 2005, 44, 1404–1412 CrossRef CAS.
- V. D. Zaitsev, E. L. Protasova and G. I. Khaikin, High Energy Chem., 1994, 28, 21–24 Search PubMed.
- V. D. Zaitsev and G. I. Khaikin, High Energy Chem., 1994, 28, 269–272 Search PubMed.
- J. Haofang, P. Xianming, W. Jilan, L. Fengmei, L. Andong and G. Hongchun, Radiat. Phys. Chem., 1996, 47, 815–816 CrossRef.
- J. Haofang, W. Jilan, Z. Xujia, F. Xingwang, Y. Side, Z. Zhihua and L. Nianyun, Radiat. Phys. Chem., 1999, 54, 245–251 CrossRef.
- Y. Du, J. Wu, F. Li and A. Liu, Radiat. Phys. Chem., 1999, 54, 455–461 CrossRef CAS.
- B. J. Mincher, S. P. Mezyk and L. R. Martin, J. Phys. Chem. A, 2008, 112, 6275–6280 CrossRef CAS.
- Y. Sugo, Y. Izumi, Y. Yoshida, S. Nishijima, Y. Sasaki, T. Kimura, T. Sekine and H. Kudo, Radiat. Phys. Chem., 2007, 76, 794–800 CrossRef CAS.
- L. Berthon and M.-C. Charbonnel, in Ion exchange solvent extraction, ed. B. Moyer, CRC Press Taylor & Francis Group, Boca Raton, London, New York, 2010, vol. 19, pp. 429–513 Search PubMed.
- J. W. T. Spinks and R. J. Woods, An introduction to radiation chemistry, Wiley-Interscience publication, New York, USA, 3rd edn, 1990 Search PubMed.
- C. Madic, P. Blanc, N. Condamines, P. Baron, L. Berthon, C. Nicol, C. Pozo, M. Lecomte, M. Philippe, M. H. Masson, C. Hill and M. J. Hudson, International Conference RECOD'94, London, 1994.
- P. Baron, L. Berthon, M.-C. Charbonnel and C. Nicol, International conference on future nuclear systems, Global' 97, Challenge towards second nuclear era with advanced fuel cycles, Yokohama, Japan, 1997 Search PubMed.
- A. Facchini, L. Amato, G. Modolo, R. Nannicini, C. Madic and P. Baron, Sep. Sci. Technol., 2000, 35, 1055–1068 CrossRef CAS.
- O. Courson, M. Lebrun, R. Malmbeck, G. Pagliosa, K. Romer, B. Satmark and J.-P. Glatz, Radiochim. Acta, 2000, 88, 857–863 CrossRef CAS.
- R. Malmbeck, O. Courson, G. Pagliosa, K. Romer, B. Satmark, J. P. Glatz and P. Baron, Radiochim. Acta, 2000, 88, 865–871 CrossRef CAS.
- D. Serrano-Purroy, P. Baron, B. Christiansen, J. P. Glatz, C. Madic, R. Malmbeck and G. Modolo, Sep. Purif. Technol., 2005, 45, 157–162 CrossRef CAS.
- G. Modolo, H. Vijgen, D. Serrano-Purroy, B. Christiansen, R. Malmbeck, C. Sorel and P. Baron, Sep. Sci. Technol., 2007, 42, 439–452 CrossRef CAS.
- C. Sorel, M. Montuir, D. L. Espinoux and B. and P. Baron, International solvent extraction conference, Tucson, USA, 2008.
- D. Serrano-Purroy, P. Baron, B. Christiansen, R. Malmbeck, C. Sorel and J. P. Glatz, Radiochim. Acta, 2005, 93, 351–355 CrossRef CAS.
- G. Thiollet and C. Musikas, Solvent Extr. Ion Exch., 1989, 7, 813–827 CrossRef CAS.
- C. Cuillerdier, C. Musikas, P. Hoel, L. Nigond and X. Vitart, Sep. Sci. Technol., 1991, 26, 1229–1244 CrossRef CAS.
- L. Berthon and B. Camès, Procédé DIAMEX: dégradation hydrolytique et radiolytique de l'extractant diamide DMDOHEMA, 2000 Search PubMed , Rapport scientifique, 1999, Direction du cycle du combustible CEA-R-5892, CEA.
- C. Madic, M. J. Hudson, J. O. Liljenzin, J. P. Glatz, R. Nannicini, A. Facchini, Z. Kolarik and R. Odoj, New partitioning techniques for minor actinides, European Report EUR 19149, Europe, 2000 Search PubMed.
- L. Berthon, J. M. Morel, N. Zorz, C. Nicol, H. Virelizier and C. Madic, Sep. Sci. Technol., 2001, 36, 709–728 CrossRef CAS.
- C. Madic, F. Testard, M. J. Hudson, J. O. Liljenzin, B. Christiansen, M. Ferrando, A. Facchini, A. Geist, G. Modolo, A. Gonzales-Espartero and J. De Mendoza, European project on partitioning: PARTNEW: new solvent extraction processes for minor actinides final report, 2004 Search PubMed , CEA-R-6066, CEA.
- H. B. Yang, E. H. Lee, J. K. Lim, D. Y. Chung and K. W. Kim, J. Radioanal. Nucl. Chem., 2009, 280, 495–502 CrossRef CAS.
- B. Camès, I. Bisel, P. Baron, C. Hill, D. Rudloff and B. Saucerotte, in Nuclear energy and environment, ed. C. M. Wai and B. J. Mincher, Oxford University Press, USA, 2010, vol. 1046, pp. 255–269 Search PubMed.
- N. B. Colthup, L. H. Daly and S. E. Wiberley, Introduction to infrared and Raman spectroscopy,Academic Press, San Diego, 3rd edn, 1990 Search PubMed.
- M. M. Schiavoni, H.-G. Mack, S. E. Ulic and C. O. Della Védova, Spectrochim. Acta, Part A, 2000, 56, 1533–1541 CrossRef.
- G. Sandrone, D. A. Dixon and B. P. Hay, J. Phys. Chem. A, 1999, 103, 3554–3561 CrossRef CAS.
- S. Le Caër, G. Vigneron, J. P. Renault and S. Pommeret, Chem. Phys. Lett., 2006, 426, 71–76 CrossRef.
- Y. Sugo, Y. Sasaki and S. Tachimori, Radiochim. Acta, 2002, 90, 161–165 CrossRef CAS.
- I. A. Shkrob, M. C. Sauer and A. D. Trifunac, in Radiation chemistry: present status and future trends, ed. C. D. Jonah and B. S. M. Rao, Elsevier, Amsterdam, 2001, p. 175 Search PubMed.
- R. Joshi, P. N. Pathak, V. K. Manchanda, S. K. Sarkar and T. Mukherjee, Res. Chem. Intermed., 2010, 36, 503–510 CrossRef CAS.
- E. Hayon, T. Ibata, N. N. Lichtin and M. Simic, J. Am. Chem. Soc., 1970, 92, 3898–3903 CrossRef CAS.
- A.-C. Dusaucy, J. De Doncker, C. Couillard, M. De Laet and B. Tilquin, J. Chem. Soc., Faraday Trans. 1, 1987, 83, 125–133 RSC.
- J. C. Mialocq, B. Hickel, G. Baldacchino and M. Juillard, J. Chim. Phys. Phys.-Chim. Biol., 1999, 96, 35–43 CrossRef CAS.
- H. Fricke and E. J. Hart, in Radiation dosimetry, ed. F. H. Attix and W. C. Roesch, Academic Press, New York and London, 2nd edn, 1966, vol. 2, pp. 167–232 Search PubMed.
- W. H. Press, B. P. Flannery, S. A. Teukolsky and W. T. Vetterling, Numerical recipes in C: the art of scientific computing, University Press, Cambridge, 1988–1992 Search PubMed.
- M. J. Frisch, G. W. Trucks, H. B. Schlegel, G. E. Scuseria, M. A. Robb, J. R. Cheeseman, J. Montgomery, J. A. T. Vreven, K. N. Kudin, J. C. Burant, J. M. Millam, S. S. Iyengar, J. Tomasi, V. Barone, B. Mennucci, M. Cossi, G. Scalmani, N. Rega, G. A. Petersson, H. Nakatsuji, M. Hada, M. Ehara, K. Toyota, R. Fukuda, J. Hasegawa, M. Ishida, T. Nakajima, Y. Honda, O. Kitao, H. Nakai, M. Klene, X. Li, J. E. Knox, H. P. Hratchian, J. B. Cross, V. Bakken, C. Adamo, J. Jaramillo, R. Gomperts, R. E. Stratmann, O. Yazyev, A. J. Austin, R. Cammi, C. Pomelli, J. W. Ochterski, P. Y. Ayala, K. Morokuma, G. A. Voth, P. Salvador, J. J. Dannenberg, V. G. Zakrzewski, S. Dapprich, A. D. Daniels, M. C. F. Strain, O. Farkas, D. K. Malick, A. D. Rabuck, K. Raghavachari, J. B. Foresman, J. V. Ortiz, Q. Cui, A. G. Baboul, S. Clifford, J. Cioslowski, B. B. Stefanov, G. Liu, A. Liashenko, P. Pistorz, I. Komaromi, R. L. Martin, D. J. Fox, T. Keith, M. A. Al-Laham, C. Y. Peng, A. Nanayakkara, M. Challacombe, P. M. W. Gill, B. Johnson, W. Chen, M. W. Wong, C. Gonzalez and J. A. Pople, Gaussian 03, Gaussian, Inc., Wallingford, CT, 2004 Search PubMed.
- A. D. Becke, J. Chem. Phys., 1993, 98, 1372–1377 CrossRef CAS.
- P. J. Stephens, F. J. Devlin, C. F. Chabalowski and M. J. Frisch, J. Phys. Chem., 1994, 98, 11623–11627 CrossRef CAS.
- L. A. Curtiss, K. Raghavachari, P. C. Redfern, V. Rassolov and J. A. Pople, J. Chem. Phys., 1998, 109, 7764–7776 CrossRef CAS.
Footnote |
| † Electronic Supplementary Information (ESI) available. See DOI: 10.1039/c2ra01201d/ |
| This journal is © The Royal Society of Chemistry 2012 |
