Fabrication of microparticles with controllable internal woodpile structures for highly efficient sensing applications†‡
Hwan Chul
Jeon§
,
Seul Gi
Han§
,
Sung-Gyu
Park
and
Seung-Man
Yang
*
National CRI Center for Integrated Optofluidic Systems, Department of Chemical and Biomolecular Engineering, KAIST, Daejeon, 305-701, Korea. E-mail: smyang@kaist.ac.kr; Fax: +82 42-350-5962
First published on 27th January 2012
Abstract
Here, we report the fabrication of freestanding three-dimensional (3D) microparticles with internal woodpile structures via prism holographic lithography (HL) and a hot-embossing process. These internal woodpile structures with different reflectance peaks in the microparticles can act as encoded information carriers for multiplex immunoassays. Furthermore, due to the high surface area of the interconnected 3D structures, the HL-featured microparticles exhibited highly enhanced SERS signals, and fast analyte-adsorption binding kinetics coming from the interconnected nanopores that could enhance mass transport of target molecules from the bulk phase to the internal binding sites when they were decorated with silver nanoparticles. These particles overcome the limitation of substrate-based SERS detection methods in which the binding kinetics is slow because of their limited mobility, and these hierarchically-featured 3D porous microparticles could be used for high-sensitivity SERS-based detection. We further obtained a ten-fold increase in fluorescence signal from our HL-derived structures compared with 2D smooth structures. Overall, the designed high-throughput 3D microparticles with internal nanostructures could be used for high-sensitivity SERS or fluorescence based detection in microfluidic devices for biotechnology applications.
Introduction
3D periodic structures fabricated by HL have been used for photonic crystal templates,1–9 superhydrophobic surfaces,10 optofluidic sensing and mixing,11,12 and biomedical applications.13,14 In particular, the creation of 3D photonic crystals (PCs) with a complete photonic band gap (PBG) in the optical frequency regime has proven challenging.15–18 Recently, inverse woodpile structures exhibiting a complete PBG at or near visible wavelengths were realized by combining prism HL and electrodeposition methods.5The detection and analysis of chemical and biological molecules are rapidly increasing in importance in industrial and research fields. As a powerful strategy for sensing applications, surface-enhanced Raman scattering (SERS)—where the enhancement depends on the type, size, roughness and shape of metal nanoparticles and the distance between them19–23—has been developed to acquire more enhanced Raman signals. Extensive studies have been made of 3D SERS substrates in an attempt to exploit the large surface area of 3D structures for the formation of hot spots and binding sites for adsorbed analytes, which result in further improvement of SERS-sensitivity compared with 2D substrates.24–27 However, these substrate-based detection systems suffer from slow binding kinetics in practical applications, because of their limited mobility.
Herein we report the fabrication of freestanding 3D microparticles with internal woodpile structures via prism HL and a hot-embossing process. We show that these particles overcome the limitations of previously reported substrate-based SERS detection methods. The polymer woodpile structures exhibited a high reflectance peak at values ranging from 880 to 1050 nm, depending on the laser exposure dose. Due to the high surface area of the interconnected 3D structures, the HL-derived microparticles showed a ten-fold increase in fluorescence signal compared with 2D smooth particles. Furthermore, the HL-featured microparticles exhibited highly enhanced SERS signals, and fast analyte-adsorption binding kinetics when they were decorated with silver nanoparticles. Overall, the designed high-throughput 3D microparticles with internal nanostructures could be used for high-sensitivity SERS or fluorescence based detection in microfluidic devices.
Experimental
Prism holographic lithography
The optical setup for HL included a He–Cd laser (CW, 325 nm, 50 mW, Kimmon) with a 10× beam expander as a coherent light source. The final spot size was about 1 cm in diameter. An electronic beam shutter was used to control the exposure time. The optical setup of the prism HL has been reported previously.4,10–12 To prepare the SU-8 photoresist (PR), an epoxy-based resin (EPON SU-8, Miller-Stephenson Chemical) and a cationic photo-initiator (PI, triarylsulfonium hexafluorophosphate salts, Aldrich) were dissolved in solvent (γ-butyrolactone (GBL), Sigma-Aldrich). After spin coating the PR solution onto a glass substrate, soft-baking at 95 °C for 20 min was carried out to evaporate the solvent. Next, a normally-incident laser beam was shone through the fused silica top-cut pyramid prism. The laser exposure time was varied from 0.20 to 0.35 s. Post-exposure baking was then performed at 55 °C for 20 min. Finally, unexposed regions were removed by developing in propylene glycol methyl ether acetate (PGMEA, Aldrich) and rinsed with 2-propanol.Preparation of the PDMS templates
SU-8 masters for PDMS templates were made via a conventional photolithography process. SU-8 2 PR (MicroChem) was spin-coated onto a four inch silicon wafer. After spin coating and soft-baking of the SU-8 PR, 365 nm UV light was exposed through the quartz-chrome photomask. Finally, development with PGMEA and washing with 2-propanol were performed. Using the patterned SU-8 substrate as a master, template molds made of transparent elastomer (PDMS 184-A and 184-B, Sylgard) were fabricated by soft lithography. Vaporized hexamethyl disiloxane (HMDS, Aldrich) was deposited on the SU-8 master substrate to form a self-assembled anti-adhesion monolayer. The prepared PDMS solution (PDMS 184-A : PDMS 184-B = 10![[thin space (1/6-em)]](https://www.rsc.org/images/entities/char_2009.gif) :1) was poured onto the SU-8 master with 30 μm dot arrays, and then was cured in a convection oven at 70 °C for 2 h.
:1) was poured onto the SU-8 master with 30 μm dot arrays, and then was cured in a convection oven at 70 °C for 2 h.
Fabrication of the 3D microparticles with internal woodpile structure
Uncrosslinked SU-8 microarrays were fabricated by a direct hot-embossing process using the prepared PDMS templates. First, a sacrificial layer (Omnicoat, MicroChem) was coated on the transparent glass wafer. SU-8 PR (resin : solvent = 6:4 with PI 1 wt% to resin) (which was to be embossed) was spin-coated onto a sacrificial layer pre-coated glass wafer and then soft-baked on a hotplate at 95 °C for 15 min. The hot-embossing process using the prepared PDMS templates was carried out in a vacuum drying oven at 110 °C for 8 h with pressure of 0.1 bar. For fabricating the microarrays with the internal woodpile structure, the same prism HL setup was used. To prepare the free-floating microparticles, the remaining SU-8 PR residual polymeric layer was etched using 13.56 MHz RF reactive ion etching (RIE) equipment (Vacuum Science).10 SF6 gas was introduced into the chamber at a flow rate of 60 sccm, and the base pressure was kept at 0.09 Torr while the RF power was maintained at 80 W in each experiment for 2 min. The pre-coated sacrificial layer was then removed in developer (MF 319, Micro Chem.), for 10 min with sonication.
Fluorescence absorption and protein immobilization
Rhodamine 6G was labeled on the surface of resulting 3D microparticles with internal woodpile patterns for observing enhancement of fluorescent signals. The HL-derived and conventional photolithographic-featured micro-patterned arrays were immersed in ethanolic solution of rhodamine 6G (10−4 M; HPLC grade, Merck). After 1 h of soaking in the solution, the samples were washed several times with ethanol and distilled water. The oxygen plasma was treated on the HL-derived microarrays to make the hydrophilic surface for stable dispersion in solution of PBS buffer solution (Aldrich) in water and DI water. And for surface modification of the 3D microparticles for protein immobilization, the released particles dispersed in 2.5 M H2SO4 (99.9%, Junsei) solution overnight with gentle mixing to open unreacted epoxy groups in SU-8, resulting in forming a lot of hydroxyl groups on the surface. Then the particles were dispersed in ethanol with 1 μM APTMS (Aldrich) for amine functionalization of hydroxyl groups on the surface. After an overnight reaction with stirring, the particles were washed several times with ethanol. And then, FITC-labeled anti-chicken IgG proteins in PBS buffer solution (150 μg ml−1) were incubated for 12 h for immobilization on the amine functionalized microparticles. For an immunoassay experiment, complementary TRITC-labeled anti-goat IgG proteins were hybridized to capture protein goat-IgG which had been initially immobilized on the particle surfaces.Electroless deposition of the silver nanoparticles
3D porous microparticles coated with silver nanoparticles could be obtained by silver deposition on the surface of the resulting SU-8 microparticles via electroless silver deposition. For surface modification of the microparticles, O2 RIE treatment was performed on the microarrays before dissolving the pre-coated sacrificial layer at a flow rate of 100 sccm for 30 s. Next, the resulting released microparticles were dispersed in a 2.5 M H2SO4 (99.9%, Junsei) solution at 65 °C for 30 min to form hydroxyl groups by opening the unreacted epoxy rings, and were then washed with water. Then, to achieve a silver pattern, 10 mL of 0.1 M AgNO3 solution was mixed with 180 μL of ammonia solution (Junsei, min. 28%) to prepare the Tollens' reagent. The resulting solution was diluted with 90 mL of distilled water. The deposition of the silver nanoparticles on the surface of the resulting microparticles was achieved by firstly adding 33 μL of 0.5 M glucose solution and 66 μL of 0.8 M KOH (Junsei, min. 85%) solution to 6 mL of the diluted Tollens' reagent containing the SU-8 microparticles. 50 mL of water was then added to the solution to stop the silver deposition reaction. Finally, the resulting silver-decorated microparticles were washed with water several times.Results and discussion
Fabrication of woodpile structures
We first produced woodpile structures using single prism HL. A fused silica top-cut prism with a square pyramidal frustum shape was employed to generate a five-beam 3D interference pattern. The normally-incident laser beam was split into one central beam of wave vector k0, and four side beams generated through total internal reflection at the four lateral surfaces of the prism, designated by wave vectors k1, k2, k3 and k4. These five beams were recombined at the bottom surface of the prism, which was placed on top of a SU-8 PR substrate. Fig. 1a illustrates the geometrical features of the top-cut prism and the resulting wave vectors. The wave vectors of the five-beam configuration for the woodpile structure can be represented by k0 = 2 π/λ {[0.000 0.000–1.000], k1 = 2 π/λ [0.000 −sinθ −cosθ], k2 = 2 π/λ [−sinθ 0.000 −cosθ], k3 = 2 π/λ [0.000 sinθ −cosθ] and k4 = 2 π/λ [sinθ 0.000 −cosθ]}, where λ is the wavelength of the laser (λ = 325 nm) and θ is the interference angle between the central beam and the four side beams (θ = 41.8°). It is noted here that a woodpile structure with the correct stacking can be obtained using two counter-propagating side beams shifted by π/2 relative to the other beams; this shift can be produced using a prism geometry with different lateral dimensions for two of the sides.5 This structural difference in the prism introduces a phase delay between beams 2 and 4 and beams 1 and 3. Fig. 1b shows the theoretical iso-intensity surface of the 3D interference pattern generated by the five interfering beams with two counter-propagating side beams shifted by π/2 in phase relative to the others. Fig. 1c–e show scanning electron microscopy (SEM) images of the resulting 3D woodpile structures. The 3D woodpile structures revealed by SEM were in good agreement with the simulated structures. As shown in the SEM images, the woodpile structures consisted of more than 40 layers of rods, with a lattice ratio b/a = 1.72. The lattice ratio and the filling fraction of SU-8 materials in the 3D woodpile structures were controlled by varying the laser exposure dose (Table 1). The resulting polymeric woodpile structures exhibited high reflectance (∼55%) peaks ranging from 880 to 1050 nm, corresponding to various exposure times (from 0.20 to 0.35 s, see Fig. 1f). The position of the reflectance peak was red shifted as the filling fraction and lattice ratio increased with exposure time (see Fig. S1, ESI†).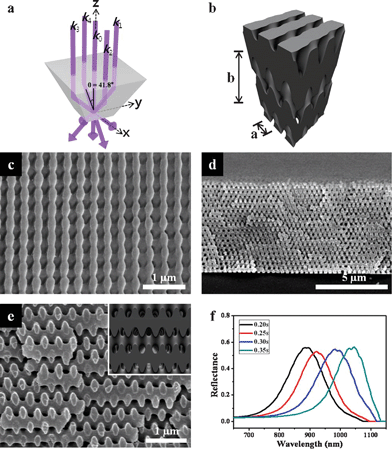 | ||
| Fig. 1 (a) Geometry of the single prism and resulting beam configuration. The central beam (k0) and four side beams (k1–k4) reflected from the side planes form an angle of θ = 41.8°. (b) Simulation image of the woodpile structure using given wave vectors. SEM images of the resulting woodpile structures. (c) Top view, (d) and (e) cross-sectional views. Inset in (e) shows the simulated images. (f) Reflectance spectra of the woodpile structures obtained by varying the laser exposure dose. | ||
| Exposure time/s | Peak position/nm | Filling fraction | b/nm | Lattice ratio (b/a) |
|---|---|---|---|---|
| 0.20 | 882 | 0.50 | 469 | 1.72 |
| 0.25 | 920 | 0.53 | 565 | 1.93 |
| 0.30 | 981 | 0.62 | 622 | 2.20 |
| 0.35 | 1045 | 0.75 | 629 | 2.23 |
Fabrication of 3D microparticles with internal woodpile structures
To fabricate 3D microparticles with an internal woodpile structure, prism HL was combined with a hot-embossing technique (Scheme 1). SU-8 dot arrays with 30 μm diameter were prepared using a photolithography process. The overall shape of the microparticles can be easily modified by designing photomasks with various shapes.28 The fabricated SU-8 dot arrays were used as a master for templating the PDMS mold. In order to transfer the woodpile interference pattern into uncrosslinked embossed microarrays, prism HL was performed by changing the laser exposure time from 0.20 to 0.35 s in 0.05 s increments. The microarrays with internal woodpile structure could be released from the glass substrate by dissolving the pre-coated sacrificial layer. These 3D microparticles with different reflectance peaks can act as encoded information carriers for multiplex immunoassays.29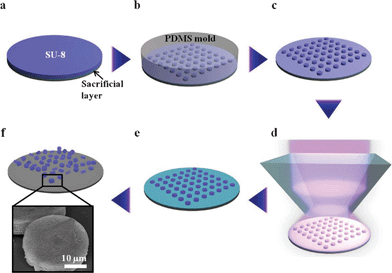 | ||
| Scheme 1 Schematic of the fabrication of 3D microparticles with an internal woodpile structure using hot-embossing and prism holographic lithography. (a) Spin-coating of the SU-8 PR on the pre-coated sacrificial layer. (b) Embossing the photoresist using prepared PDMS mold. (c) Resulting uncrosslinked SU-8 microarrays. (d) Holographic lithography using a single prism. (e) Post-exposure baking and development process. (f) Microparticles with 3D internal woodpile structure released by dissolving the sacrificial layer. | ||
Fig. 2a shows an SEM image of the hot-embossed uncrosslinked SU-8 microarrays using the prepared PDMS mold. Uncrosslinked SU-8 PR was easily embossed at 110 °C, due to the low glass-transition temperature of SU-8 (Tg = ∼50 °C).30Fig. 2b and c clearly indicate that microarrays with internal nanostructures were formed after hot-embossing and prism HL. Before releasing the microarrays from the substrate, the remaining SU-8 thin layer was etched away by SF6 RIE. This was a critical step in ensuring the complete lift-off of the microarrays from the polymeric sacrificial layer. If this step was not used, the residual crosslinked SU-8 thin film connected the isolated microarray patterns, making it difficult to release the microarrays completely. However, we found that SF6 RIE changed the morphology of the 3D microparticles during the etching step. Because of the roughened surface of the woodpile structure, the optical strength decreased from 55% to 41% after the RIE step (see Fig. S2, ESI†). Fig. 2d shows the high number-density (1.4 × 10⁴ particles/cm2), free-standing microparticles with internal nanostructure after the lift-off process.
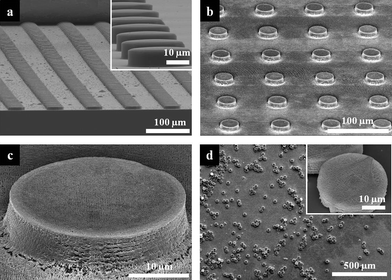 | ||
| Fig. 2 SEM images of the resulting microarrays and microparticles. Tilted view SEM images of large area (a) hot-embossed uncrosslinked SU-8 microarrays and (b) microarrays with internal woodpile structure. Inset in (a) shows magnified 30 μm microarray. (c) SEM image of a single microstructure represented in (b). (d) SEM image of released 3D microparticles with internal woodpile structures. Inset shows magnified view of a single microparticle. | ||
The high surface area in 3D porous particles could be exploited to increase the magnitude of fluorescent signals, which would improve detection efficiency in many applications, but especially those in biomedical research.4Fig. 3a and b show comparative confocal microscopy images with same observation conditions. It's clearly seen that the 3D HL-derived structures exhibit brighter images than the 2D photolithographic arrays. From the comparison of the intensity profiles, we obtained a ten-fold increase in fluorescence signal from our HL-derived structures compared with 2D smooth structures. Furthermore, we conducted a complementary protein-binding immunoassay experiment to demonstrate the structural advantages providing enhanced fluorescence for detection of biomolecules. Fig. 3c and d show the amine functionalized free-standing HL-derived microparticles binding with FITC-labeled anti-chicken IgG and after hybridization of complementary protein TRITC-labeled anti-goat IgG to capture protein goat-IgG located on the surfaces of the microparticles, respectively. As expected, our HL-featured structures with high surface area and well-organized nanopores have shown a good fluorescent-detective probe binding. These results indicate that 3D porous HL-derived microparticles have strong potential for highly sensitive protein chips.
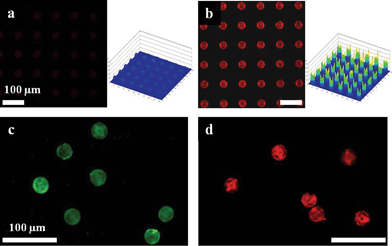 | ||
| Fig. 3 Confocal microscope images of rhodamine 6G labeled (a) 2D and (b) 3D holographically-defined microarrays on the substrate. The graphs show the fluorescence intensity distribution of the microarrays. Confocal microscope images of (c) amine functionalized microparticles with internal woodpile structure bound with FITC-labeled anti-chicken IgG, (d) after hybridization of complementary TRITC-labeled anti-goat IgG. | ||
Fabrication of SERS-sensitive microparitcles
Due to the high surface area of the interconnected 3D structure, the HL-featured microparticles exhibited highly enhanced SERS signals with the deposition of silver nanoparticles. The decoration of the silver nanoparticles on the surfaces of the microparticles was obtained by electroless silver deposition.31–33 Before the silver deposition step, the SU-8 surface was modified by RIE and wet treatment. At first, O2 RIE was performed to change the hydrophilicity of the microarray surfaces that had been achieved through SF6 RIE. The 3D SU-8 surface was actually hydrophobic after SF6 RIE, due to the fluorinated groups created during the etching of the residual SU-8 layer.10,34 This hydrophobicity of the modified SU-8 surface prevented the water-based diluted Tollens' reagent from wetting into the internal porous structure, which in turn prevented the deposition of silver nanoparticles into the porous SU-8 structures. Therefore, changing the SU-8 surface properties using O2 RIE was a crucial step in achieving the decoration with silver nanoparticles. Sulfuric acid treatment was also performed to increase the negative charge of the 3D surface, via generation of hydroxyl groups.4,12,35,36 The electrostatic interaction between the enhanced negatively charged surface and the silver diamine complex in the reaction solution therefore triggered the silver deposition on the surface of resulting microparticle.31 Zeta potential measurements of the dispersed particles were performed to confirm the surface modification of SU-8. Small SU-8 particles with a diameter of 5 μm were prepared for zeta potential measurements. The zeta potential of untreated SU-8 particles was measured to be ca. −25 mV in deionized (DI) water at pH 6.5. After treating the SU-8 particles with sulfuric acid solution, the zeta potential shifted to ca. −36 mV.Fig. 4a and b show silver nanoparticle (with an average size of 67 nm)-decorated microparticles with internal porous structure after the electroless silver deposition. Silver nanoparticles were well deposited in the internal porous structure, but were not fully incorporated into the inner pores because of the wetting problems. We observed in the SEM images that silver aggregates were quite uniformly formed in the top five layers of the woodpile structures. To utilize these hierarchically-structured 3D microparticles for SERS applications, the microparticles were soaked in ethanolic solutions of 2 mM benzenethiol (BT) for 1 h. The Raman signals of BT were then measured in the dried state after washing with ethanol. The red line in Fig. 3c indicates the Raman signals of BT measured from HL-derived microparticles using a 514 nm laser (0.05 mW laser power, 1 μm beam spot, 5 s acquisition time). The characteristic peak positions of BT molecules at 994, 1017, 1071 and 1571 cm−1 are well displayed in the resulting spectra. The density of aggregated silver nanoparticles could be easily controlled by varying the silver deposition time. For SERS applications, controlling nanoparticle density is critical because nanogaps between metal nanoparticles act as hot spots that can provide highly enhanced SERS activity.37–41 As the silver deposition time increased, more aggregations of silver nanoparticles were formed. Finally, a thin silver film covered the top surface. As expected, the intensities of the SERS peaks decreased with increasing silver deposition time (see Fig. S3, ESI†).
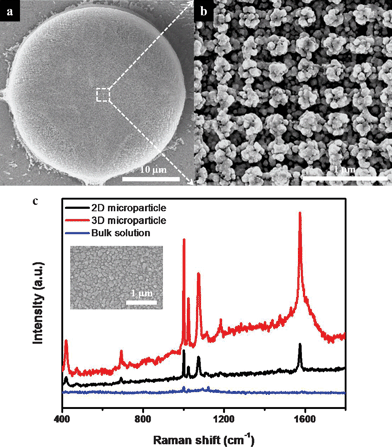 | ||
| Fig. 4 (a) SEM image of a 3D microparticle decorated with aggregated silver nanoparticles and (b) its magnified image. (c) SERS spectra of BT on the silver-decorated 2D, 3D microparticles and bare glass substrate as the reference. Data acquisition was the result of 5 s accumulation. The laser powers on microparticles and bulk solution were 0.05 mW and 2.5 mW, respectively. Inset shows an SEM image of a 2D microparticle with aggregated silver nanoparticles. | ||
To make a comparison with the SERS activity of 2D microparticles, arrays of same-sized dots were prepared. 3D porous microparticles exhibited a three-fold increase in Raman intensity over 2D microparticles (Fig. 4c). The 3D microparticles provided a much higher surface area (compared with 2D particles) for the formation of both hot spots that can supply the strongest local electromagnetic field, and binding sites for target analytes (Inset of Fig. 4c). These combined effects led to the observed enhanced SERS signal intensity.24–27 Furthermore, if the reflectance peak of PC microparticles could be matched with peaks in the SERS spectra of target molecules, it would be possible to obtain yet more enhancement in the Raman signals.42
The Raman enhancement factor (EF) at 994 cm−1 could be calculated using the following equation and a reference sample (based on the spectra with red and blue color in Fig. 4c):
| EF = ISERS/IRef × NRef/NSERS |
3D microparticles enhance mass transport of target molecules from the bulk phase to the internal binding sites through interconnected nanopores.4 As a result, the binding time of the target molecules on the silver nanoparticles should be short. This should also be attributed to the high mobility of the HL-featured microparticles. After just 10 min of immersion, the SERS signal intensities became saturated, and maintained high enhancement. We could even detect the Raman signals for BT from suspended HL-derived microparticles in ethanol at a short integration time of 1 s after 100 min immersion time (see Fig. S4, ESI†). These results suggest that hierarchically-featured 3D porous microparticles could be used for real-time molecular detection via flowing into microfluidic channels.
Conclusions
In summary, we have demonstrated the fabrication of woodpile PC films and free-standing 3D porous microparticles with internal woodpile structures via prism HL and a hot-embossing process. The reflectance peaks of the woodpile structures were tuned by controlling the filling fraction and lattice constant. Due to the high surface area of the interconnected 3D structures, the fluorescence intensity signals from our HL-featured structures were intensified and as large as ten times of those from 2D structures. Furthermore, the HL-derived microparticles exhibited highly enhanced SERS signals, with fast binding kinetics when deposited with silver nanoparticles. Finally, the designed high-throughput 3D microparticles with internal nanostructures could be used for high-sensitivity SERS- or fluorescence-based detection in microfluidic devices for biotechnology applications.Acknowledgements
This work was supported by a grant from the Creative Research Initiative Program of the Ministry of Education, Science and Technology for “Complementary Hybridization of Optical and Fluidic Devices for Integrated Optofluidic Systems.” Partial support from the Brain Korea 21 Program is also appreciated.References
- J. H. Moon, Y. G. Xu, Y. P. Dan, S. M. Yang, A. T. Johnson and S. Yang, Adv. Mater., 2007, 19, 15101 Search PubMed.
- L. J. Wu, Y. C. Zhong, C. T. Chan, K. S. Wong and G. P. Wang, Appl. Phys. Lett., 2005, 86, 241102 CrossRef.
- D. Xu, K. P. Chen, A. Harb, D. Rodriguez, K. Lozano and Y. K. Lin, Appl. Phys. Lett., 2009, 94, 231116 CrossRef.
- A. S. K. Lee, H. S. Park, G. R. Yi, J. H. Moon and S. M. Yang, Angew. Chem. Int. Ed., 2009, 48, 7000 CrossRef.
- S. G. Park, M. Miyake, S. M. Yang and P. V. Braun, Adv. Mater., 2011, 23, 2749 CrossRef CAS.
- M. Campbell, D. N. Sharp, M. T. Harrison, R. G. Denning and A. J. Turberfield, Nature, 2000, 404, 53 CrossRef CAS.
- J. H. Moon, J. Ford and S. Yang, Polym. Adv. Technol., 2006, 17, 83 CrossRef CAS.
- S. Yang, M. Megens, J. Aizenberg, P. Wiltzius, P. Chaikin and W. Russel, Chem. Mater., 2002, 14, 2831 CrossRef CAS.
- J. H. Moon and S. Yang, Chem. Rev., 2010, 110, 547 CrossRef CAS.
- S. G. Park, H. H. Moon, S. K. Lee, J. Shim and S. M. Yang, Langmuir, 2010, 26, 1468 CrossRef CAS.
- S. K. Lee, S. G. Park, J. H. Moon and S. M. Yang, Lab Chip, 2008, 8, 388 RSC.
- S. G. Park, S. K. Lee, J. H. Moon and S. M. Yang, Lab Chip, 2009, 9, 3144 RSC.
- S. Singamaneni, E. Kharlampieva, J. H. Jang, M. E. McConney, H. Jiang, T. J. Bunning, E. L. Thomas and V. V. Tsukruk, Adv. Mater., 2010, 22, 1369 CAS.
- J. H. Jang, S. J. Jhaveri, B. Rasin, C. Koh, C. K. Ober and E. L. Thomas, Nano Lett., 2008, 8, 1456 CrossRef CAS.
- E. Yablonovitch, Phys. Rev. Lett., 1987, 58, 2059 CrossRef CAS.
- S. John, Phys. Rev. Lett., 1987, 58, 2486 CrossRef CAS.
- K. M. Ho, C. T. Chan and C. M. Soukoulis, Phys. Rev. Lett., 1990, 65, 3152 CrossRef CAS.
- M. Maldovan and E. L. Thomas, Nat. Mater., 2004, 3, 593 CrossRef CAS.
- C. L. Haynes, A. D. McFarland and R. P. Van Duyne, Anal. Chem., 2005, 77, 338a CrossRef CAS.
- S. M. Nie and S. R. Emery, Science, 1997, 275, 1102 CrossRef CAS.
- M. Moskovits, Rev. Mod. Phys., 1985, 57, 783 CrossRef CAS.
- H. Xu, E. J. Bjerneld, M. Käll and L. Börjesson, Phys. Rev. Lett., 1999, 83, 4357 CrossRef CAS.
- Z. M. Chen, T. Gang, X. Yan, X. Li, J. H. Zhang, Y. F. Wang, X. Chen, Z. Q. Sun, K. Zhang, B. Zhao and B. Yang, Adv. Mater., 2006, 18, 924 CrossRef CAS.
- Y. H. Sun, K. Liu, J. Miao, Z. Y. Wang, B. Z. Tian, L. N. Zhang, Q. Q. Li, S. S. Fan and K. L. Jiang, Nano Lett., 2010, 10, 1747 CrossRef CAS.
- H. Ko, S. Singamaneni and V. V. Tsukruk, Small, 2008, 4, 1576 CrossRef CAS.
- H. Ko and V. V. Tsukruk, Small, 2008, 4, 1980 CrossRef CAS.
- N. Ji, W. D. Ruan, C. X. Wang, Z. C. Lu and B. Zhao, Langmuir, 2009, 25, 11869 CrossRef CAS.
- S. Y. Lee, S. H. Kim, C. J. Heo, H. Hwang and S. M. Yang, Phys. Chem. Chem. Phys., 2010, 12, 11861 RSC.
- Y. J. Zhao, X. W. Zhao, J. Hu, M. Xu, W. J. Zhao, L. G. Sun, C. Zhu, H. Xu and Z. Z. Gu, Adv. Mater., 2009, 21, 569 CrossRef CAS.
- A. del Campo and C. Greiner, J. Micromech. Microeng., 2007, 17, R81 CrossRef CAS.
- J. H. Zhang, J. B. Liu, S. Z. Wang, P. Zhan, Z. L. Wang and N. B. Ming, Adv. Funct. Mater., 2004, 14, 1089 CrossRef CAS.
- H. Hwang, S. H. Kim and S. M. Yang, Lab Chip, 2011, 11, 87 RSC.
- S. G. Jang, S. Y. Lee, D. G. Choi, C. J. Heo and S. M. Yang, Adv. Mater., 2008, 20, 4862 CrossRef CAS.
- J. Ge and J. K. Kivilahti, J. Appl. Phys., 2002, 92, 3007 CrossRef CAS.
- J. H. Moon, A. J. Kim, J. C. Crocker and S. Yang, Adv. Mater., 2007, 19, 2508 CrossRef CAS.
- S. L. Tao, K. Popat and T. A. Desai, Nat. Protoc., 2006, 1, 3153 CrossRef CAS.
- Y. Yokota, K. Ueno and H. Misawa, Chem. Commun., 2011, 47, 3505 RSC.
- S. J. Lee, Z. Q. Guan, H. X. Xu and M. Moskovits, J. Phys. Chem. C, 2007, 111, 17985 CAS.
- D. K. Hwang, H. Noh, H. Cao and R. P. H. Chang, Appl. Phys. Lett., 2009, 95, 091101 CrossRef.
- J. P. Camden, J. A. Dieringer, Y. M. Wang, D. J. Masiello, L. D. Marks, G. C. Schatz and R. P. Van Duyne, J. Am. Chem. Soc., 2008, 130, 12616 CrossRef CAS.
- S. J. Lee, A. R. Morrill and M. Moskovits, J. Am. Chem. Soc., 2006, 128, 2200 CrossRef CAS.
- C. Y. Wu, C. C. Huang, J. S. Jhang, A. C. Liu, C. C. Chiang, M. L. Hsieh, P. J. Huang, D. T. Le, Q. M. Le, T. S. Yang, L. K. Chau, H. C. Kan and C. C. Hsu, Opt. Express, 2009, 17, 21522 CrossRef CAS.
- L. J. Wan, M. Terashima, H. Noda and M. Osawa, J. Phys. Chem. B, 2000, 104, 3563 CrossRef CAS.
- Q. M. Yu, P. Guan, D. Qin, G. Golden and P. M. Wallace, Nano Lett., 2008, 8, 1923 CrossRef CAS.
Footnotes |
| † Electronic Supplementary Information (ESI) available: SEM images of woodpile structures with various laser exposure times and silver-decorated microparticles according to the silver deposition time; SERS spectra of molecule-adsorbed silver-decorated microparticles according to the silver deposition time and immersion time of microparticles. See DOI: 10.1039/c2ra00806h/ |
| ‡ Characterization: The morphologies of the surface and cross-section of the samples were investigated using a field emission-scanning electron microscope (Hitachi S-4800). The optical properties of the 3D woodpile structures were analyzed using a home-made visible-to-near-infrared spectroscopy setup for the 400–1600 nm range. The fluorescence images were captured on a laser scanning confocal microscope (Carl Zeiss Inc., LSM510) using a 543 nm HeNe laser. The Raman spectra were measured using a high-resolution dispersive Raman microscope (Horiba Jobin Yvon, LabRAM HR UV/Vis/NIR), in which a 514 nm laser with a power of 0.05 mW was focused on the sample surface, which has a diameter of 1 μm. |
| § These authors contributed equally to this project. |
| This journal is © The Royal Society of Chemistry 2012 |