Facile fabrication of graphene devices through metalloporphyrin induced photocatalytic reduction†
Mrunal A.
Khaderbad‡
a,
Verawati
Tjoa‡
bc,
Than Z.
Oo
b,
Jun
Wei
c,
Madhu
Sheri
d,
Ravikanth
Mangalampalli
d,
V. Ramgopal
Rao
*a,
Subodh G.
Mhaisalkar
b and
Nripan
Mathews
*b
aCentre for Excellence in Nanoelectronics, IIT Bombay, Mumbai, 400076, Maharashtra, India. E-mail: rrao@ee.iitb.ac.in; Tel: (+91)-22-25767456
bSchool of Materials Science and Engineering, Nanyang Technological University, Block N4.1, 639798, Singapore. E-mail: Nripan@ntu.edu.sg; Fax: (+65)6790 9081; Tel: (+65)6790 4626
cSingapore Institute of Manufacturing Technology, Tower Block Lv5, 638075, Singapore
dDepartment of Chemistry, IIT Bombay, Mumbai, 400076, Maharashtra, India
First published on 19th March 2012
Abstract
Solution processed graphene oxide (GO) sheets are electronically insulating and are generally reduced by chemical treatment or heat treatment in a reducing environment to recover their electronic properties, forming reduced graphene oxide (rGO). Here, GO sheets were photocatalytically reduced using 5-(4-hydroxyphenyl)-10,15,20-tri(p-tolyl) zinc(II) porphyrin (Zn(II)TTPOH) under ambient conditions. After illumination in the presence of a hole scavenger and Zn(II)TTPOH, the formation of rGO was confirmed through optical absorption measurements and monitoring of the D/G peak ratios from Raman measurements. The resultant rGO formed stable aqueous suspensions with the Zn(II)TTPOH. The electron transfer from photoexcited porphyrin to GO was studied through photoluminescence measurements. Utilising this photoreduction process as a post processing strategy, an increase in conductivity and an ambipolar field effect transistor (FET) behaviour were demonstrated on prepatterned GO devices. We have also confirmed the photoreduction process at low energy wavelengths (588 nm), indicating the versatility of using metalloporphyrins as photocatalysts for graphene oxide reduction.
1. Introduction
The discovery of 2D graphene has sparked excitement in scientific circles owing to its electronic properties including high ambipolar mobility, low Johnson noise as well as anomalous quantum Hall effects.1–3 Various applications for graphene such as ultra-sensitive gas sensors, flexible electronics as well as transparent electrodes in solar cells have been successfully demonstrated.4–7 Reported methods of graphene production include mechanical cleavage of graphite,1 chemical vapor deposition (CVD),8 ultrahigh vacuum (UHV) annealing of SiC,9 as well as chemical exfoliation of graphite sheet which results in a high yield dispersion of graphene oxide (GO) in water.10–12 The electronically insulating GO is generally reduced by chemical or heat treatment in a reducing environment to recover the electronic properties, forming reduced graphene oxide (rGO).12,13 Unfortunately, chemical treatment which usually involves hydrazine is not environmentally friendly, while high temperature reduction is incompatible with plastic substrates. In addition, reduced graphene produced in suspension often aggregates due to van der Waals interaction. Other milder methods of GO reduction such as photo reduction are thus under focus. Kamat et al. have demonstrated UV photocatalytic reduction of GO by attaching TiO2 nanoparticles while Akhavan et al., have employed hybridized ZnO nanoparticles for the same.14–16 These previous experiments have demonstrated that GO reduction is possible through the injection of electrons to the damaged graphene lattice.Organic molecules such as porphyrins are another category of materials that display excellent photoactive properties. Porphyrins are aromatic conjugated macrocycles with 18 π-electrons which can bind to many metals to form metalloporphyrins.17 They are soluble in common organic solvents and can also be made water soluble to address large-scale device fabrication needs.18 The absorption properties of the porphyrin can be tuned by inserting the appropriate metal in the porphyrin cavity.19 Owing to these excellent properties, metalloporphyrins and their analogues are of interest in dye sensitized solar cells and photo detector applications.20,21 Furthermore, the photocatalytic properties of porphyrins have been effectively used in the reduction of CO2 to formic acid, dioxygen to hydrogen peroxide as well as water splitting.22–24 In addition, the robustness of porphyrins has been demonstrated under back-end-of-line (BEOL) processing conditions where they can be used to tune the metal-gate work function.25
In this report we present a novel method of reducing GO by utilizing 5-(4-hydroxyphenyl)-10,15,20-tri(p-tolyl) zinc(II) porphyrin (Zn(II)TTPOH) in an ambient environment at room temperature. The procedure involves treating GO (either in suspension or on a substrate) to a solution containing metalloporphyrin and ethanolamine followed by illumination. This approach offers a facile way for GO reduction without high temperature heat treatment or toxic chemicals. The wide variety of porphyrin derivatives lends flexibility in solvent selection as well as spectral sensitivity. Incorporation of the porphyrin based photoreduction in the device fabrication process is also demonstrated, indicating a route towards large-scale, site specific functionalization as well as the reduction of GO. In addition, the porphyrins also act as a stabilizing agent and the resultant rGO suspension is stable in organic solvent for many weeks. The progress of the reduction is monitored through optical absorption measurements and was confirmed by Raman measurements and electrical measurement on single layer GO sheet. To the best of our knowledge, this is the first report on non-UV photocatalytic reduction of GO by organic compounds.
2. Experimental
2.1 Synthesis of graphene and Zn-porphyrin
Graphene oxide was synthesized using a modified Hummers' method which has been described elsewhere.11 The mono-hydroxy functionalized porphyrin (TTPOH) was synthesized by the condensation of p-hydroxy benzaldehyde, p-tolualdehyde and pyrrole in 1![[thin space (1/6-em)]](https://www.rsc.org/images/entities/char_2009.gif) :
:![[thin space (1/6-em)]](https://www.rsc.org/images/entities/char_2009.gif) 3
3![[thin space (1/6-em)]](https://www.rsc.org/images/entities/char_2009.gif) :
:![[thin space (1/6-em)]](https://www.rsc.org/images/entities/char_2009.gif) 4 ratio refluxing at 100–110 °C in propionic acid for 3 h, the propionic acid was then removed by vacuum distillation. Thin layer chromatography analysis of the crude product showed six spots corresponding to tetratolyl, mono-hydroxy, (cis/trans)dihydroxy, trihydroxy and tetrahydroxy porphyrins. The mixture was subjected to silica gel column chromatography to afford pure 5-(4-hydroxyphenyl)-10,15,20-tri(p-tolyl) porphyrin as a second band, which upon treatment with Zn(OAc)2·4H2O in CHCl3/CH3OH followed by column chromatographic purification on silica gel results in pure Zn(II)TTPOH.
4 ratio refluxing at 100–110 °C in propionic acid for 3 h, the propionic acid was then removed by vacuum distillation. Thin layer chromatography analysis of the crude product showed six spots corresponding to tetratolyl, mono-hydroxy, (cis/trans)dihydroxy, trihydroxy and tetrahydroxy porphyrins. The mixture was subjected to silica gel column chromatography to afford pure 5-(4-hydroxyphenyl)-10,15,20-tri(p-tolyl) porphyrin as a second band, which upon treatment with Zn(OAc)2·4H2O in CHCl3/CH3OH followed by column chromatographic purification on silica gel results in pure Zn(II)TTPOH.
2.2 Photoreduction
In a clear bottle, a mixture of 5 mL of GO (0.1 mg mL−1) in water, 5 mL of Zn(II)TTPOH in an IPA solution (0.05 mg mL−1) and 1 mL of ethanolamine were stirred together. The mixture was illuminated by a broad wavelength spectrum (Philips 100 W incandescent bulb) at room temperature with a distance of 45 cm from the light source. The intensity measured was 80 mW cm−2. Optical characterization was performed on samples prepared at various photoreduction times.2.3 Device fabrication
For electronic measurement, the GO sheet was first deposited on the Si/SiO2 substrate. Briefly, silicon with 50 nm SiO2 were plasma cleaned and modified with Aminopropyl Trichloroethoxysilane (APTES, Sigma Aldrich, 99%). The substrate was then immersed in a GO solution and rinsed thoroughly, resulting in a monolayer of graphene oxide being deposited on the surface. Then the substrate was coated by electron beam resist (poly(methyl methacrylate) (PMMA)—Microchem corp, A3). E-beam lithography (30 KeV, dose is 410 uC cm−2) was used to define the electrodes which were formed through sputtering with platinum metal. The channel dimensions were 2 μm by 15 μm. Subsequently, the substrate was immersed in a bottle containing Zn(II)TTPOH in IPA (0.05 mg mL−1) and ethanolamine and illuminated. Schematic and the SEM image of the device are shown in Fig. SI3.†2.4 Characterization
The Raman spectra were recorded by WITec CRM200 (wavelength 488 nm, spot size ∼0.5 μm) and the Si peak at 520 cm−1 was used as a reference for wavenumber calibration. UV-Vis absorption spectra were recorded by Shimadzu, UV-3600, spectrophotometer. Photo luminescence characterization was done by Horiba Jobin Yvon FL-1057 spectrofluorometer. Electrical measurements were done with Keithley 4200 on a probe station (TTP-6, Desert Cryogenic) under ambient temperature and vacuum in both transistor and resistor configurations.3. Results and discussion
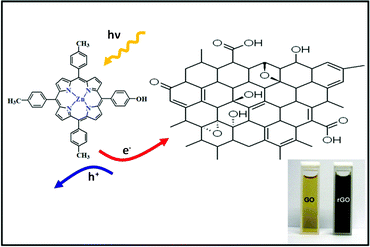
In a typical experiment, the GO and Zinc porphyrins (Zn(II)TTPOH) are homogenously mixed in a water-IPA-ethanolamine mixture and subjected to steady state illumination. The reduction process is illustrated in Fig. 1, following these equations: | (1) |
 | (2) |
 | (3) |
 | ||
| Fig. 1 Zn(II)TTPOH and GO composite and the schematic diagram of photocatalytic reduction under illumination, which involve electron—hole pair generation. Inset shows GO before and rGO after reduction. | ||
The porphyrin molecule is excited and generates an electron hole pair upon illumination (eqn (1)). The electron is then transferred to GO sheet (eqn (2)), resulting in the reduction of oxygen functional group on the sheet. The hole, on the other hand, is transferred to ethanolamine which acts as hole acceptor and is oxidized (eqn (3)).26,27 An apparent colour change of the GO solution from light yellow to black was observed due to the progressive formation of rGO under photocatalytic reduction (inset of Fig. 1). Electron transfer reaction between carbon nanostructures and non-covalently bonded porphyrins is known to be mediated by strong chemical interaction.28 The significant π–π interaction between porphyrins and carbon nanostructures has been employed in carbon nanotube (CNT) dispersion, semiconducting nanotube separation as well as in photovoltaic devices.29–31 Reports on non-covalent porphyrin-graphene interaction are limited- Kamat et al. have shown that a strong interactive affinity between porphyrin and rGO exists both in solution as well as in films and have demonstrated photoinduced electron transfer.32
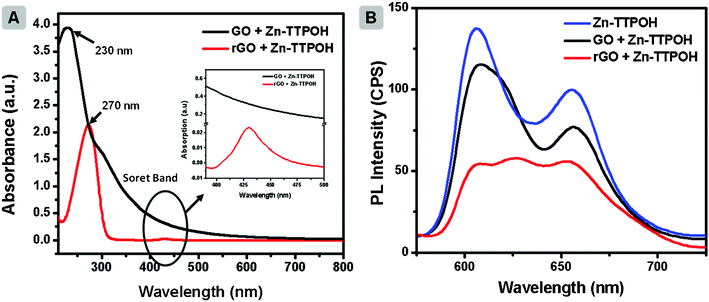
Fig. 2a illustrates the UV-Vis absorption spectrum of GO (black line). The spectrum has a peak around 230 nm, originating from the π→π* plasmon of C![[double bond, length as m-dash]](https://www.rsc.org/images/entities/char_e001.gif) C and a shoulder near 300 nm due to n→π* transition of the C
C and a shoulder near 300 nm due to n→π* transition of the C![[double bond, length as m-dash]](https://www.rsc.org/images/entities/char_e001.gif) O bond. After photocatalytic reduction of GO, red shifts in the plasmon peak (∼270 nm, red line, Fig. 2a) was observed. The shift is attributed to the restoration of the electronic conjugation within the graphene oxide sheets and structural ordering.33 In addition, the transfer of electrons from the porphyrin molecules to graphene can be monitored through photoluminescence (PL) measurements.32Fig. 2b depicts the PL spectrum of Zn(II)TTPOH showing its characteristic emission peaks at 610 and 660 nm. A ∼10% reduction in the peaks can be observed upon addition of the GO solution (300 μL of GO (0.1 mg mL−1) to 3 mL of Zn(II)TTPOH). After an hour of illumination during which photoreduction occurs, the quenching in PL intensity of GO + Zn(II)TTPOH is even higher, reaching 60%. The PL intensity of Zn(II)TTPOH did not change after 1 h of continuous illumination indicating the stability of the porphyrin molecules (data not shown). This clearly shows that the electron transfer between the excited porphyrin and GO sheet is indeed responsible for the reduction process. Additionally, as control experiments we prepared reaction mixtures containing GO, IPA and ethanolamine followed by illumination under similar conditions. In the absence of metalloporphyrins, no reduction was detected. Although IPA can also act as an electron donor/hole scavenger, the addition of ethanolamine was necessary for reduction to proceed efficiently.
O bond. After photocatalytic reduction of GO, red shifts in the plasmon peak (∼270 nm, red line, Fig. 2a) was observed. The shift is attributed to the restoration of the electronic conjugation within the graphene oxide sheets and structural ordering.33 In addition, the transfer of electrons from the porphyrin molecules to graphene can be monitored through photoluminescence (PL) measurements.32Fig. 2b depicts the PL spectrum of Zn(II)TTPOH showing its characteristic emission peaks at 610 and 660 nm. A ∼10% reduction in the peaks can be observed upon addition of the GO solution (300 μL of GO (0.1 mg mL−1) to 3 mL of Zn(II)TTPOH). After an hour of illumination during which photoreduction occurs, the quenching in PL intensity of GO + Zn(II)TTPOH is even higher, reaching 60%. The PL intensity of Zn(II)TTPOH did not change after 1 h of continuous illumination indicating the stability of the porphyrin molecules (data not shown). This clearly shows that the electron transfer between the excited porphyrin and GO sheet is indeed responsible for the reduction process. Additionally, as control experiments we prepared reaction mixtures containing GO, IPA and ethanolamine followed by illumination under similar conditions. In the absence of metalloporphyrins, no reduction was detected. Although IPA can also act as an electron donor/hole scavenger, the addition of ethanolamine was necessary for reduction to proceed efficiently.
 | ||
| Fig. 2 (A) UV absorption of GO + Zn(II)TTPOH and rGO + Zn(II)TTPOH in IPA. Concentration of Zn(II)TTPOH is 0.25 mg mL−1 for all the samples. (B) Photoluminescence spectroscopy of Zn(II)TTPOH, GO + Zn(II)TTPOH and rGO + Zn(II)TTPOH after 1 h of light illumination. Excitation wavelength is 380 nm. In the above experiment 300 μL of GO (0.1 mg mL−1) was added to 3 mL of Zn(II)TTPOH solution. | ||
A photoinduced electron transfer has also been used to explain photoreduction in graphene oxide layers grafted with ZnO and TiO2 nanoparticles. In contrast to these large bandgap semiconductors, the Zn porphyrins have a wide absorption range which extends in to the visible light region (refer to Fig. SI1†). The UV-Vis spectra of Zn(II)TTPOH display the typical Soret band around 420 nm, which originates from transition of a1u(π)–eg* (π) and the Q-bands with absorption maxima around 550 and 593 nm, corresponding to a2u(π)–eg* (π) transitions. In order to confirm the possibility of photoreduction process at low energy wavelengths, the GO-porphyrin blend solution was exposed to yellow light illumination (588 nm diffused yellow LED, RoHS 247–1814, 50 mW). The photoreduction was confirmed by the red-shift in UV-vis spectra as shown in the ESI, Fig. SI2.†
Although the illumination times were longer due to the low power of the LEDs used, this experiment shows that visible light reduction of GO using porphyrins is possible.
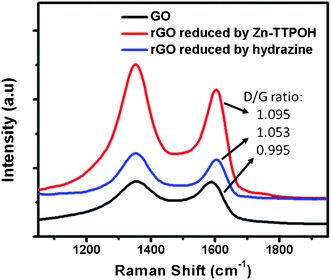
The formation of rGO was also monitored through Raman spectroscopy which is widely used to obtain structural information, defects, disorder and doping in graphene and graphene-related materials.34 The usual features in the Raman spectra of graphene-based materials are the G band which is related to optical E2g phonons of sp2 carbon atoms and the D band which corresponds to the breathing mode of sp2 atoms in rings and is also a sign of local defects and disorder.35 Hence, an increase in the D-peak intensity or even the intensity ratio of D band to G band can be monitored to study the formation of reduced graphene oxide. Fig. 3 shows the Raman spectra of GO, rGO + Zn(II)TTPOH (3 h reduction) and rGO without Zn(II)TTPOH (reduced by hydrazine treatment for 2 h at 140 °C). The Raman spectra show peaks around 1352 cm−1 and 1600 cm−1 coinciding with the first-order D and G peaks. While the D/G ratio for GO was found to be ∼0.995 and after photocatalytic reduction using Zn(II)TTPOH, an enhanced D peak as compared to the G peak (D/G ratio ∼1.095) can clearly be observed, which confirms the reduction of graphene oxide.13 As a comparison, the rGO reduced by hydrazine gave a D/G ratio of 1.053.
 | ||
| Fig. 3 Raman characterization of GO, rGO reduced by Zn(II)TTPOH and rGO reduced by hydrazine treatment. Samples prepared by dropcasting. | ||
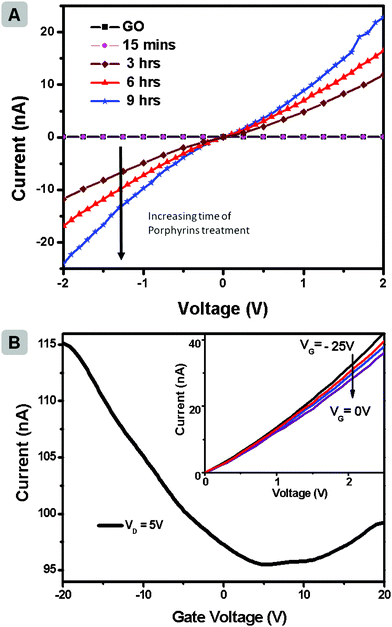
After having confirmed the formation of rGO through photoreduction, the possibility of employing the strategy in a device configuration as a post-processing strategy was explored. The schematic of device fabrication and GO reduction is provided in the ESI. Fig. SI3.† For this investigation, bottom-gate FET structures (50 nm silicon oxide as dielectric) of single layer GO were measured in vacuum and room temperature. Details of the device fabrication are presented in experimental section. The electrically insulating GO showed very high resistance in a two-terminal measurement (R ∼ 8 × 10¹¹ Ω). The substrates were then dipped in a solution of Zn(II)TTPOH in IPA (0.05 mg mL−1). Ethanolamine was added to the solution and the setup was irradiated with light for different time periods. After photocatalytic reduction in ambient conditions with Zn(II)TTPOH, it showed a remarkable increase in conductivity (R∼1.9 × 10⁸ Ω after 3 h illumination). The conductivity is found to keep increasing with reduction time.
Fig. 4a shows the current–voltage characteristic for GO and its respective reduction by Zn(II)TTPOH at increasing time. The transfer characteristic (Fig. 4b) shows ambipolar behaviour of the device after 9 h reduction. The output characteristic of the same device in inset of Fig. 4b shows gate dependency from −25 V to 0 V. The ability of porphyrin to act as a reducing agent for GO on a substrate offers the possibility of patterning graphene transistors through inkjet deposition of porphyrin in selected areas. In addition, we observed similar photoreduction capability with other porphyrin systems, such as metalloporphyrins of Ni, Mg, Cu and Co (ESI, Fig. SI4† shows colour change of GO and Ni porphyrin mixture from yellow GO solution to black rGO solution, before and after illumination).
 | ||
| Fig. 4 (a) Current–voltage characteristic for GO and GO reduced with Zn(II)TTPOH measured at different reduction times (b) Transfer characteristics of a rGO device under 9 h reduction with Zn(II)TTPOH; drain voltage is fixed at 5 V to ensure sufficient current collected. Inset shows its output characteristics. | ||
4. Conclusions
In summary, we have demonstrated a simple photocatalytic reduction technique of graphene oxide, done under visible light by using Zn(II)TTPOH under ambient conditions. Under illumination, the Zn(II)TTPOH injects electrons into the GO, reducing it. Raman, UV-Vis and electrical characterization confirmed the formation of rGO. The resultant rGO solution is stable in aqueous conditions for a few weeks. In addition to reduction in solution, a post deposition protocol for forming reduced graphene oxide layers on substrates was also demonstrated. This process offers a new versatile procedure for facilely fabricating reduced graphene oxide under mild conditions.Acknowledgements
The authors would like to thank Prof. Xiong Qi Hua for the access in electron beam lithography. This project was partially supported by A *STAR, Project #102 170 0138.References
- K. S. Novoselov, A. K. Geim, S. V. Morozov, D. Jiang, Y. Zhang, S. V. Dubonos, I. V. Grigorieva and A. A. Firsov, Science, 2004, 306, 666–669 CrossRef CAS.
- M. J. Allen, V. C. Tung and R. B. Kaner, Chem. Rev., 2010, 110, 132–145 CrossRef CAS.
- J. C. Meyer, A. K. Geim, M. I. Katsnelson, K. S. Novoselov, T. J. Booth and S. Roth, Nature, 2007, 446, 60–63 CrossRef CAS.
- F. Schedin, A. K. Geim, S. V. Morozov, E. W. Hill, P. Blake, M. I. Katsnelson and K. S. Novoselov, Nat. Mater., 2007, 6, 652–655 CrossRef CAS.
- J. S. Bunch, S. S. Verbridge, J. S. Alden, A. M. van der Zande, J. M. Parpia, H. G. Craighead and P. L. McEuen, Nano Lett., 2008, 8, 2458–2462 CrossRef CAS.
- K. S. Kim, Y. Zhao, H. Jang, S. Y. Lee, J. M. Kim, K. S. Kim, J.-H. Ahn, P. Kim, J.-Y. Choi and B. H. Hong, Nature, 2009, 457, 706–710 CrossRef CAS.
- N. Tombros, C. Jozsa, M. Popinciuc, H. T. Jonkman and B. J. van Wees, Nature, 2007, 448, 571–574 CrossRef CAS.
- K. P. Loh, Q. Bao, P. K. Ang and J. Yang, J. Mater. Chem., 2010, 20, 2277–2289 RSC.
- A. Reina, X. Jia, J. Ho, D. Nezich, H. Son, V. Bulovic, M. S. Dresselhaus and J. Kong, Nano Lett., 2009, 9, 30–35 CrossRef CAS.
- V. Tjoa, W. Jun, V. Dravid, S. Mhaisalkar and N. Mathews, J. Mater. Chem., 2011, 21, 15593–15599 RSC.
- W. S. Hummers and R. E. Offeman, J. Am. Chem. Soc., 1958, 80, 1339–1339 CrossRef CAS.
- G. Eda, G. Fanchini and M. Chhowalla, Nat. Nanotechnol., 2008, 3, 270–274 CrossRef CAS.
- S. Stankovich, D. A. Dikin, R. D. Piner, K. A. Kohlhaas, A. Kleinhammes, Y. Jia, Y. Wu, S. T. Nguyen and R. S. Ruoff, Carbon, 2007, 45, 1558–1565 CrossRef CAS.
- O. Akhavan, Carbon, 2011, 49, 11–18 CrossRef CAS.
- G. Williams and P. V. Kamat, Langmuir, 2009, 25, 13869–13873 CrossRef CAS.
- G. Williams, B. Seger and P. V. Kamat, ACS Nano, 2008, 2, 1487–1491 CrossRef CAS.
- I. Gupta and M. Ravikanth, Coord. Chem. Rev., 2006, 250, 468–518 CrossRef CAS.
- D. Brault and M. Rougee, Biochemistry, 1974, 13, 4591–4597 CrossRef CAS.
- P. C. Ray, P. Bonifassi and J. Leszczynski, J. Phys. Chem. A, 2008, 112, 2870–2879 CrossRef CAS.
- A. Kay and M. Grätzel, Sol. Energy Mater. Sol. Cells, 1996, 44, 99–117 CrossRef CAS.
- M. R. Wasielewski, Chem. Rev., 1992, 92, 435–461 CrossRef CAS.
- D. Schaming, C. Costa-Coquelard, S. Sorgues, L. Ruhlmann and I. Lampre, Appl. Catal., A, 2010, 373, 160–167 CrossRef CAS.
- J. Premkumar and R. Ramaraj, J. Mol. Catal. A: Chem., 1999, 142, 153–162 CrossRef CAS.
- J. Premkumar and R. Ramaraj, J. Photochem. Photobiol., A, 1997, 110, 53–58 CrossRef CAS.
- M. A. Khaderbad, U. Roy, M. Yedukondalu, M. Rajesh, M. Ravikanth and V. R. Rao, IEEE Trans. Nanotechnol., 2010, 9, 335–337 CrossRef.
- D. S. Hecht, R. J. A. Ramirez, M. Briman, E. Artukovic, K. S. Chichak, J. F. Stoddart and G. Gruner, Nano Lett., 2006, 6, 2031–2036 CrossRef CAS.
- C. Cioffi, S. p. Campidelli, C. Sooambar, M. Marcaccio, G. Marcolongo, M. Meneghetti, D. Paolucci, F. Paolucci, C. Ehli, G. M. A. Rahman, V. Sgobba, D. M. Guldi and M. Prato, J. Am. Chem. Soc., 2007, 129, 3938–3945 CrossRef CAS.
- D. M. Guldi, H. Taieb, G. M. A. Rahman, N. Tagmatarchis and M. Prato, Adv. Mater., 2005, 17, 871–875 CrossRef CAS.
- H. Murakami, T. Nomura and N. Nakashima, Chem. Phys. Lett., 2003, 378, 481–485 CrossRef CAS.
- G. M. A. Rahman, D. M. Guldi, S. Campidelli and M. Prato, J. Mater. Chem., 2006, 16, 62–65 RSC.
- H. Li, B. Zhou, Y. Lin, L. Gu, W. Wang, K. A. S. Fernando, S. Kumar, L. F. Allard and Y.-P. Sun, J. Am. Chem. Soc., 2004, 126, 1014–1015 CrossRef CAS.
- A. Wojcik and P. V. Kamat, ACS Nano, 2010, 4, 6697–6706 CrossRef CAS.
- E.-Y. Choi, T. H. Han, J. Hong, J. E. Kim, S. H. Lee, H. W. Kim and S. O. Kim, J. Mater. Chem., 2010, 20, 1907–1912 RSC.
- A. C. Ferrari, Solid State Commun., 2007, 143, 47–57 CrossRef CAS.
- A. C. Ferrari, J. C. Meyer, V. Scardaci, C. Casiraghi, M. Lazzeri, F. Mauri, S. Piscanec, D. Jiang, K. S. Novoselov, S. Roth and A. K. Geim, Phys. Rev. Lett., 2006, 97, 187401 CrossRef CAS.
Footnotes |
| † Electronic Supplementary Information (ESI) available. See DOI: 10.1039/c2ra00792d/ |
| ‡ These authors contributed equally to this work |
| This journal is © The Royal Society of Chemistry 2012 |
