Nanostructured iron oxide catalysts with gold for the oxidation of carbon monoxide
Sónia A. C.
Carabineiro
*a,
Nina
Bogdanchikova
b,
Pedro B.
Tavares
c and
José L.
Figueiredo
a
aLaboratório de Catálise e Materiais, Associate Laboratory LSRE/LCM, Departamento de Engenharia Química, Faculdade de Engenharia, Universidade do Porto, 4200-465, Porto, Portugal. E-mail: sonia.carabineiro@fe.up.pt; Fax: +351 22 5081449; Tel: +351 22 5081582
bUniversidad Nacional Autónoma de México, Centro de Nanociencias y Nanotecnología, Carretera Tijuana-Ensenada, 22800, Ensenada, Baja California, Mexico
cUniversidade de Trás-os-Montes e Alto Douro, CQVR Centro de Química–Vila Real, Departamento de Química, 5001-911, Vila Real, Portugal
First published on 15th February 2012
Abstract
A commercial iron oxide support is compared with Fe2O3 samples prepared by decomposition of iron nitrate, at 300 °C and 500 °C and heating times varying from 30 min to 96 h in N2. Different methods were used for gold deposition, namely double impregnation (DIM), liquid phase reductive deposition (LPRD) and ultrasonication (US). Samples were characterised by N2 adsorption at −196 °C, high-resolution transmission electron microscopy, X-ray diffraction, X-ray photoelectron spectroscopy and temperature programmed reduction. CO oxidation was used as a test reaction to compare the catalytic activities. The best results were obtained for the sample produced by decomposition of nitrate at 300 °C for 1 h, which showed the largest surface area and highest amount of hydroxylated iron species. Increasing the calcination time and/or the temperature produced less active samples. Although LPRD materials showed the smallest gold nanoparticle sizes (1–12 nm), the best catalytic results were obtained for the DIM materials. This is most likely related to the oxidation state of gold (Au+) found in the DIM catalysts, in contrast with LPRD and US materials, where metallic gold (Au0) is present. Other samples showed lower activities. Nevertheless, all samples prepared by DIM had better catalytic activity than the Au/Fe2O3 World Gold Council reference catalyst.
Introduction
Carbon monoxide (CO) is a colourless, odourless, highly toxic, poisonous gas. Exposure to a few hundred ppm can cause permanent health damage or even death. Low level exposure, if continual, can also cause health problems in the long term. CO can thus be considered as one of the most dangerous environmental pollutants. Therefore, its removal and detection is of extreme importance for safe living.1–3Catalysts which promote CO oxidation at room temperature will find many practical applications, including air-purification devices for indoor spaces (including gas masks), and for cleaning automotive exhaust gases. CO removal is also required in CO2 lasers, and in polymer electrolyte fuel cell (PEFC) usage, where the CO concentration in the hydrogen rich gas must be selectively reduced to less than 100 ppm.1–4
Haruta and co-workers have intensively investigated the ability of gold catalysts to catalyse this reaction.5–11 In their early work in the 80s, the activity of supported gold catalysts came as a surprise,12,13 but it is now well known that supported gold nanocatalysts are effective for CO oxidation at very low temperatures, being active even at −70 °C.1–4,14–16
Activities do, however, depend on the choice of the metal oxide support. Iron oxides are a good choice due to their lower cost, greater availability and improved catalytic performance for several reactions, when compared to other traditional supports, such as TiO2,1,2,5,6,12,13,17–22 being considered one of the most active supports for catalysis2,12,22–24 and sensing.25–31 Moreover, large amounts of oxygen can be present on Fe2O3, which most likely represents the oxygen supply during the reaction.22 This is important, considering that the Bond and Thompson mechanism (first proposed in 200014 and substantiated by subsequent results of several authors32) takes place. Moreover, Gupta and co-workers33,34 demonstrated that the oxidation of CO on both Fe2O3 and Au/Fe2O3 occurs by means of similar redox mechanisms, involving the removal and replenishment of lattice oxygen, the presence of gold promoting these processes.
Hematite (α-Fe2O3) is the most active and stable iron oxide under ambient conditions, and is widely used as a catalyst, support or sensor.17,24,28,31,35–42 The shape and size of α-Fe2O3 nanoparticles are also important for their chemical and physical properties. Gedanken and co-workers found that the catalytic activity can be improved by using α-Fe2O3 nanorods with pores, of a size comparable to the size of very small Au nanoparticles (1–5 nm), so that these pores are suitable to accommodate or fix gold inside them.40
Most Au/Fe2O3 catalysts mentioned in the literature have been prepared by deposition–precipitation (DP)17,20,43–51 or co-precipitation (CP)13,35,37,47,52–63 procedures, although some authors also recently reported Au/Fe2O3 materials prepared by colloidal methods.24,40–42,64-66 In this work, different methods were used for gold deposition, namely double impregnation (DIM),67–73 liquid phase reductive deposition (LPRD)73–75 and ultrasonication (US).69,73 As far as we know, DIM was only used by Bowker et al. for the preparation of Au/TiO2 samples76 and by our group for the preparation of gold supported on MnOx,67 ceria,68,71,72 ZnO,69 Ce–Ti–O70 and CuO, NiO, La2O3 and Y2O3 catalysts.73 LPRD has been used by Sunagawa et al. to prepare Pt and Au catalysts on Fe2O3, FeOOH, ZrO2 and TiO2 supports,77 and also by us for CeO2,74 TiO275 and CuO, NiO, La2O3 and Y2O3 catalysts.73 US was only used by our group to prepare gold on ZnO69 and CuO, NiO, La2O3 and Y2O3 materials.73 Therefore, to the best of our knowledge, this is the first report on the use of DIM and US methods for the preparation of Au/Fe2O3 catalysts.
In this work, we compare a commercial Fe2O3 support (Fe-com) with Fe2O3 supports prepared by decomposition (calcination) of iron nitrate at several temperatures (300 °C and 500 °C) and heating times (from 30 min to 96 h) in N2. After gold loading, no further treatment was carried out on the samples.
The Au/Fe2O3 materials were tested for CO oxidation. Apart from its potential applications, described above, this reaction is also a simple, well established model reaction, used to evaluate gold catalysts, which, although intensively studied, is not yet fully understood.1–4,14,15
Experimental
Iron oxide supports
Several Fe2O3 samples were prepared by decomposition (calcination) of iron(III) nitrate trihydrate (Sigma Aldrich) at 300 °C and 500 °C with heating times varying from 30 min to 96 h in N2 (with a flow rate of 50 cm3 min−1). Hereafter, these samples will be referred to as Fe-temp-time (for example Fe-300-1, meaning Fe2O3 prepared at 300 °C for 1 h). A list of all samples prepared is displayed in Table 1.| Fe2O3 samples | BET area (m2 g−1) | Particle size (nm) | Conversion of CO (%)a |
|---|---|---|---|
| a obtained at 250 °C, with 200 mg of sample, 5% CO, 10% O2 in He in a total flow rate of 50 cm3 min−1. | |||
| Fe-com | 6 | 63 | 9 |
| Fe-com-300-1 | 9 | 42 | 13 |
| Fe-com-300-2 | 8 | 9 | |
| Fe-com-300-5 | 8 | 8 | |
| Fe-300-0.5 | 91 | 70 | |
| Fe-300-1 | 109 | 17 | 78 |
| Fe-300-2 | 101 | 72 | |
| Fe-300-12 | 80 | 20 | 69 |
| Fe-300-24 | 68 | 47 | |
| Fe-300-96 | 37 | 27 | 38 |
| Fe-500-1 | 24 | 30 | 19 |
| Fe-500-96 | 13 | 13 | |
A commercial Fe2O3 support from Sigma Aldrich (Fe-com) was used for comparison purposes. This sample was also heat treated for comparison. Fe-com-300-1, for example, means that the sample originates from a treatment of the commercial material at 300 °C for 1 h in N2 (50 cm3 min−1).
Au/iron oxide materials
Gold loading was carried out by double impregnation (DIM), liquid phase reductive deposition (LPRD) and ultrasonication (US) methods. The DIM method is similar to traditional impregnation (the support is impregnated with a solution of HAuCl4 using sonication), but using a second impregnation step with addition of an aqueous solution of Na2CO3 (1 M), under constant ultrasonic stirring.67–73 LPRD consists of mixing a solution of the gold precursor with a solution of NaOH (with a ratio of 1![[thin space (1/6-em)]](https://www.rsc.org/images/entities/char_2009.gif) :4 in weight) with stirring at room temperature.73–75 The resulting solution is aged for 24 h in the dark at room temperature, to complete the hydroxylation of Au3+ ions. Then the appropriate amount of support is added to the solution and, after ultrasonic dispersion for 30 min, the suspension is aged in the oven at ∼100 °C overnight. US consists of dissolving the gold precursor in water and methanol (15:1 ratio), mixing with the support, and sonicating for 8 h.69,73 In all cases, the resulting solid is washed repeatedly with distilled water for chloride removal (which is well known to cause sinterization of Au nanoparticles, thus rendering them inactive2,3,74), and dried in the oven at ∼110 °C overnight. In order to provide a comparison, a Au/Fe2O3 gold reference catalyst, Type C, supplied by the World Gold Council (WGC),78 was also used.
:4 in weight) with stirring at room temperature.73–75 The resulting solution is aged for 24 h in the dark at room temperature, to complete the hydroxylation of Au3+ ions. Then the appropriate amount of support is added to the solution and, after ultrasonic dispersion for 30 min, the suspension is aged in the oven at ∼100 °C overnight. US consists of dissolving the gold precursor in water and methanol (15:1 ratio), mixing with the support, and sonicating for 8 h.69,73 In all cases, the resulting solid is washed repeatedly with distilled water for chloride removal (which is well known to cause sinterization of Au nanoparticles, thus rendering them inactive2,3,74), and dried in the oven at ∼110 °C overnight. In order to provide a comparison, a Au/Fe2O3 gold reference catalyst, Type C, supplied by the World Gold Council (WGC),78 was also used.
Characterisation techniques
The materials were analysed by adsorption of N2 at −196 °C, in a Quantachrome NOVA 4200e apparatus. Temperature programmed reduction (TPR) experiments were performed in a fully automated AMI-200 Catalyst Characterization Instrument (Altamira Instruments). X-ray diffraction (XRD) analysis was carried out in a PAN'alytical X'Pert MPD equipped with a X'Celerator detector and secondary monochromator (Cu-Kα = 0.154 nm, 50 kV, 40 mA). The collected spectra were analysed by Rietveld refinement using PowderCell software, allowing the determination of the grain size. X-ray photoelectron spectroscopy (XPS) analysis was performed with a VG Scientific ESCALAB 200A spectrometer using Al Kα radiation (1486.6 eV) to determine Fe and Au oxidation states. Further details can be found elsewhere.67–69,72-74 High resolution transmission electron microscopy (HRTEM) and energy-dispersive X-ray spectroscopy (EDXS) were carried out on a FEI Tecnai F30 instrument.Catalytic tests
Catalytic activity measurements for CO oxidation were performed using a continuous-flow reactor. The catalyst sample weight was 200 mg and the feed gas (5% CO, 10% O2 in He) was passed through the catalytic bed at a total flow rate of 50 cm3 min−1. For the WGC sample, since it contained 5% Au, 40 mg were used instead, mixed with 160 mg of an inert sample (Carborundum, CSi, from VWR), in order to have the same mass, as performed in previous work.72 The composition of the outgoing gas stream was determined by gas chromatography. Further details can be found elsewhere.67–69,72–74Results and discussion
Characterisation of samples
Table 1 shows that the surface area obtained for the commercial Sigma Aldrich sample (6 m2 g−1), was lower than that reported for a similar Alfa Aesar commercial material (45 m2 g−1).81 Some samples reported in the literature had values ranging from 15 to to 260 m2 g−1.33,36,59,61,65,79,82–85 Thus, our values for the nitrate decomposition samples, ranging from 13 to 109 m2 g−1, fall within those reported by other authors for similar supports.
We found that loading the materials with gold did not significantly change the surface area and the particle size of the Fe2O3 support, as observed by other authors,33,59 therefore those results are not shown for simplicity. The BET of the catalyst from the WGC (with Au) was reported to be 39 m2 g−1.86
![[3 with combining macron]](https://www.rsc.org/images/entities/char_0033_0304.gif) c, 01-073-2234) can be identified for all nitrate prepared samples and also for the commercial material, only with differences in particle size (ranging from 17 to 63 nm). For nitrate prepared samples, the particle size increases with increasing calcination time (ranging from 17 to 27 nm, for 1 h to 96 h calcination time, respectively) and calcination temperature (from 17 to 30 nm for 300 °C and 500 °C, respectively), as seen in Table 1. Zhang et al.30 also obtained a rhombohedral phase of α-Fe2O3 (JCPDS no. 33-0664). Hematite was also found by other authors for Fe2O3 materials prepared by CP and DP,33,85,87 and for the WGC catalysts.86 Nanocrystallite Fe2O3 of 78 nm was obtained by CP by Khedr et al.88 All our samples, including the commercial material, had smaller particle sizes (Table 1).
c, 01-073-2234) can be identified for all nitrate prepared samples and also for the commercial material, only with differences in particle size (ranging from 17 to 63 nm). For nitrate prepared samples, the particle size increases with increasing calcination time (ranging from 17 to 27 nm, for 1 h to 96 h calcination time, respectively) and calcination temperature (from 17 to 30 nm for 300 °C and 500 °C, respectively), as seen in Table 1. Zhang et al.30 also obtained a rhombohedral phase of α-Fe2O3 (JCPDS no. 33-0664). Hematite was also found by other authors for Fe2O3 materials prepared by CP and DP,33,85,87 and for the WGC catalysts.86 Nanocrystallite Fe2O3 of 78 nm was obtained by CP by Khedr et al.88 All our samples, including the commercial material, had smaller particle sizes (Table 1).
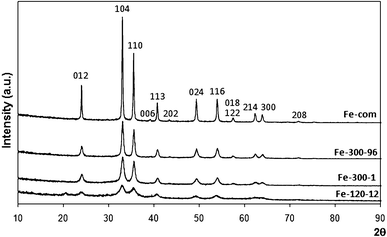 | ||
| Fig. 1 XRD spectra of commercial Fe2O3 (Fe-com) and Fe2O3 samples prepared from iron nitrate at 300 °C for 1 h (Fe-300-1) and 96 h (Fe-300-96) with Miller indices identified for α-Fe2O3 (hematite). The spectrum of iron nitrate dried overnight in the oven at 120 °C is also shown (Fe-120-12), where an oxyhydroxide phase, similar to hematite, is most likely present (see text for details). | ||
Some contribution from another phase (oxyhydroxide type), an intermediate between goethite and hematite,89,90 is also possible (as will be seen below, our TPR results showed some contribution from hydroxylated iron species for some nitrate prepared samples). Fig. 1 also shows the diffractogram of sample Fe-120-12, which is the iron nitrate dried in the oven at 120 °C overnight. This spectrum, although similar to the hematite 01-073-2234 phase, also fits the protohematite phase very well (α-Fe2−x/3(OH)xO3−x , x being the number of residual hydroxyls in the structure, rhombohedral, R 2/c, AMCSD 2228).90 However, it does not have the peak at 57.5° that is only present in diffractograms of the other samples, thus being undoubtedly related to Fe2O3 (it is a double peak with indices 018 and 122). A small peak at 20.6°, possibly related to other hydroxylated phases (not AMCSD 2228), is seen in the spectrum of Fe-120-12. This peak is not present in the calcined samples. Its identification is not easy, since it was assigned to a FeOOH phase mentioned in an old file of the ICSD database that is now deleted.
Cheng et al.80 also showed that both iron hydroxide and α-Fe2O3 could co-exist when the calcination temperature was higher than 250 °C, so it is possible that the same is happening with our samples, since the calcination temperature was 300 °C or 500 °C for the nitrate prepared samples. These authors believe that calcination at high temperature should be avoided, as it could lead to the formation of iron oxide and loss of surface area.79,80 In our work, as mentioned above, it was also found that increasing the calcination temperature from 300 °C to 500 °C causes a decrease in the surface area (Table 1). Heat treating the commercial sample, although it did not affect the surface area much, caused the particle size to decrease (Table 1).
Wu et al. also detected α-Fe2O3 together with FeOOH on an iron based catalyst prepared by precipitation of ferric chloride and ammonia.91 Other authors found that iron oxide was present as amorphous ferrihydrite at calcination temperatures below 300 °C, but that a phase transition occurred between 300 and 450 °C, hematite being found in that range.92 A transformation from disordered nanocrystalline iron oxyhydroxide for the catalyst dried at 120 °C, to hematite, for the calcined sample, occurred for catalysts prepared by CP using iron nitrate.60 These results are similar to ours.
We did not detect gold by XRD, possibly due to the low loading and small particle size. Addition of gold produced no structural changes in the iron oxide phase in the XRD spectra with respect to that of the parent supports, as also found by other authors.86
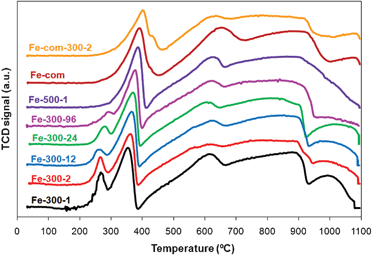 | ||
| Fig. 2 TPR spectra of Fe2O3 samples prepared from iron nitrate at 300 °C for 1, 2, 12, 24 and 96 h and at 500 °C for 1 h (Fe-300-1, Fe-300-2, Fe-300-12, Fe-300-24, Fe-300-96, Fe-500-1 respectively) and commercial sample as received (Fe-com) and treated at 300 °C for 2 h (Fe-com-300-2). | ||
The intensity of the first peak decreases as the calcination time increases, and is neither present in the Fe-com spectrum nor in the Fe-500 samples, showing that these samples do not contain hydroxylated species. Increasing the calcination temperature shifts the Fe2O3 → Fe3O4 transition peak to higher temperatures, but the peak of the Fe3O4 to FeO transition is not much affected.95 That is observed by comparing the samples treated at 300 °C with those treated at 500 °C. It is known that the reduction temperature from hematite to magnetite can also be influenced by the surface area of the material (an increase in surface area causes a shift to lower reduction temperatures).82,86,93 Our results displayed in Fig. 2 and Table 1 also confirm that.
The presence of gold shifted the first two peaks to lower temperatures (to ∼150 and 280 °C, respectively) as expected from literature36,47,59,82,84–86,93,95,97 (an example is shown in Fig. 3 for the Fe-300-1 sample, pure and loaded with gold by DIM). The reduction temperature of Fe2O3 to Fe3O4 is reported to decrease with increasing gold loading, so it was higher for the WGC catalyst, as observed by other authors.82,86,93 The subsequent reduction to metallic iron, at higher temperatures, was less influenced by the presence of gold (Fig. 3), as expected from literature,59,82,84 although some authors also report that this last peak can be shifted to lower temperatures by addition of gold47 and if there is some overlapping with the FeO peak, it will disappear upon gold loading.36
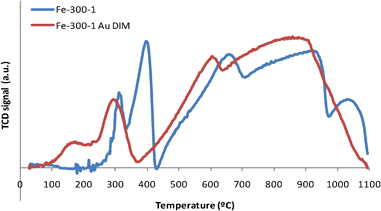 | ||
| Fig. 3 TPR spectra of Fe2O3 samples prepared from iron nitrate at 300 °C for 1 h, pure (Fe-300-1) and loaded with gold (Fe-300-1 Au DIM). | ||
Some authors observed an extra peak at temperatures ∼100 °C that was attributed to the reduction of Au oxides.47,85,95,98 This reduction, in Au/Fe2O3 materials, occurs at much lower temperature than in the case of bulk Au2O3, since there is some sort of interaction between the iron oxide support and the gold species.99 Other authors consider that this effect is more likely the consequence of a much higher surface area of Au/Fe2O3 catalysts,47 since when gold oxide is deposited on non-reducible supports like zeolites,100 it also undergoes reduction above those values. Some authors state that both the reduction of Au oxides and Fe2O3 to Fe3O4 peaks can occur simultaneously and peaks overlap,47,58,95 but others believe that such AuxOy species probably exist in the fresh catalyst either in a state of high dispersion, or in an amorphous form,85 as an increase in the calcination temperature results in decomposition of the gold oxide into metal.13 In our case, we cannot tell if the peak at ∼150 °C (Fig. 3) is just the shift to lower temperatures of the peak corresponding to the reduction of Fe2O3 or if there is also some contribution from the reduction of gold oxides, as the areas of these peaks are similar in the spectra with and without Au.
Fig. 4 depicts the results obtained for the Au/Fe-300-1 samples, showing that all of them have two peaks. It can be seen that the sample prepared by DIM is in the oxidised state (Au+) while samples prepared by LPRD and US are in the reduced state (Au0). Similar results were obtained for the Au/Fe-com samples (not shown).
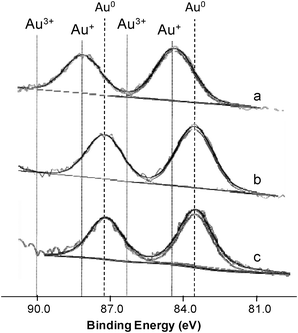 | ||
| Fig. 4 Au 4f XPS spectra with peak deconvolution of Au/Fe-300-1 samples prepared by DIM (a), LPRD (b) and US (c). | ||
Haruta and co-workers observed by XPS that on Au/α-Fe2O3 materials prepared by CP, gold was in the metallic state.35 On the other hand, Hutchings et al. and Deevi et al. observed Au cation species in the Au/Fe2O3 catalysts prepared by CP and DP, independently,47,60 but other authors found a slight negatively charged state of the Au particles.40 XPS and XAFS studies performed by Park and Lee showed both oxidised and metallic gold species, depending on the conditions, for materials prepared by DP.20 Similar results were obtained for our samples.
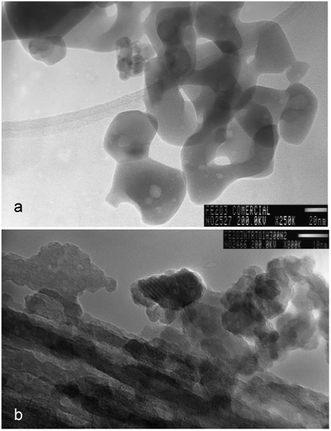 | ||
| Fig. 5 HRTEM images of Fe-com (a) and Fe-300-1 (b). | ||
Selected gold loaded samples were analysed by HRTEM (Fe-com and Fe-300-1 samples with gold loaded by DIM, LPRD and US). Representative images for DIM and LPRD gold loading methods for Fe-com and Fe-300-1 supports are shown in Fig. 6. Gold nanoparticles are seen as darker spots (this was confirmed by EDXS). The corresponding size histograms (obtained for an average of ∼150 particles counted in several obtained images), can be seen in Fig. 7 and a resume of the results found for the gold nanoparticles sizes is presented in Table 2. EDXS results confirmed the gold loading of 1% wt. Au.
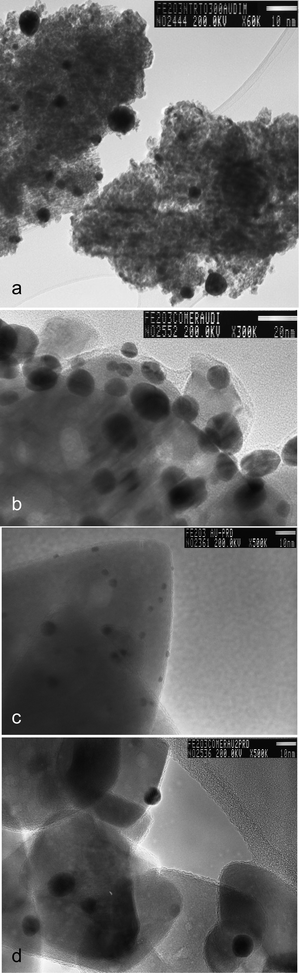 | ||
| Fig. 6 HRTEM image of the Fe-300-1 samples with gold loaded by DIM (a) and LPRD (c) and Fe-com samples with gold loaded by DIM (b) and LPRD (d). Gold nanoparticles are seen as darker spots. | ||
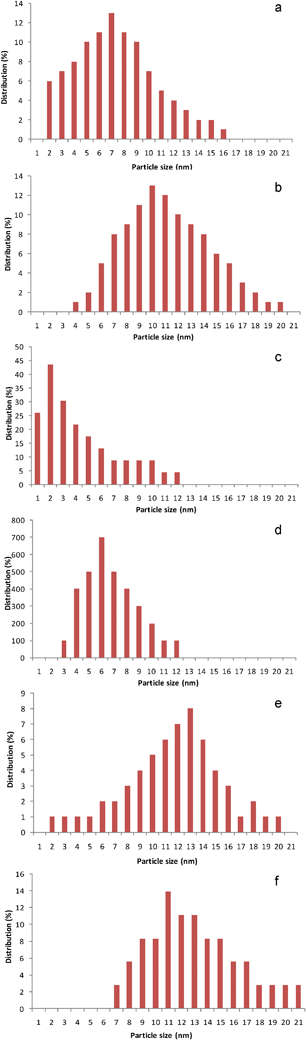 | ||
| Fig. 7 Gold nanoparticle size distribution histograms for the Fe-300-1 with Au loaded by DIM (a), LPRD (c) and US (e), and the Fe-com with Au loaded by DIM (b), LPRD (d) and US (f). | ||
| Au/Fe2O3 samples | Particle size range (nm) | Average particle size (nm) | Specific activity (molCOgAu−1h−1)c |
|---|---|---|---|
| a not determined. b from ref. 93. c obtained at room temperature, with 200 mg of sample, 5% CO, 10% O2 in He in a total flow rate of 50 cm3 min−1. d the mass used was 40 mg together with 160 mg of Carborundum (as explained in the Introduction). | |||
| Au/Fe-300-1 DIM | 2–16 | 7.4 | 0.94 |
| Au/Fe-300-1 LPRD | 1–12 | 4.3 | 0.24 |
| Au/Fe-300-1 US | 2–20 | 11.6 | 0.11 |
| Au/Fe-500-1 DIM | a | a | 0.27 |
| Au/Fe-500-1 LPRD | a | a | 0.16 |
| Au/Fe-500-1 US | a | a | 0.11 |
| Au/Fe-com DIM | 4–20 | 11.8 | 0.27 |
| Au/Fe-com LPRD | 3–12 | 6.8 | 0.12 |
| Au/Fe-com US | 7–21 | 11.9 | 0.01 |
| Au/Fe2O3 WGC | — | 3.7b | 0.10d |
It can be seen that smaller gold nanoparticles were obtained for the nanostructured support Fe-300-1, when compared with the Fe-com support, independently of the gold loading method. LPRD produced the smallest gold nanoparticles (1–12 nm) for both supports, followed by DIM (2–20 nm) and US (2–21 nm). Rare gold nanoparticles of ∼1 nm on the Fe-300-1 support can be seen on Fig. 6c, obtained by the LPRD method. Using this method, Sunagawa et al.77 obtained gold nanoparticles of 1–5 nm on α-Fe2O3 ellipsoids, 3–5 nm on α-Fe2O3 pseudocubes and 5–15 nm for α-Fe2O3 platelets.
Au/Fe2O3 catalysts prepared by CP, by several authors, showed mean diameters of the Au nanoparticles ranging from 2 to 15 nm.13,28,33,35,57,59,63,101 Variation of the calcination temperature from 120 °C to 400 °C can change the mean diameter of gold nanoparticles from 3.8 nm to 8.2 nm, respectively,60 while an increase to 600 °C can increase the size to up to 16.1 nm.23
Sizes ranging from 2.8 to 11 nm were reported for catalysts prepared by other authors by DP.22,31,45,47,50 The calcination temperature also influences the size, since materials prepared by this technique and calcined at 300 and 500 °C showed average gold diameters of 4 and 6 nm, respectively.20
Smaller gold nanoparticle sizes ranging from 1 to 5 nm were obtained for Au/Fe2O3 materials prepared by colloidal methods,24,40,65 while catalysts prepared by supporting the Au-phosphine complex Au(PPh3)(NO3) onto iron oxide supports gave mean gold particle sizes from 4 to 16 nm.19,21
Thus, the values obtained for our LPRD catalysts (Table 2) are within those reported in the literature for CP and DP. Larger values were obtained by DIM and US (Table 2). Another ultrasound-assisted reduction method, reported in literature, was not so efficient since it produced sizes of 20–25 nm,102 larger than ours (2–21 nm, by US).
Other authors showed that gold particles had sizes of mainly 3.7 ± 1.5 nm on the WGC reference catalyst.93 These results were in good agreement with others reported by Haruta et al.17 for a Au/α-Fe2O3 catalyst prepared with the same procedure (CP) used for the preparation of the reference catalyst.
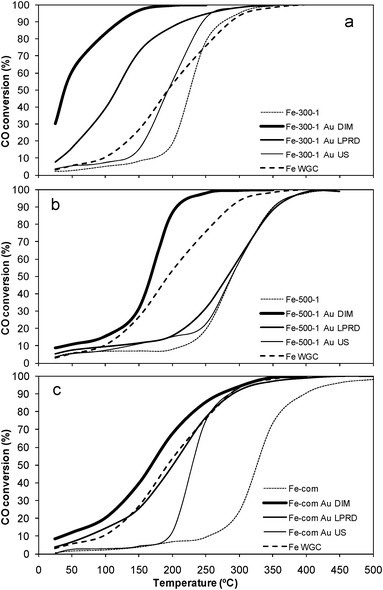 | ||
| Fig. 8 CO conversion with temperature for samples Fe-300-1 (a), Fe-com (b) and Fe-500-1 (c) alone and loaded with gold. | ||
It was found by other authors that modifications in the iron oxide structure, due to thermal pretreatments, could have an effect on the iron oxides activity, namely that the amount of ferrihydrite could influence the catalytic activity of Au/Fe2O3 catalysts in CO oxidation.103 In fact, Fig. 2 shows that Fe-300-1 has a reduction peak usually attributed to hydroxylated iron oxide species,36,82,84,86,93,94 which is absent in the profile of the Fe-500-1 sample.
It was suggested that ferrihydrite (an hydroxylated species) was responsible for the activation of oxygen and the decrease in the activity, observed with increasing calcination temperatures, could be related to the phase transition of ferrihydrite to hematite.95,103 However, this transition is more evident at temperatures above 300 °C,92 whereas the main changes in the catalytic activity occur below 300 °C. Therefore, it seems that gold has more effect on the activity than Fe2O3, although both gold and Fe2O3 are involved in the reaction. Gupta and co-workers33,34 demonstrated that the oxidation of CO on both Fe2O3 and Au/Fe2O3 occurs by means of similar redox mechanisms involving the removal and replenishment of lattice oxygen, where the presence of gold promotes these processes. The activity of Au/Fe2O3 systems has in fact been related to the capacity of highly dispersed gold to weaken the Fe–O bond thus increasing the mobility of the lattice oxygen, which is involved in the CO oxidation probably through a Mars–van Krevelen reaction mechanism (for the oxidation of VOCs).79,84 Smit et al. also found a crucial role is played by the amount of surface –OH groups (which is independent of chemical composition but is dependent of calcination temperature during the pre-treatment) on the activity of iron oxides for CO oxidation at low temperature.104
The TPR results obtained in this work (Fig. 2) are in agreement that lower calcination temperature produces more –OH groups. CO can react with those –OH groups forming very reactive adsorbed formates that can be oxidized to carbon dioxide and water by the lattice oxygen.104 It was also shown that OH groups play an important role for iron oxides loaded with Au.105,106
Park and Lee found that increasing the calcination temperature caused a decrease in the catalytic activity of Au/Fe2O3 catalysts for CO oxidation,20 as also found in our work. However, these authors report that activities decreased largely after 5 h of catalyst use (time on stream),20 while our catalysts proved stable up to 16 h (the maximum time tested).
Iwasawa and co-workers107 showed that the defects of an amorphous as-precipitated iron hydroxide Fe(OH)3* support could prevent Au species from aggregating, leading to formation of small gold metallic particles.107 This is in agreement with our results, since it was found that the porosity of Fe-300-1 was higher than that of Fe-500-1 and Fe-com (Table 1), and the first support was more active for CO oxidation than the latter two, both with and without Au (Tables 1 and 2 and Fig. 8).
Zhong et al. found that the insertion of the very small Au particles (1–5 nm), in α-Fe2O3 pores with comparable sizes, enhances the catalytic performance of the Au catalysts, probably because of increased contact between the Au particles and the support.40 Our Fe-300-1 was the support that showed the smallest pore size in this study (Table 1), with pores similar to nanoparticles (Fig. 5b), and it was shown that gold nanoparticles deposited on it also had the smallest sizes obtained in this work (Table 2 and Fig. 6 and 7), and were the most active for CO oxidation (Fig. 8a), confirming the results obtained by Zhong et al.
The values obtained in our work for the specific activities for CO oxidation measured at room temperature range from 0.1 to 0.94 molCOs−1molAu−1 (Table 2). Several other values are reported in literature for different Au on iron oxide materials; some lie within the same range as ours,20,24,50,51,59,65,66,108 others are smaller,50,51,63,65,66,102,108,109 and some larger.40,45,47,54 However, comparisons between these values are not always easy. As an example, a value of 3.96 molCOh−1gAu−1 was obtained by Zhong et al. for a 0.5 wt% Au/α-Fe2O3-nanorod catalyst at 30 °C, while the specific activity for the 0.5 wt% Au/Fe2O3-Fluka was 1.21 molCOh−1gAu−1 at 30 °C,40 so only 1/3 the value of the first. Under the same conditions, these authors obtained a specific activity of 1.75 molCOh−1gAu−1 for the 1% wt. Au/α-Fe2O3 WGC reference catalyst,40 which was one order of magnitude lower than that of the catalyst prepared in the laboratory by those authors. Under our conditions, as seen in Table 2, the specific activity of the WGC catalyst was 0.1 molCOh−1gAu−1 (which was one order of magnitude lower than the value reported by these authors for the same reference catalyst). One of the possible explanations for these differences might be that Zhong et al. used 1% CO and 3% Au,40 while we used 5% CO and 1% Au. In our conditions, the Au/Fe-300-1 catalyst had an activity one order of magnitude lower than that of the WGC material, which suggests that our material is as good as that reported by Zhong et al. although activity values are different, possibly due to the non similar conditions used.
In general, the CO oxidation activity is found to be related to gold nanoparticle size.1–4,6,7,14,16 That is valid for our samples prepared by US that showed the lowest activities, and the largest gold nanoparticle sizes (Fig. 8 and Table 2), when compared with particles prepared by other methods on the same support. However, the particle size is not able to explain everything, since LPRD is the method that presents the smallest gold nanoparticle sizes in our work (Table 2 and Fig. 6–7) and it is not the procedure that provides the most active samples (Table 2 and Fig. 8); instead, the best performances are obtained with DIM, which gives larger gold nanoparticle sizes, which in the case of Fe-com are even similar to the average values found for US (Table 2).
A possible explanation for this behaviour might be related to the oxidation state of Au, which was found to be Au+ for the DIM method and Au0 for the LPRD and US, both for Fe-300-1 (Fig. 4) and Fe-com (not shown) supports. As discussed earlier, there is a dispute in the literature concerning the “ideal” valency of gold in Au/Fe2O3 catalysts. Haruta and co-workers observed by XPS that gold was in the metallic state on very active Au/α-Fe2O3 catalysts prepared by CP.35 However, Hutchings et al. and Deevi et al. observed Au cation species in the Au/Fe2O3 catalysts prepared by CP and DP, independently,47,60 while other authors found a slight negatively charged state of the Au particles.40 XPS and XAFS studies performed by Park and Lee showed that, in addition to the particle size of metallic Au, the oxidation state of gold was important for CO oxidation, oxidized gold species being more active than metallic gold.20 Our results confirm the findings of these latter authors.
Conclusions
Iron oxide samples were prepared by decomposition of iron nitrate, at several temperatures and heating times. A commercial iron oxide support was used for comparison purposes. Gold was loaded by three different methods: double impregnation (DIM), liquid phase reductive deposition (LPRD) and ultrasonication (US). The best results for CO oxidation were obtained for the sample produced by decomposition of nitrate at 300 °C for 1 h, which showed the largest surface area, smallest particle size and largest amount of hydroxylated iron species. Increasing the calcination time or temperature produced less active samples, with smaller surface areas and a smaller amount of hydroxylated species. US provided the largest gold nanoparticle sizes, explaining its worse performance in CO oxidation. LPRD showed the smallest nanoparticle sizes, but DIM produced the most active materials, the sample supported on Fe2O3 prepared at 300 °C for 1 h being the most active. A possible explanation lies in the oxidation state of gold, which was found to be +1 for the DIM samples and metallic for the LPRD and US materials. Possibly for this reason, all samples prepared by DIM showed better catalytic activity than the Au/Fe2O3 World Gold Council reference catalyst.Acknowledgements
Authors thank Fundação para a Ciência e a Tecnologia (FCT), Portugal, for financial support (CIENCIA 2007 program for SACC and and project PTDC/EQU-ERQ/101456/2008, financed by FCT and FEDER in the context of Programme COMPETE.). Funds from Mexican CONACYT grant No 79062 and PAPIT-UNAM grant No IN 100908 are also acknowledged.References
- G. C. Bond, C. Louis and D. T. Thompson, Catalysis by Gold, Imperial College Press, London, United Kingdom, 2006 Search PubMed.
- S. A. C. Carabineiro and D. T. Thompson, in Nanocatalysis, ed. E.U. Heiz and U. Landman, Springer-Verlag, Berlin, Heidelberg, New York, 1st Editon, 2007, pp. 377 Search PubMed.
- S. A. C. Carabineiro and D. T. Thompson, in Gold: Science and Applications, ed. C. Corti and R. Holliday, CRC Press, Taylor and Francis Group, Boca Raton, London, New York, 1st Editon, 2010, pp. 89 Search PubMed.
- G. C. Bond and D. T. Thompson, Catal. Rev. Sci. Eng., 1999, 41, 319 CAS.
- M. Haruta, Catal. Today, 1997, 36, 153 CrossRef CAS.
- M. Haruta and M. Date, Appl. Catal., A, 2001, 222, 427 CrossRef CAS.
- M. Haruta, CATTECH, 2002, 6, 102 CrossRef CAS.
- A. Haruta, Chem. Rec., 2003, 3, 75 CrossRef.
- M. Haruta, Gold Bull., 2004, 37, 27 CrossRef CAS.
- G. J. Hutchings and M. Haruta, Appl. Catal., A, 2005, 291, 2 CrossRef CAS.
- M. Date, H. Imai, S. Tsubota and M. Haruta, Catal. Today, 2007, 122, 222 CrossRef CAS.
- M. Haruta, T. Kobayashi, H. Sano and N. Yamada, Chem. Lett., 1987, 405 CrossRef CAS.
- M. Haruta, N. Yamada, T. Kobayashi and S. Iijima, J. Catal., 1989, 115, 301 CrossRef CAS.
- G. C. Bond and D. T. Thompson, Gold Bull., 2000, 33, 41 CrossRef CAS.
- A. S. K. Hashmi and G. J. Hutchings, Angew. Chem., Int. Ed., 2006, 45, 7896 CrossRef.
- V. Aguilar-Guerrero and B. C. Gates, Catal. Lett., 2009, 130, 108 CrossRef CAS.
- M. Haruta, S. Tsubota, T. Kobayashi, H. Kageyama, M. J. Genet and B. Delmon, J. Catal., 1993, 144, 175 CrossRef CAS.
- H. C. Liu, A. I. Kozlov, A. P. Kozlova, T. Shido and Y. Iwasawa, Phys. Chem. Chem. Phys., 1999, 1, 2851 RSC.
- A. P. Kozlova, A. I. Kozlov, S. Sugiyama, Y. Matsui, K. Asakura and Y. Iwasawa, J. Catal., 1999, 181, 37 CrossRef CAS.
- E. D. Park and J. S. Lee, J. Catal., 1999, 186, 1 CrossRef CAS.
- A. I. Kozlov, A. P. Kozlova, K. Asakura, Y. Matsui, T. Kogure, T. Shido and Y. Iwasawa, J. Catal., 2000, 196, 56 CrossRef CAS.
- M. M. Schubert, S. Hackenberg, A. C. van Veen, M. Muhler, V. Plzak and R. J. Behm, J. Catal., 2001, 197, 113 CrossRef CAS.
- P. Landon, J. Ferguson, B. E. Solsona, T. Garcia, A. F. Carley, A. A. Herzing, C. J. Kiely, S. E. Golunski and G. J. Hutchings, Chem. Commun., 2005, 3385 RSC.
- G. H. Wang, W. C. Li, K. M. Jia, B. Spliethoff, F. Schuth and A. H. Lu, Appl. Catal., A, 2009, 364, 42 CrossRef CAS.
- N. Funazaki, A. Hemmi, S. Ito, Y. Asano and S. Yamashita, Sens. Actuators, B, 1993, 13–14, 536 CrossRef.
- G. Neri, A. Bonavita, S. Galvagno, P. Siciliano and S. Capone, Sens. Actuators, B, 2002, 82, 40 CrossRef.
- G. Neri, A. Bonavita, S. Galvagno, C. Pace and N. Donato, J. Mater. Sci.: Mater. Electron., 2002, 13, 561 CrossRef CAS.
- G. Neri, A. Bonavita, C. Milone and S. Galvagno, Sens. Actuators, B, 2003, 93, 402 CrossRef.
- G. Neri, A. Bonavita, G. Rizzo, S. Galvagno, N. Donato and L. S. Caputi, Sens. Actuators, B, 2004, 101, 90 CrossRef.
- J. Zhang, X. H. Liu, X. Z. Guo, S. H. Wu and S. R. Wang, Chem.–Eur. J., 2010, 16, 8108 CAS.
- X. H. Liu, J. Zhang, X. Z. Guo, S. H. Wu and S. R. Wang, Nanotechnology, 2010, 21, 095501 CrossRef (7 pages).
- G. Bond and D. Thompson, Gold Bull., 2009, 42, 247 CrossRef CAS.
- A. K. Tripathi, V. S. Kamble and N. M. Gupta, J. Catal., 1999, 187, 332 CrossRef CAS.
- N. M. Gupta and A. K. Tripathi, Gold Bull., 2001, 34, 120 CrossRef CAS.
- W. S. Epling, G. B. Hoflund, J. F. Weaver, S. Tsubota and M. Haruta, J. Phys. Chem., 1996, 100, 9929 CrossRef CAS.
- L. I. Ilieva, D. H. Andreeva and A. A. Andreev, Thermochim. Acta, 1997, 292, 169 CrossRef CAS.
- C. Sze, E. Gulari and B. G. Demczyk, Mater. Lett., 1998, 36, 11 CrossRef CAS.
- G. Neri, A. Bonavita, S. Galvagno, L. Caputi, D. Pacilè, R. Marsico and L. Papagno, Sens. Actuators, B, 2001, 80, 222 CrossRef.
- P. Landon, J. Ferguson, B. E. Solsona, T. Garcia, S. Al-Sayari, A. F. Carley, A. A. Herzing, C. J. Kiely, M. Makkee, J. A. Moulijn, A. Overweg, S. E. Golunski and G. J. Hutchings, J. Mater. Chem., 2006, 16, 199 RSC.
- Z. Zhong, J. Ho, J. Teo, S. Shen and A. Gedanken, Chem. Mater., 2007, 19, 4776 CrossRef CAS.
- Z. Zhong, J. Teo, M. Lin and J. Ho, Top. Catal., 2008, 49, 216 CrossRef CAS.
- Z. Y. Zhong, J. Highfield, M. Lin, J. Teo and Y. F. Han, Langmuir, 2008, 24, 8576 CrossRef CAS.
- D. Andreeva, T. Tabakova, V. Idakiev, P. Christov and R. Giovanoli, Appl. Catal., A, 1998, 169, 9 CrossRef CAS.
- G. Smit, Croat. Chem. Acta, 2003, 76, 269 CAS.
- M. Khoudiakov, M. C. Gupta and S. Deevi, Nanotechnology, 2004, 15, 987 CrossRef CAS.
- H. Y. Lin and Y. W. Chen, Ind. Eng. Chem. Res., 2005, 44, 4569 CrossRef CAS.
- M. Khoudiakov, M. C. Gupta and S. Deevi, Appl. Catal., A, 2005, 291, 151 CrossRef CAS.
- F. Moreau and G. C. Bond, Catal. Today, 2006, 114, 362 CrossRef CAS.
- W. K. Jozwiak, E. Kaczmarek and W. Ignaczak, Pol. J. Chem., 2008, 82, 213 CAS.
- R. Liu, C. Zhang and J. Ma, J. Rare Earths, 2010, 28, 376 CrossRef CAS.
- Z.-M. Cui, Z. Chen, L.-Y. Jiang, W.-G. Song and L. Jiang, Mater. Lett., 2011, 65, 82 CrossRef CAS.
- S. D. Gardner, G. B. Hoflund, D. R. Schryer, J. Schryer, B. T. Upchurch and E. J. Kielin, Langmuir, 1991, 7, 2135 CrossRef CAS.
- S. K. Tanielyan and R. L. Augustine, Appl. Catal., A, 1992, 85, 73 CrossRef CAS.
- A. M. Visco, A. Donato, C. Milone and S. Galvagno, React. Kinet. Catal. Lett., 1997, 61, 219 CrossRef CAS.
- M. J. Kahlich, H. A. Gasteiger and R. J. Behm, J. Catal., 1999, 182, 430 CrossRef CAS.
- L. Guczi, D. Horvath, Z. Paszti and G. Peto, Catal. Today, 2002, 72, 101 CrossRef CAS.
- N. A. Hodge, C. J. Kiely, R. Whyman, M. R. H. Siddiqui, G. J. Hutchings, Q. A. Pankhurst, F. E. Wagner, R. R. Rajaram and S. E. Golunski, Catal. Today, 2002, 72, 133 CrossRef CAS.
- G. Y. Wang, H. L. Lian, W. X. Zhang, D. Z. Jiang and T. H. Wu, Kinet. Catal., 2002, 43, 433 CrossRef CAS.
- B. E. Solsona, T. Garcia, C. Jones, S. H. Taylor, A. F. Carley and G. J. Hutchings, Appl. Catal., A, 2006, 312, 67 CrossRef CAS.
- G. J. Hutchings, M. S. Hall, A. F. Carley, P. Landon, B. E. Solsona, C. J. Kiely, A. Herzing, M. Makkee, J. A. Moulijn, A. Overweg, J. C. Fierro-Gonzalez, J. Guzman and B. C. Gates, J. Catal., 2006, 242, 71 CrossRef CAS.
- W. L. Deng, C. Carpenter, N. Yi and M. Flytzani-Stephanopoulos, Top. Catal., 2007, 44, 199 CrossRef CAS.
- S. Al-Sayari, A. F. Carley, S. H. Taylor and G. J. Hutchings, Top. Catal., 2007, 44, 123 CrossRef CAS.
- S. Kudo, T. Maki, M. Yamada and K. Mae, Chem. Eng. Sci., 2010, 65, 214 CrossRef CAS.
- Z. Y. Zhong, J. Y. Lin, S. P. Teh, J. Teo and F. M. Dautzenberg, Adv. Funct. Mater., 2007, 17, 1402 CrossRef CAS.
- Y. Liu, C. J. Jia, J. Yamasaki, O. Terasaki and F. Schuth, Angew. Chem., Int. Ed., 2010, 49, 5771 CrossRef CAS.
- H. F. Yin, Z. Ma, M. F. Chi and S. Dai, Catal. Today, 2011, 160, 87 CrossRef CAS.
- S. A. C. Carabineiro, S. S. T. Bastos, J. J. M. Orfao, M. F. R. Pereira, J. J. Delgado and J. L. Figueiredo, Catal. Lett., 2010, 134, 217 CrossRef CAS.
- S. A. C. Carabineiro, S. S. T. Bastos, J. J. M. Órfão, M. F. R. Pereira, J. J. Delgado and J. L. Figueiredo, Appl. Catal., A, 2010, 381, 150 CrossRef CAS.
- S. A. C. Carabineiro, B. F. Machado, R. R. Bacsa, P. Serp, G. Dražić, J. L. Faria and J. L. Figueiredo, J. Catal., 2010, 273, 191 CrossRef CAS.
- S. A. C. Carabineiro, A. M. T. Silva, G. Drazic and J. L. Figueiredo, in Studies in Surface Science and Catalysis, ed. E. M. Gaigneaux, M. Devillers, S. Hermans, P. Jacobs, J. Martens and P. Ruiz, Elsevier, 2010, vol. 175, pp. 457 Search PubMed.
- S. A. C. Carabineiro, A. M. T. Silva, G. Dražić and J. L. Figueiredo, in Microscopy: Science, Technology, Applications and Education, Formatex Microscopy Book series, ed. A. Méndez-Vilas and J. Díaz, Formatex Research Center, 1st Editon, 2010, vol. 4, p. in press Search PubMed.
- S. A. C. Carabineiro, A. M. T. Silva, G. Dražić, P. B. Tavares and J. L. Figueiredo, Catal. Today, 2010, 154, 21 CrossRef CAS.
- S. A. C. Carabineiro, N. Bogdanchikova, M. Avalos-Borja, A. Pestryakov, P. Tavares and J. L. Figueiredo, Nano Res., 2011, 4, 180 CrossRef CAS.
- S. A. C. Carabineiro, A. M. T. Silva, G. Dražić, P. B. Tavares and J. L. Figueiredo, Catal. Today, 2010, 154, 293 CrossRef CAS.
- V. P. Santos, S. A. C. Carabineiro, P. B. Tavares, M. F. R. Pereira, J. J. M. Orfao and J. L. Figueiredo, Appl. Catal., B, 2010, 99, 198 CrossRef CAS.
- M. Bowker, A. Nuhu and J. Soares, Catal. Today, 2007, 122, 245 CrossRef CAS.
- Y. Sunagawa, K. Yamamoto, H. Takahashi and A. Muramatsu, Catal. Today, 2008, 132, 81 CrossRef CAS.
- http://www.utilisegold.com/uses_applications/catalysis/reference_catalysts/. .
- S. Minico, S. Scire, C. Crisafulli and S. Galvagno, Appl. Catal., B, 2001, 34, 277 CrossRef CAS.
- W.-H. Cheng, K.-C. Wu, M.-Y. Lo and C.-H. Lee, Catal. Today, 2004, 97, 145 CrossRef CAS.
- F. Moreau and G. C. Bond, Top. Catal., 2007, 44, 95 CrossRef CAS.
- G. Neri, A. M. Visco, S. Galvagno, A. Donato and M. Panzalorto, Thermochim. Acta, 1999, 329, 39 CrossRef CAS.
- F. Boccuzzi, A. Chiorino, M. Manzoli, D. Andreeva and T. Tabakova, J. Catal., 1999, 188, 176 CrossRef CAS.
- S. Minico, S. Scire, C. Crisafulli, R. Maggiore and S. Galvagno, Appl. Catal., B, 2000, 28, 245 CrossRef CAS.
- A. Venugopal, J. Aluha, D. Mogano and M. S. Scurrell, Appl. Catal., A, 2003, 245, 149 CrossRef CAS.
- C. Milone, R. Ingoglia, L. Schipilliti, C. Crisafulli, G. Neri and S. Galvagno, J. Catal., 2005, 236, 80 CrossRef CAS.
- A. Luengnaruemitchai, D. T. K. Thoa, S. Osuwan and E. Gulari, Int. J. Hydrogen Energy, 2005, 30, 981 CrossRef CAS.
- M. H. Khedr, K. S. A. Halim, M. I. Nasr and A. M. El-Mansy, Mater. Sci. Eng., A, 2006, 430, 40 CrossRef.
- E. Mendelovici, R. Villalba and A. Sagarzazu, Mater. Res. Bull., 1982, 17, 241 CrossRef CAS.
- A. F. Gualtieri and P. Venturelli, Am. Mineral., 1999, 84, 895 CAS.
- K. C. Wu, Y. L. Tung, Y. L. Chen and Y. W. Chen, Appl. Catal., B, 2004, 53, 111 CrossRef CAS.
- R. M. Finch, N. A. Hodge, G. J. Hutchings, A. Meagher, Q. A. Pankhurst, M. R. H. Siddiqui, F. E. Wagner and R. Whyman, Phys. Chem. Chem. Phys., 1999, 1, 485 RSC.
- C. Milone, C. Crisafulli, R. Ingoglia, L. Schipilliti and S. Galvagno, Catal. Today, 2007, 122, 341 CrossRef CAS.
- S. Albonetti, R. Bonelli, R. Delaigle, C. Femoni, E. M. Gaigneaux, V. Morandi, L. Ortolani, C. Tiozzo, S. Zacchini and F. Trifiro, Appl. Catal., A, 2010, 372, 138 CrossRef CAS.
- J. M. Hua, K. M. Wei, Q. Zheng and X. Y. Lin, Appl. Catal., A, 2004, 259, 121 CrossRef CAS.
- S. PalDey, S. Gedevanishvili, W. Zhang and F. Rasouli, Appl. Catal., B, 2005, 56, 241 CrossRef CAS.
- B. A. A. Silberova, G. Mul, M. Makkee and J. A. Moulijn, J. Catal., 2006, 243, 171 CrossRef.
- Z. P. Hao, L. D. An, H. L. Wang and T. D. Hu, React. Kinet. Catal. Lett., 2000, 70, 153 CrossRef CAS.
- A. Venugopal and M. S. Scurrell, Appl. Catal., A, 2004, 258, 241 CrossRef CAS.
- J.-N. Lin and B.-Z. Wan, Appl. Catal., B, 2003, 41, 83 CrossRef CAS.
- A. A. Herzing, C. J. Kiely, A. F. Carley, P. Landon and G. J. Hutchings, Stud. Surf. Sci. Catal., 2008, 321, 1331 CAS.
- N. Perkas, Z. Zhong, J. Grinblat and A. Gedanken, Catal. Lett., 2008, 120, 19 CrossRef CAS.
- F. E. Wagner, S. Galvagno, C. Milone, A. M. Visco, L. Stievano and S. Calogero, J. Chem. Soc., Faraday Trans., 1997, 93, 3403 RSC.
- G. Smit, S. Zrncevic and K. Lazar, J. Mol. Catal. A: Chem., 2006, 252, 103 CrossRef CAS.
- S. T. Daniells, A. R. Overweg, M. Makkee and J. A. Moulijn, J. Catal., 2005, 230, 52 CrossRef CAS.
- G. Smit, N. Strukan, M. W. J. Craje and K. Lazar, J. Mol. Catal. A: Chem., 2006, 252, 163 CrossRef CAS.
- A. P. Kozlova, S. Sugiyama, A. I. Kozlov, K. Asakura and Y. Iwasawa, J. Catal., 1998, 176, 426 CrossRef CAS.
- Z.-M. Cui, L.-Y. Jiang, W.-G. Song and Y.-G. Guo, Chem. Mater., 2009, 21, 1162 CrossRef CAS.
- S. Kameoka and A. P. Tsai, J. Mater. Chem., 2010, 20, 7348 RSC.
| This journal is © The Royal Society of Chemistry 2012 |